Oct6 is one of the earliest TFs induced during the exit from naïve pluripotency
To shed light on the conversion of GRNs from naïve to formative pluripotency, we initially focused on the TFs induced at early stages of differentiation, since they could be crucial to GRN restructuring. Based on a thorough study performed by Yang and collaborators18, we identified TFs that were upregulated in the first 6 h of the transition and remained highly expressed at 48 h (Fig. S1A). This preliminary analysis revealed known facilitators of formative pluripotency, such as Otx2, Foxd3 and c-Myc15,16,19. Other TFs that exhibited this trend include the retinoic acid receptors Rarg and Rxrg, as well as Myrf, Ar, and Aff3. Interestingly, among these early-induced genes, Oct6 (also known as Pou3f1) was the one that displayed the most important induction when comparing mESCs vs. 48 h EpiLCs, and it was significantly upregulated only 2 h after the onset of differentiation (Fig. 1A). In contrast, other formative markers such as Fgf5, Otx2, and Dnmt3A were upregulated at later time points. The rapid induction of Oct6 transcription was accompanied by a significant decrease of the naïve TF Klf4 expression at 2 h, whereas other naïve TFs such as Nanog, Esrrb, and Tbx3 were downregulated at later time points. Quantitative immunofluorescence showed that OCT6 was not detected in naïve pluripotent ground state conditions and that its levels increased gradually as cells entered formative pluripotency, with all cells expressing this TF at 48 h of differentiation (Fig. 1B, Fig. S1B). In light of these results, we decided to assess the role of Oct6 in the dissolution of naïve pluripotency.
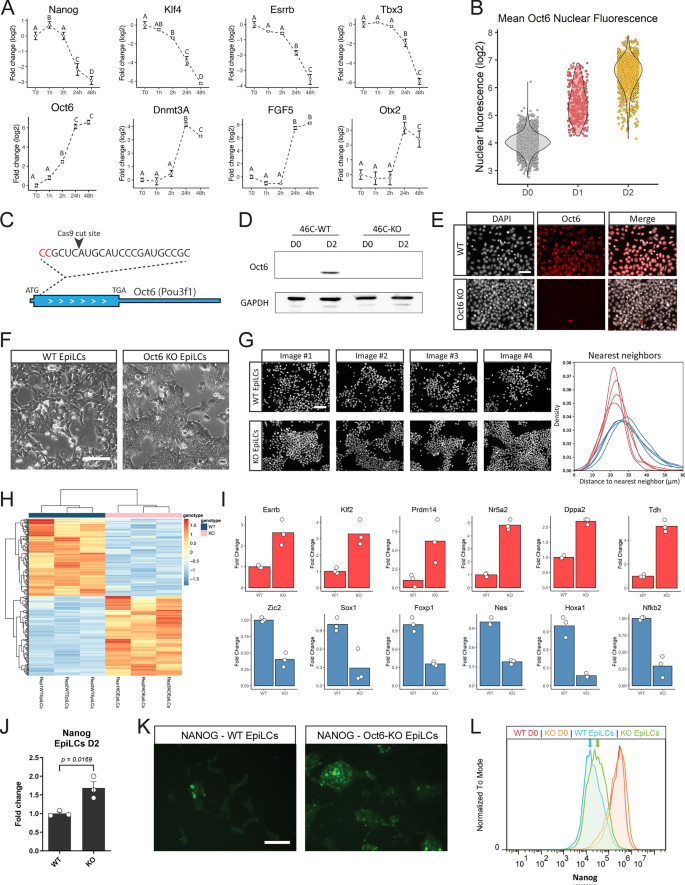
Loss of Oct6 affects the transition to formative pluripotency. (A) RT-qPCR analysis of naïve and formative pluripotency markers during the first hours of EpiLC differentiation. Results are presented as mean ± SEM for three independent replicates. Different letters indicate significant differences between time points (p < 0.05). (B) Quantification of nuclear OCT6 during EpiLC induction. The violin plot shows the distribution of OCT6 nuclear intensity for each timepoint and the circles show the mean fluorescence for individual cells. (C) Diagram of Oct6 genomic locus showing the sgRNA binding region for CRISPR/Cas9 mediated KO generation. (D) Representative immunoblot showing OCT6 depletion in Oct6 KO EpiLCs. GAPDH was used as a loading control. (E) Representative immunofluorescence of OCT6 in WT and KO 48 h EpiLCs. DAPI was used as a nuclear stain. Scale bar: 50 µm. (F) Morphological differences between WT and Oct6 KO cells induced to differentiate to EpiLCs. Brightfield micrographs of WT and Oct6 KO EpiLCs. Scale bar: 50 µm. (G) Left. Representative images of DAPI stained nuclei of WT and Oct6 KO EpiLCs. Right. Distribution of the distances to the nearest neighbor cells for all nuclei in the representative images (see Materials and Methods). (H) Heatmap of differentially expressed genes between WT and Oct6 KO EpiLCs as obtained from Deseq2 analysis. (I) Examples of DE gene expression for naïve pluripotency genes (top) and formative genes (bottom) from the RNA-seq results. (J) RT-qPCR analysis of Nanog in WT and Oct6 KO EpiLCs. Results are as presented as mean ± SEM for three independent replicates. (K) Representative immunofluorescence of NANOG in WT and Oct6 KO EpiLCs. Scale bar: 100 µm. (L) Flow cytometry analysis of Nanog expression showing higher expression in Oct6 KO cells compared to WT EpiLCs.
We then conducted an analysis of the Oct6 promoter by examining previously published ChIP-seq experiments to identify potential cis-regulatory elements (CRE) and likely regulators influencing Oct6 expression14,16,18,20,21,22. We discovered two CREs located 10 and 12 kb upstream of the transcription start site, which we refer to as CRE#1 and CRE#2, respectively (Fig. S2). In mESCs maintained in 2i + LIF, the TFs OCT4, OTX2, NANOG, and ESRRB bind only to CRE#2 and not to CRE#1. Interestingly, EpiLCs presented a reorganization of OCT4 and OTX2 binding, with their occupancy extended to CRE#1. Moreover, this regulatory element exhibited an increased signal of the active enhancer marks H3K27ac and H3K4me1, along with open chromatin detected by ATAC-seq. These analyses collectively suggest that CRE#2 acts as a regulatory sequence specific to naïve pluripotency, potentially involved in repressing Oct6 expression, while CRE#1 may function as an enhancer specific to EpiLCs.
Absence of Oct6 negatively affects the transition to formative pluripotency
To directly assess the role of Oct6 in the transition to EpiLCs, we generated an Oct6 knockout line (Oct6-KO) using CRISPR/Cas9 in 46C mESCs (Fig. 1C, Fig. S3A). Western blot and immunofluorescence analysis confirmed the lack of expression of OCT6 protein after induction to EpiLCs (Fig. 1D,E). Importantly, KO cells cultured in ground state conditions did not show any changes in morphology or the expression of the pluripotency transcription factor Nanog (Fig. S3B,C).
Oct6 has been previously reported as a key player in neural progenitor cell (NPC) differentiation. We thus evaluated the ability of the Oct6-KO cells to differentiate to the neural lineage by taking advantage of 46C mESCs line, that expresses GFP under the control of the neural marker Sox1. As expected, Oct6-KO cells produced significantly lower rates of SOX1-GFP + cells than WT 46C cells after 6 days of differentiation (~ 60% vs. ~ 90% SOX1-GFP + cells, respectively) (Fig. S3D). These data are consistent with Oct6 promoting neural induction, although its expression is not fundamental for the differentiation of NPCs.
We then addressed if Oct6-KO cells were affected in their differentiation capacity to EpiLCs. The transition from naïve to formative pluripotency is accompanied by important morphological changes. mESCs in the naïve ground state grow as tightly packed colonies with a dome shape. Upon EpiLC induction, cells quickly undergo a morphological conversion that includes flattening, diminished cell–cell interactions, and the formation of cellular protrusions14,23. Interestingly, we noticed that upon differentiation, Oct6-KO cells exhibited a more compact morphology with considerably fewer protrusions compared to parental WT cells (Fig. 1F). Indeed, quantification of the distribution of distances to each cell’s nearest neighbor both for WT and KO EpiLCs confirmed that Oct6-KO cells were more tightly packed and did not show colony-detached cells as in the case of WT EpiLCs (Fig. 1G). Thus, the absence of Oct6 impairs the phenotypic changes observed as mESCs exit naïve pluripotency.
To further assess the role of Oct6 during differentiation we performed an RNA sequencing (RNA-seq) experiment on WT and Oct6-KO EpiLCs. A total of 292 genes were differentially expressed (DE) with at least 1 log twofold change (Fig. 1H, Table S1). Functional annotation analysis of the DE genes with Gene Ontology (GO) revealed significant enrichment for the biological process term “regulation of cell motility” (GO:2000145) and the cellular component terms “plasma membrane bounded cell projection” (GO:0120025) and “cell leading edge” (GO:0031252), in agreement with the phenotypic effects previously observed (Table S2). Importantly, the GO term “cell differentiation” (GO:0030154) was also highly enriched, suggesting that KO EpiLCs may display alterations in their differentiation capacity. Among the DE genes, we found that key TFs associated with naïve pluripotency such as Esrrb, Klf2, Nr5a2, Dppa2, Tdh, Zic3, and Prdm14 showed higher expression levels in KO cells compared to WT EpiLCs (Fig. 1I, Fig. S3E). Interestingly, although not detected in the RNA-seq data due to the stringency of the analysis, assessment of the master pluripotency regulator Nanog also showed a slight but significant upregulation in KO EpiLCs, both at the mRNA and protein level (Fig. 1J–L). On the other hand, genes associated with the transition to formative pluripotency or neural differentiation such as Zic2, Sox1, Nestin, Foxp1, and Hoxa124 were less expressed in KO EpiLCs. Supporting the role of Oct6 in the changes in cell morphology, we also observed differences in genes associated with cell attachment such as Vimentin, E-Cadherin, N-Cadherin and Claudins 5, 6, 7 and 9 (Fig. S3E,F). In summary, our results indicate that the absence of Oct6 impairs the correct acquisition of the GRN associated with formative pluripotency.
We next intended to assess the genome-wide binding of OCT6 in EpiLCs. However, there are currently no suitable Oct6 antibodies for ChIP (see the Discussion). Therefore, we analyzed previously published data, where Matsuda et al. evaluated OCT6 binding in epiblast stem cells (EpiSCs) by overexpressing a tagged version of Oct625. Although EpiLCs and EpiSCs represent different developmental stages of post-implantation epiblast development, we reasoned that these data could be useful to infer which of the DE genes in our RNA-seq experiment could be direct targets of OCT6. Indeed, among the 292 DE genes detected in our RNA-seq, 114 were associated with OCT6 ChIP binding peaks in EpiSCs (Fig. S4A). This number was almost three times higher than the ~ 40 genes that would be expected out of chance, as evaluated by a bootstrap analysis. Interestingly, among the DE genes of our RNA-seq that contained OCT6 peaks in EpiSCs we found the naïve pluripotency expressed genes Dppa2, Prdm14, Nr5a2, and Vim and the EpiLCs induced genes Zic2, Zic3, Sox1, Nes, and Foxp1 (Fig. S4B). Overall, this analysis validated our RNA-seq results and identified genes that are potentially regulated by Oct6 at the transcriptional level by direct binding to their loci.
Overexpression of Oct6 in naïve cells represses Nanog and induces morphological changes associated with formative cells
To further study the role of Oct6 in the transition from naïve to formative pluripotency, we analyzed the effect of its premature expression in the pluripotent ground state. To that end, we engineered a new cell line where KO cells were complemented with a construct that allows the doxycycline (Dox) inducible expression of an HA-tagged version of OCT6, together with the fluorescent protein mCherry via a self-cleaving peptide (Fig. 2A). As expected, the addition of Dox induced the expression of the Oct6 and mCherry transgenes, while allowing the in vivo observation of red fluorescence in OCT6 overexpressing cells (Fig. 2B). Quantitative immunofluorescence confirmed that mCherry signal was a good proxy of OCT6 expression since their levels were highly and linearly correlated throughout several orders of magnitude (Fig. 2C). Importantly, induction of transgenic OCT6 expression in differentiating KO cells rescued the morphological effect observed previously, as seen by the reappearance of diminished cell–cell interactions and cell protrusions (Fig. 2D).
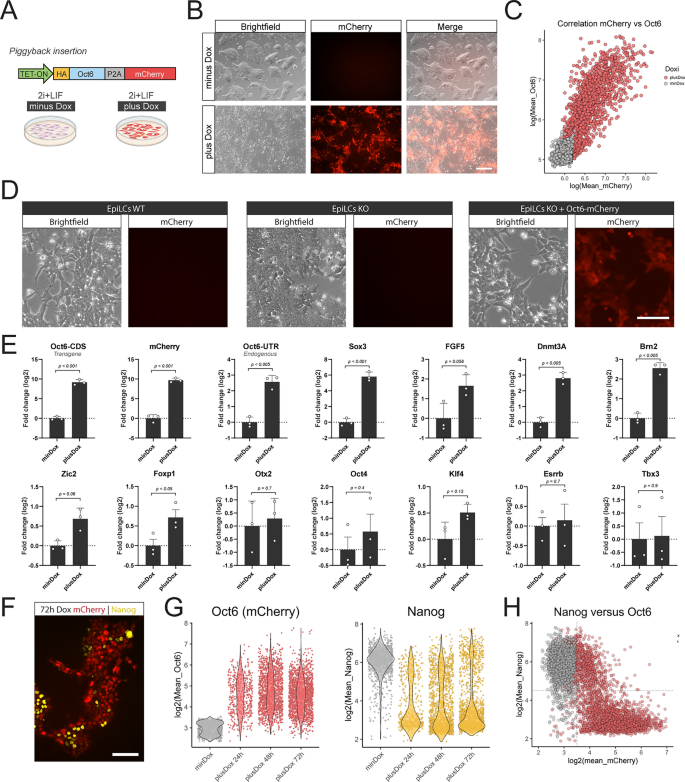
Overexpression of Oct6 in undifferentiated cells promotes morphological and transcriptional changes associated with formative pluripotency. (A) Diagram of the Oct6-P2A-mCherry overexpressing construct and the experimental design. (B) Treatment with Dox in 2i + LIF medium induces the expression of mCherry and a morphological transformation reminiscent of formative cells. Scale bar: 200 µm. (C) The plot shows the linear correlation of mean nuclear intensity fluorescence of mCherry and OCT6 obtained from OCT6 immunostaining of Dox treated cells. Each circle shows the data of one individual nucleus. (D) Overexpression of Oct6 in KO EpiLCs rescues the morphological differences observed between WT and KO EpiLCs. Scale bar: 50 µm. (E) RT-qPCR analysis of naïve and formative markers upon Dox treatment. Results are as presented as mean ± SEM for three independent replicates. (F) Representative immunofluorescence showing how Dox treatment induces the repression of NANOG in Oct6-P2A-mCherry expressing cells. Scale bar: 100 µm. (G) Quantification of immunofluorescence experiments of mCherry and NANOG in untreated or 24, 48, and 72 h Dox treated cells in 2i + LIF medium. The violin plots show the distribution of mCherry or NANOG nuclear intensity for each time point. The circles show the mean fluorescence for individual cells. (H) The plot shows the correlation between Oct6-P2A-mCherry and NANOG nuclear intensity expression in untreated or Dox-treated cells in 2i + LIF after immunostaining experiments. The circles show the mean fluorescence for individual cells. Data for 24, 48, and 72 h Dox treatment was pooled since they behaved similarly.
We next evaluated the effect of Oct6 expression in ground state conditions. While dox untreated cells formed typical compact dome-shaped colonies, the addition of Dox for 72 h induced a pronounced morphological change similar to the observed upon differentiation, with flattened colonies, diminished cell–cell interactions, and the formation of cellular protrusions (see Fig. 2B). These changes could be observed as early as 24 h after Dox treatment. As an additional control, no morphological changes were observed when using an inducible cell line that only overexpressed mCherry (Fig. S5A). Gene expression analysis showed that induction of Oct6 expression in 2i + LIF media upregulated the formative marker genes Sox3, Dnmt3A, Fgf5, Foxp1, Brn2, Zic2, Zic3, and endogenous Oct6, while not affecting Otx2 nor the general pluripotency marker Oct4 (Fig. 2E, Fig. S5B). Of the formative marker genes, only Dnmt3A lacks OCT6-binding peaks in EpiSCs, suggesting that the remaining genes could be direct targets of Oct6 (see Fig. S4B). Importantly, no significant changes were observed in the expression of the naïve pluripotency markers Esrrb, Rex1, Prdm14, Klf4, and Tbx3.
To gain a deeper insight into the regulatory effect of Oct6, we performed quantitative immunofluorescence experiments against key TFs regulated in this transition. OCT4, SOX2, and KLF4 showed similar protein levels between Dox treated and untreated mESCs, with only a slight reduction in the mean expression (Fig. S5C). In the case of SOX3, consistent with the gene expression data, we detected an important upregulation in a subset of OCT6 overexpressing cells, further reinforcing the regulatory link between these genes. We were particularly interested in the analysis of Nanog, not only because of its increased transcript levels in KO versus WT EpiLCs, but also because we discovered that NANOG and OCT6 proteins are expressed in a mutually exclusive manner in WT EpiLCs (Fig. S6A). Strikingly, while more than 90% of untreated cells expressed high levels of NANOG, we observed that overexpression of OCT6 repressed the expression of NANOG at the protein level in more than 70% of the cells, both at 24, 48 and 72 h of Dox (Fig. 2F, Fig. S6B). This effect was positively correlated with OCT6 levels and displayed a bistable switch-like behavior (Fig. 2G). As a result, cells that were mCherry negative were more than 80% NANOG positive, while mCherry expression two-fold above background levels already showed more than 40% NANOG negative cells, suggesting that mild OCT6 expression is sufficient to repress NANOG (Fig. 2H). For cells expressing mCherry at levels beyond four-fold above background, more than 90% of cells were NANOG negative. Interestingly, the fact that NANOG exhibited a clear bistabe “ON–OFF” expression might indicate the existence of a repressive feedback loop between these TFs.
We next wondered whether the repression of NANOG was reversible after releasing the induction of OCT6. To answer this, we removed Dox from OCT6-induced cultures and analyzed mCherry and NANOG protein levels at different time points after washing the cells (Fig. S7A). Interestingly, as early as 24 h after Dox removal, mCherry fluorescence returned to background levels and NANOG expression was restored (Fig. S7B). We did not observe appreciable differences in the levels of apoptosis among the experimental conditions, indicating that NANOG + /OCT6- derived from previously NANOG-/OCT6 + cells (Fig. S8). The morphological changes induced by Dox were also reverted and colonies re-acquired their typical highly packed dome shape. Overall, these results indicate that OCT6 expression in naïve culture conditions induces a reversible non-physiological identity with similarities to the formative pluripotent state.
OCT6 represses Nanog at the transcriptional level
To further analyze the dose dependency of OCT6 in NANOG repression, we took advantage of the expression of mCherry and analyzed 24 h Dox-treated cells by flow cytometry, gating them into 3 populations, Low, Med, and High, all of them with the same number of cells (Fig. 3A). In agreement with our previous results, ~ 75% of cells in the mCherry-low population displayed high NANOG levels, while these percentages decreased to ~ 35% and ~ 2% in the mCherry-Med and mCherry-High populations, respectively (Fig. 3B). By sorting these 3 cell populations, we confirmed the correlation between mCherry fluorescence and the mRNA levels of Oct6, mCherry, and the endogenous Sox3 mRNAs (Fig. 3C). Interestingly, mCherry expression showed an inverse relation with Nanog mRNA levels, suggesting that OCT6 repressed Nanog at the transcriptional level. Even though the mCherry-Med population contained 65% of cells with reduced NANOG protein levels, we only observed a roughly two-fold reduction in its mRNA levels. This could be explained by the contribution of the remaining ~ 35% fully NANOG positive cells, which can mask the downregulation when analyzing the mean Nanog mRNAs levels in the entire population. To complement these findings, we conducted a luciferase reporter assay to assess the impact of OCT6 expression on the Nanog promoter. Remarkably, induction of Oct6 using Dox resulted in a significant decrease in Nanog reporter activity, observed in both undifferentiated and 24 h differentiating cells (Fig. S9A). These findings provide compelling evidence of OCT6’s regulatory influence on the Nanog promoter, further supporting the notion of regulation at the transcriptional level. To reinforce these results, we performed single-molecule RNA-FISH experiments to detect individual Nanog mRNAs in OCT6 overexpressing cells. We first validated this method by analyzing undifferentiated mESCs and 24 h EpiLCs, which confirmed homogeneous expression of Nanog transcripts in naïve cells and a significant reduction as cells transited towards the formative state (Fig. S9B). After this validation, we evaluated the distribution of Nanog transcripts in undifferentiated cells induced to express Oct6 while simultaneously detecting NANOG and OCT6 proteins. As expected, cells with low levels of OCT6 protein were positive for Nanog transcripts and expressed NANOG at the protein level. Interestingly, cells with high levels of OCT6 protein did not present neither NANOG protein nor Nanog mRNAs (Fig. 3D). In summary, our results demonstrate that OCT6 expression in naïve ground state conditions represses Nanog at the transcriptional level. Together with the over-expression of formative-specific transcription factors such as Sox3 and the de novo DNA methyltransferase Dnmt3A, Oct6 might ultimately induce a shift in the naïve GRN that partially sets it to a formative configuration similar to the early post-implantation epiblast.
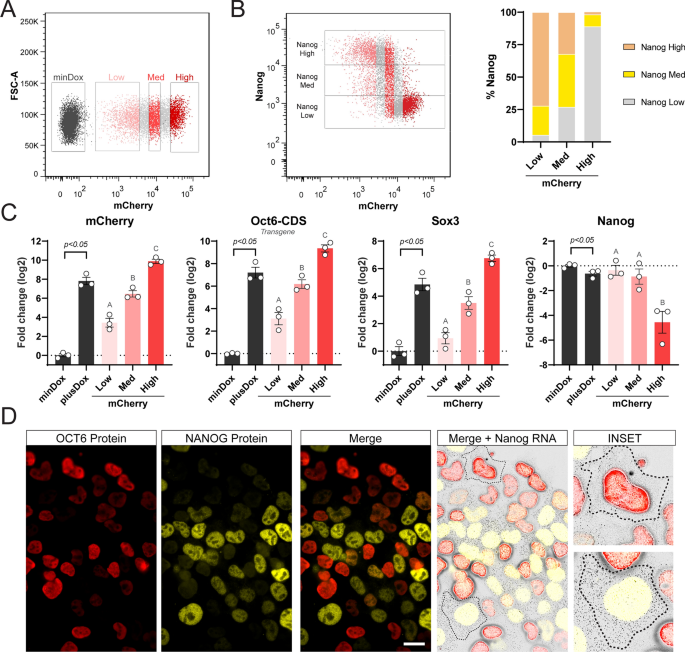
Oct6 represses Nanog at the transcriptional level. (A) Flow cytometry sorting of 24 h Dox treated cells into populations with low, medium (med), and high levels of mCherry. (B) Left. Correlation between mCherry and NANOG by flow cytometry. The different mCherry expressing subpopulations are shown. Right. The proportion of NANOG high, med, and low in the different mCherry expressing subpopulations. (C) RT-qPCR analysis of exogenous Oct6, mCherry, Sox3, and Nanog in Oct6 overexpressing cells. Untreated or Dox-treated cells (bulk population) are shown in black and statistically compared using a student’s t-test. The different mCherry expressing subpopulations are shown in shades of red and were compared using random block ANOVA. Different letters indicate significant differences (p < 0.05). (D) Simultaneous single-molecule RNA FISH against Nanog cytoplasmic transcripts and immunostaining against Nanog and Oct6 proteins. The insets show example cells with high and low Oct6 transgene expression. Scale bar: 20 µm.
Oct6 and Nanog form a double negative feedback loop with positive autoregulation
Our results so far demonstrated that OCT6 and NANOG are expressed in a mutually exclusive manner in WT EpiLCs and that OCT6 activates its own transcription while repressing the expression of Nanog. Moreover, Nanog is known to present positive autoregulation26,27. This led us to hypothesize that these two TFs could constitute a double negative feedback loop that could act as a toggle switch to initiate the dissolution of the naïve pluripotent state. Indeed, we have previously shown that NANOG binds to CRE#2 in Oct6’s promoter along with OCT4, OTX2 and ESRRB (see Fig. S2). To assess if OCT6 might also bind to the Nanog locus, we analyzed the aforementioned work by Matsuda et al. in EpiSCs. While the ChIP-seq signal in Nanog locus exhibited relatively low intensity, we observed a discrete accumulation of reads at the 5 kb distal enhancer located upstream of the Nanog TSS (Fig. S9C). This distal enhancer, recognized as a crucial CRE, is known to be targeted by other key pluripotency transcription factors28,29. This subtle observation prompted us to consider that OCT6 might bind to Nanog’s promoter in EpiLCs.
Finally, we evaluated if NANOG inhibited the expression of Oct6 by generating a cell line capable of expressing a Nanog transgene under the control of Dox (Fig. 4A). As in the case of Oct6 overexpression, this cell line also expresses mCherry via a self-cleaving peptide. To confirm the correct behavior of this line, we first differentiated them for 48 h in the presence or absence of Dox and confirmed that they expressed mCherry and NANOG in a highly correlated fashion (Fig. 4B,C). Next, we evaluated whether Dox-treated EpiLCs showed reduced levels of OCT6. Our results show that while mCherry negative cells exhibited normal levels of OCT6, mCherry expressing cells did not express this transcription factor, indicating that NANOG repressed Oct6 in a cell-autonomous fashion (Fig. 4D,E). Overall, our results indicate that these genes could constitute a toggle-switch circuit important for the correct dissolution of naïve pluripotency and the transition to a post-implantation epiblast-like phenotype.
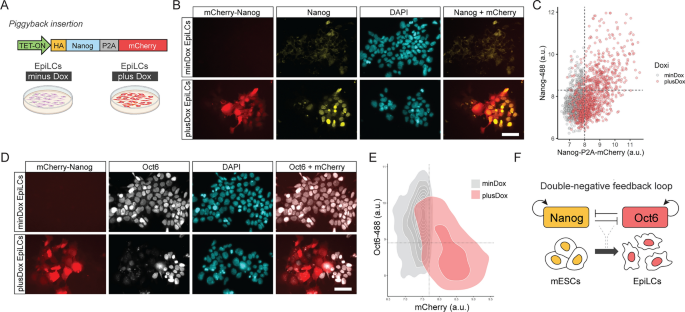
Oct6 and Nanog repress each other forming a double negative feedforward loop network motive. (A) Diagram of the Nanog-P2A-mCherry overexpressing construct and the experimental design. (B) Treatment with Dox during EpiLC differentiation induces the expression of mCherry. Scale bar: 50 µm. (C) The plot shows the correlation of mean nuclear intensity fluorescence of mCherry and NANOG obtained from NAONG immunostaining of Dox-treated EpiLCs. Each circle shows the data of one individual nucleus. (D) Immunostaining of OCT6 showing that Dox-treated Nanog-P2A-mCherry overexpressing cells do not express OCT6. Conversely, Dox-treated cells not expressing Nanog-P2A-mCherry normally express OCT6. Scale bar: 50 µm. (E) The plot shows the correlation of mean nuclear intensity fluorescence of Nanog-P2A-mCherry and OCT6, obtained from OCT6 immunostaining of Dox-treated EpiLCs. Each circle shows the data of one individual nucleus. (F) Proposed model of transcriptional circuitry between Nanog and Oct6 that regulates the transition from naïve to formative pluripotency.
- SEO Powered Content & PR Distribution. Get Amplified Today.
- PlatoData.Network Vertical Generative Ai. Empower Yourself. Access Here.
- PlatoAiStream. Web3 Intelligence. Knowledge Amplified. Access Here.
- PlatoESG. Carbon, CleanTech, Energy, Environment, Solar, Waste Management. Access Here.
- PlatoHealth. Biotech and Clinical Trials Intelligence. Access Here.
- Source: https://www.nature.com/articles/s41598-024-59247-5