Conditional adipocyte deletion of ESRRA enhances bone formation and counteracts marrow fat accumulation in DIO osteopenia mice
We utilized a conditional knockout strategy by intercrossing Esrrαfl/fl mice with Adipoq-Cre to generate adipocyte-specific Esrrα knockout mice (Esrrαfl/fl; AdipoqCre, denoted EsrrαAKO) (Supplementary Fig. 1a, b). EsrraAKO mice at the age of 10 weeks developed normally with no significant differences in growth, body weight, WAT phenotype and rectal temperature compared to Esrrαfl/fl littermates (Supplementary Fig. 1c–f). MicroCT analysis of distal femurs of EsrraAKO male mice showed no changes in trabecular bone volume per total volume (BV/TV), trabecular bone number (Tb.N) and trabecular bone thickness (Tb.Th) compared to control littermates; in addition, no changes were detected in plasma concentrations of procollagen type 1 N-terminal propeptide (P1NP, a bone formation marker) (Supplementary Fig. 1g–i). These data suggest that Esrrα deletion in adipocytes did not affect the phenotypes of WAT and bone in adult mice under normal physiological condition.
Obesity is believed to induce excessive adipocyte accumulation not only in peripheral WAT but also in bone marrow cavities in rodents and humans, contributing to detrimental disturbances in bone remodeling or bone regeneration2,27,28. Since ESRRA is responsive to stress-induced metabolic challenges including overfeeding21,26, we queried whether adipocyte-specific ablation of ESRRA is resistant to diet-induced obesity (DIO) or involved in fat-bone axis. Compared to Esrrαfl/fl NCD (normal chow diet) mice, Esrrαfl/fl DIO mice exhibited obese metabolic phenotypes including increased body weight, WAT mass and plasma levels of TG and FFA after a long-term HFD feeding for 16 weeks (Fig. 1a–d). Moreover, long-term HFD resulted in a significant increase in the circulating levels of inflammatory factors TNFa and IL6 in Esrrαfl/fl DIO mice, as well as dramatically augmented leptin level which is proportional to fat stores and considered a mature adipocyte marker (Fig. 1e). Compared to Esrrαfl/fl DIO mice, EsrraAKO DIO mice are similar in these metabolic cues and food intake, as well as glucose disposal rates upon an oral glucose tolerance test (Fig. 1b–d and Supplementary Fig. 2a–c). However, circulating lepin level was significantly reduced in EsrraAKO DIO mice while the levels of TNFa and IL6 remained unchanged compared to Esrrαfl/fl DIO mice (Fig. 1e). These evidences indicated that adipocyte ESRRA deficiency modulates leptin level without disturbing general metabolism in the context of HFD-induced obesity.
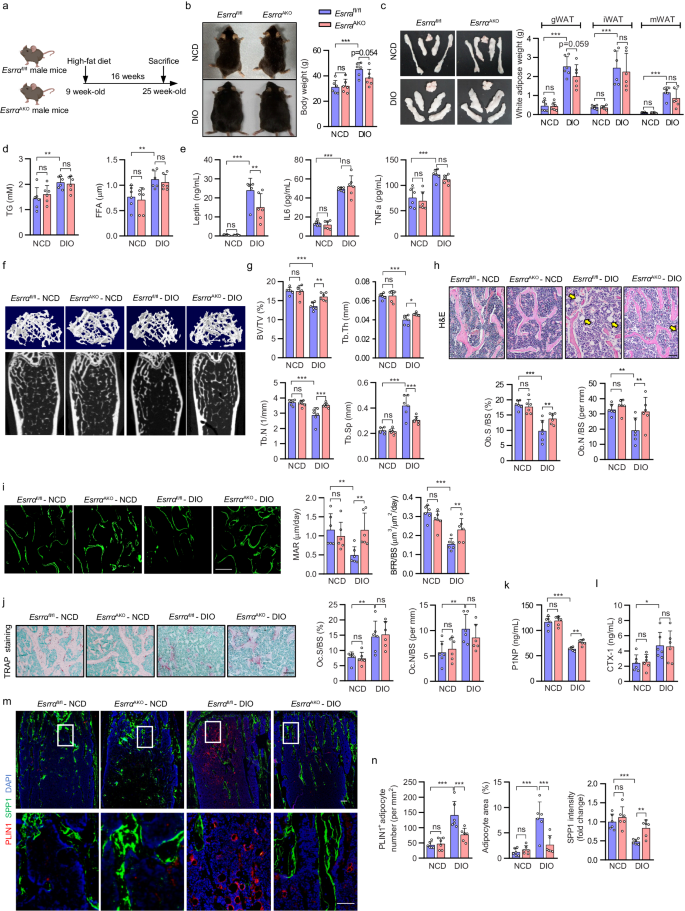
a Schematic diagram illustrating the experimental procedure for diet-induced obesity (DIO) mice model. 9-week-old Esrrafl/fl and EsrraAKO male mice were fed a normal chow diet (NCD) or high-fat diet (HFD) for 16 weeks. (Schematic created with BioRender.com. Agreement number: WP26KB8FER). b Representative pictures and body weights of NCD and DIO mice. c Representative images and weight analysis of white adipose tissue (WAT) depots, including gonadal WAT (gWAT), inguinal WAT (iWAT), and mesentery WAT (mWAT). d Plasma triglyceride (TG) and free fatty acid (FFA) levels. e Plasma leptin, IL-6 and TNFa levels. f Representative micro-CT images of the distal femoral trabecular bone. g Quantitative analysis of bone volume/tissue volume ratio (BV/TV), trabecular thickness (Tb. Th), trabecular number (Tb. N) and trabecular separation (Tb. Sp). h H&E staining of femur sections (scale bar: 100 μm). Yellow arrows indicate the bone marrow adipocytes. Osteoblast surface to bone surface ratio (Ob.S/BS) and osteoblast number to bone surface ratio (Ob.N/BS) are shown on the right panel. i Calcein double labeling of trabecular bone (scale bar: 50 μm). Mineral apposition rate (MAR) and bone formation rate (BFR/BS) were determined as graphs. j TRAP staining of femur sections with quantitative analysis of Oc.S/BS and Oc.N/BS. TRAP‐positive purple spots indicate multinucleated osteoclasts (scale bar: 100 μm). Plasma P1NP (k) and CTX1 (l) levels. m PLIN1 positive marrow adipocytes (PLIN1+, red) and SPP1 (green) immunofluorescence staining in femur sections (scale bar: 100 μm). The box in the upper showing the metaphysis region near growth plate is represented at higher magnification in the bottom (scale bar: 50 μm). n The number and area of adipocytes in the femur marrow per tissue area and the quantification of SPP1 fluorescence intensity were measured from femur sections in (m). Data are shown as mean ± SD (n = 6 mice per group). *p < 0.05, **p < 0.01 and ***p < 0.001. Statistical analysis is performed using two-way ANOVA with Fisher’s LSD post hoc analysis. Source data are provided as a Source Data file.
Notably, the trabecular bone mass in EsrraAKO DIO mice was greater than that of Esrrαfl/fl DIO mice which displayed osteopenia in comparison with NCD controls (Fig. 1f, g). EsrraAKO DIO mice had significant increases in BV/TV, Tb.N and Tb.Th; whereas Tb.Sp was reduced (Fig. 1g). In addition, EsrraAKO DIO mice had more osteoblasts (Ob.N/BS and Ob.S/BS), indicating an enhancement of bone formation confirmed by significant increases in trabecular mineral apposition rate (MAR) and bone formation rate (BFR/BS) using calcein double labeling (Fig. 1h, i). However, bone histomorphometry analysis of femoral metaphyses displayed no difference in bone resorption between the two DIO groups revealed by TRAP staining, quantification of osteoclast number (Oc.N/BS) and proportion of bone surface with active osteoclasts (Oc.S/BS) (Fig. 1j). We detected no changes in cortical bone including the midshaft cortical BV/TV and cortical bone thickness (Ct. Th) (Supplementary Fig. 2d, e). Consistently, plasma concentrations of P1NP were apparently elevated in EsrraAKO DIO mice but collagen type I c-telopeptide (CTX-1, a bone resorption marker) remained unchanged, suggestive of increased net bone formation in EsrraAKO DIO mice (Fig. 1k, l). As expected, HFD promoted MAT expansion substantially in Esrrαfl/fl DIO mice in comparison with NCD mice (Fig. 1m, n). However, histological examination in femur sections by immunofluorescence staining of perilipin 1 (PLIN1), an adipocyte marker, and SPP1, a bone matrix protein marker, revealed that loss of ESRRA dramatically restrained HFD-induce MAT expansion while promoting bone matrix formation (Fig. 1m, n). Collectively, these data demonstrated that adipocyte ESRRA ablation counteracts DIO-associated bone loss and high marrow adiposity by favoring bone formation.
Loss of Esrrα in adipocytes attenuates bone loss through favoring bone formation and inhibiting marrow adiposity in OVX-induced osteoporosis
There is a high coincidence rate of bone loss and excessive fat deposition including MAT expansion in postmenopausal women29,30. Similarly, estrogen deprivation also leads to fat-bone imbalance in rodents31. To investigate whether lack of Esrrα in adipocytes affects bone homeostasis under hormonal deficiency, ovariectomized (OVX) female mice were utilized to mimic estrogen deficiency-related osteoporosis. As expected, 18-wk-old female mice at 8 weeks after OVX gained body weight with excessive WAT deposition in Esrrαfl/fl controls (Fig. 2a–c and Supplementary Fig. 3a). However, there are no differences in body weight, WAT phenotype, blood lipids and glucose between the two genotypes in sham or OVX groups (Fig. 2b, c and Supplementary Fig. 3a–d). These evidences implied that adipocyte ESRRA abrogation did not alter WAT development upon estrogen deprivation. Similar to EsrraAKO DIO mice, the increase in circulating leptin induced by OVX was significantly reduced in EsrraAKO OVX mice despite no differences in peripheral WAT mass, suggesting a regulatory role of ESRRA on leptin expression (Fig. 2d).
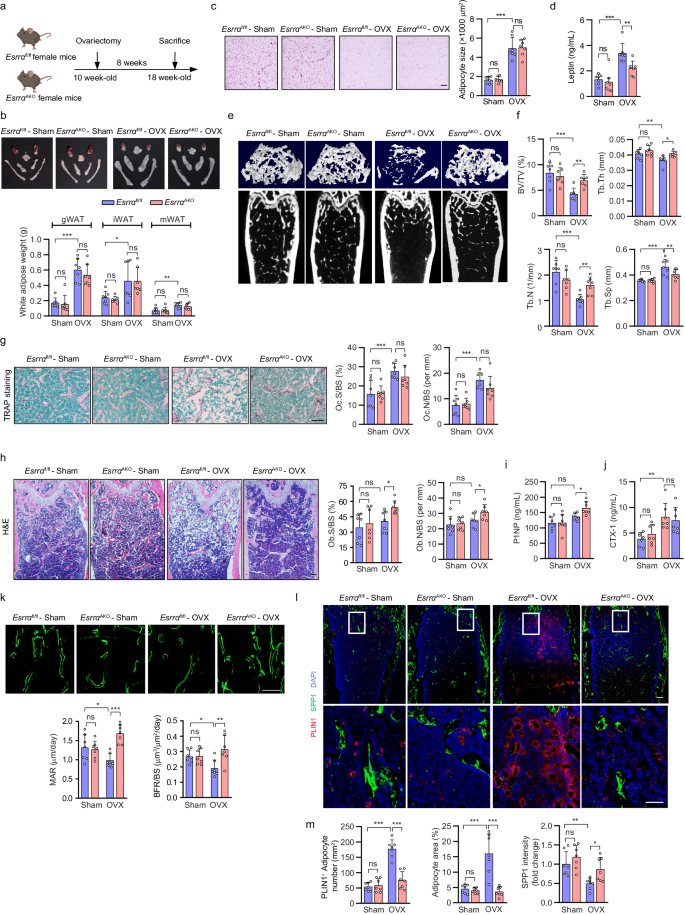
a Schematic diagram illustrating the experimental procedure for ovariectomy (OVX)-induced osteoporosis mice model. 10-week-old Esrrafl/fl and EsrraAKO female mice underwent either sham or OVX operation for 8 weeks (schematic created with BioRender.com. Agreement number: II26KB8K2T). b Representative images and weights of adipose depots. c Representative images and adipocytes size analysis from H&E-stained gWAT sections (scale bar: 50 μm). d Plasma leptin levels. Micro-CT images of distal femurs in sham and OVX mice (e) with morphometric analysis of BV/TV, Tb.N, Tb.Th, and Tb.Sp (f). g Representative TRAP-stained images and quantification of Oc.S/BS and Oc.N/BS in distal femoral metaphysis regions from sham and OVX mice (scale bar: 100 μm). h Representative H&E-stained images and quantification of Ob.S/BS and Ob.N/BS (scale bar: 100 μm). Plasma P1NP (i) and CTX1 (j) levels. k Calcein double labeling with quantitative analysis of MAR and BFR/BS (scale bar: 50 μm). l, m Immunofluorescence co-staining and quantification of PLIN1+ bone marrow adipocytes (red) and SPP1 (green) of femur sections from sham and OVX mice. Scale bar: upper panel, 100 μm; lower panel, 50 μm. Data are shown as mean ± SD (n = 7 mice per group). *p < 0.05, **p < 0.01 and ***p < 0.001. Statistical analysis is performed using two-way ANOVA with Fisher’s LSD post hoc analysis. Source data are provided as a Source Data file.
MicroCT analysis of the femur trabecular bone showed that the disruption in bone remodeling induced by OVX measured by BV/TV, Tb.N, Tb.Sp and Tb.Th was significantly ameliorated in EsrraAKO mice in comparison to Esrrαfl/fl controls (Fig. 2e, f). No differences in bone resorption and cortical bone parameters were found between EsrraAKO OVX mice and the corresponding controls (Fig. 2g and Supplementary Fig. 3e, f). However, osteoblast number and osteoblast surface were noticeably elevated in EsrraAKO OVX mice due to accelerated bone formation (Fig. 2h). Consistently, blood levels of P1NP and CTX-1 further confirmed the increased net bone formation in EsrraAKO mice following OVX (Fig. 2i, j) evidenced by increases in MAR and BFR (Fig. 2k). As expected, OVX significantly increased MAT accumulation accompanied with bone loss Esrrαfl/fl mice (Fig. 2h, l). Despite unchanged extramedullary WAT phenotype in EsrraAKO OVX mice, MAT expansion induced by estrogen deprivation was substantially eliminated in mutant OVX mice (Fig. 2b, h, l). EsrraAKO OVX mice displayed marked declines in the number and size of marrow adipocytes while having more osteoprogenitors around trabecular bone (Fig. 2h, l, m). These evidences reveal that adipocyte-specific ESRRA deficiency has a major impact on facilitating bone formation and inhibiting marrow adipogenesis under estrogen deficiency.
Adipocyte-specific ESRRA ablation leads to increased SPP1 expression
The fact that lack of ESRRA in adipocytes apparently reduces marrow adiposity in DIO and OVX mice drew our attention to BMAds. Given that BMAds originate from BMSCs present in the bone marrow, ESRRA expression was confirmed to be abrogated in EsrraAKO BMAds lineage cells at indicated days after adipogenic induction, but not during BMSCs osteogenesis. (Fig. 3a and Supplementary Fig. 4a). Then, isolated BMSCs from Esrrafl/fl and EsrraAKO mice were differentiated for 14 days in adipogenic or osteogenic induction medium, but no significant differences were observed (Fig. 3b, c). These data suggest that Adipoq-Cre-driven ablation of Esrra did not directly change the differentiation capability of BMSCs under normal physiological condition which is consistent with in vivo evidences. Treatment of rosiglitazone (Rosi) or pioglitazone can dramatically induce the expression of peroxisome proliferator activated receptor gamma (PPARG) target genes and exaggerate MAT accumulation in rodents or humans13,18,32. Therefore, we induced BMSCs differentiation by Rosi to mimic adipocyte expansion under pathological conditions and observed a reduction in adipogenesis of BMSCs from EsrraAKO mice (Fig. 3c). These evidences indicated that loss of ESRRA during adipocyte expansion under pathological conditions might exert a secondary or paracrine effect on heterogeneous BMSCs differentiation.
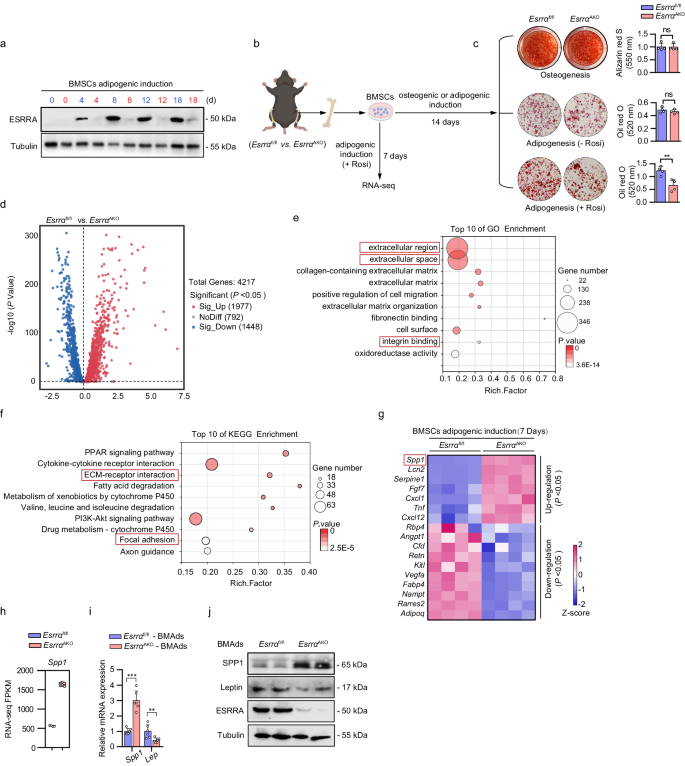
a Protein expression levels of ESRRA were evaluated in BMSCs upon adipogenic induction for indicated days, comparing Esrrafl/fl mice (blue font) with EsrraAKO mice (red font). b Schematic representation of the experimental design. BMSCs were isolated from Esrrafl/fl and EsrraAKO mice and subsequently subjected to either adipogenic or osteogenic induction for indicated days (schematic created with BioRender.com. Agreement number: LW26KBAHRA). c Representative images and quantitative analyses of alizarin red S staining and oil red O staining following the indicated induction. n = 4 biologically independent experiments. Rosi, rosiglitazone. d Volcano plot of transcriptional profiling between BMSCs-derived BMAds lineage cells from Esrrafl/fl and EsrraAKO mice. Differentially expressed genes were identified using DESeq2 analysis (p < 0.05). n = 4 biologically independent samples. Gene Ontology (GO) (e) and Kyoto Encyclopedia of Genes and Genomes (KEGG) (f) pathway enrichment analyses of all differentially expressed genes by RNA-seq (top 10 according to adjusted p value). g Heatmap depicting selected genes related to secreted factors (p < 0.05). n = 4 biologically independent samples. h Boxplot showing the transcript expression value (FPKM) of Spp1 based on RNA-seq data. Data are represented as box and whiskers with bars representing maximum and minimum values and with median highlighted as a line. n = 4 biologically independent samples. Validation of SPP1 and leptin expression were performed by qRT-PCR (i) and western blotting analysis (j) in BMAds that were fully differentiated for 14 days. n = 6 biologically independent samples. All the data are shown as mean ± SD. **p < 0.01 and ***p < 0.001. Statistical analysis is performed using unpaired two-tailed Student’s t test. Source data are provided as a Source Data file.
To explore the transcriptional role of ESRRA in regulating BMAds autonomous genes, bulk RNA-seq transcriptome analysis was performed in BMAds lineage cells at 7 days upon adipogenic induction (Fig. 3b). A total of 4217 genes were quantified, of which 1977 and 1448 were respectively up- and down-regulated in the ESRRA knockdown cells (Fig. 3d). As expected, the expression profile of genes associated with energy metabolism, including oxidative phosphorylation, tricarboxylic acid cycle, lipid metabolism and glycolysis were modestly affected (Supplementary Fig. 4b–e). By using Gene Ontology (GO) and Kyoto Encyclopedia of Genes and Genomes (KEGG) analysis, differentially expressed genes were found to be enriched in pathways related to extracellular environment and cellular response, indicating the involvement in cell signaling and interactions (Fig. 3e, f). Given that multiple secreted factors from BMAds are well-known functional regulators33, priority was given to 17 differentially expressed secreted factors (Fig. 3g). Notably, SPP1 was most robustly upregulated among the top-ranked secreted factors by ESRRA ablation (Fig. 3g, h and Supplementary Fig. 4f, g). SPP1 is a well-known matrix protein by binding to multiple integrins through a highly conserved arginine-glycine-aspartic acid (RGD) motif34 and involved in multiple pathways including the extracellular region, integrin binding, ECM-receptor interaction, and focal adhesion (Fig. 3e, f). Furthermore, qRT-PCR profiling and western blot analysis confirmed that SPP1 expression was indeed enhanced dramatically by ESRRA abrogation in fully differentiated BMAds (Fig. 3i, j). In contrast, the expression levels of leptin and other adipogenic marker genes such as Pparg, Cebpa and Fabp4 were down-regulated (Fig. 3i, j and Supplementary Fig. 4h). Taken together, these ex vivo data reveal that ESRRA ablation in BMAds led to altered expression of a panel of secreted factors, especially a significant augment of SPP1 expression.
Adipocyte ESRRA negatively regulates the transcription of Spp1 by interfering with E2/ESR1 signaling
We next sought to dissect the mechanism by which ESRRA negatively regulates SPP1 expression in adipocytes. Compared to sham, circulating SPP1 was significantly decreased in OVX mice but was partially rescued in EsrraAKO OVX mice (Fig. 4a). This ESRRA-mediated SPP1 production and secretion may not only arise from BMAds but also derive from peripheral WAT. We detected local SPP1 expression in gWAT with leptin as a WAT-adipocyte marker by using immunofluorescence double staining. The results showed that ESRRA knockdown increased SPP1 expression in gWAT adipocytes from OVX mice, concomitant with decreased leptin expression confirmed by qRT-PCR and western blot analysis (Fig. 4b–d). No changes were observed in other adipocyte-related genes including Adipoq, Pparg, Cebpa and Fabp4 (Fig. 4c). Furthermore, SPP1 expression were remarkably reduced in gWAT adipocytes of female mice 4 and 8 weeks after OVX, suggesting estrogen might be essential for adipocyte SPP1 expression (Fig. 4d and Supplementary Fig. 5a, b). These results clearly revealed that in addition to BMAds, WAT-adipocyte is also a source of SPP1. Importantly, a reduction in adipocyte SPP1 expression due to estrogen deficiency can be reversed by ESRRA ablation.
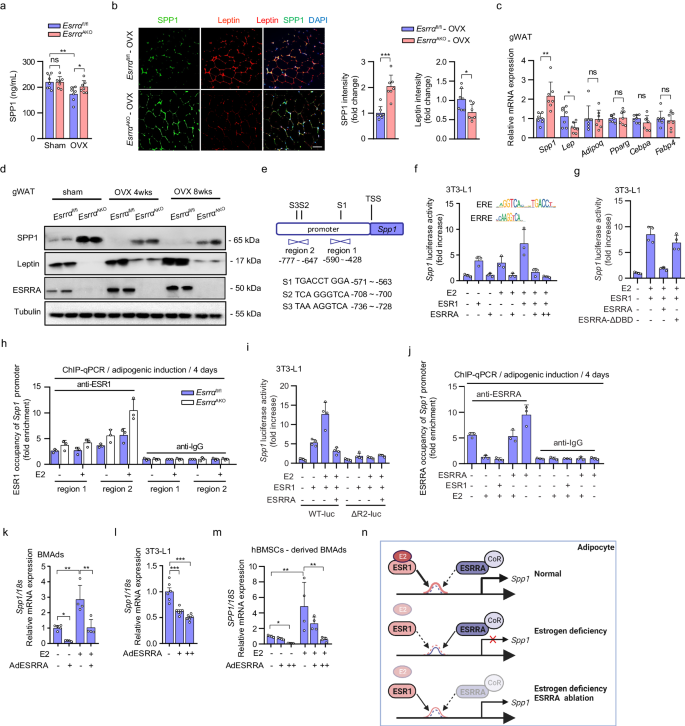
a Plasma SPP1 levels of Esrrafl/fl and EsrraAKO mice at 8 weeks post-OVX or sham operation. n = 7 mice per group. b Representative images and analysis of SPP1 and leptin co-staining of gWAT from OVX mice studied in (a) (scale bar: 100 μm). n = 7 mice per group. c mRNA expression of Spp1, Leptin, Adipoq, Pparg, Cebpa and Fabp4 of gWAT from OVX mice. n = 7 mice per group. d Protein levels of SPP1, leptin and ESRRA of gWAT from Esrrafl/fl and EsrraAKO mice at 4 and 8 weeks post-OVX or sham operation. e Schematic diagram displays the potential binding sites of ESR1 within the Spp1 promoter, including S1, S2 and S3. Fragments for ChIP assay shown as region 1 (R1) and region 2 (R2). f Luciferase reporter activities of the Spp1 promoter in adipogenesis induced 3T3-L1 cells transfected with Esrra or Esr1 expressing plasmids in the presence of E2 or not. n = 3 biologically independent experiments. The consensus sequence binding motifs for ESR1 response element (ERE) and ESRRA response element (ERRE) are presented. g Luciferase reporter activities of the Spp1 promoter regulated by E2/ESR1 in the presence of wild-type (WT) or DNA-binding domain-deleted ESRRA construct (ESRRA-ΔDBD). n = 4 biologically independent experiments. h ChIP assay with ESR1 antibody in BMSCs from Esrrafl/fl and EsrraAKO mice after adipogenic induction for 4 days along with or without E2. n = 3 biologically independent experiments. i Luciferase reporter activities of the R2 deleted-Spp1 promoter (ΔR2-luc) as compared to Spp1 promoter (WT-luc). n = 4 biologically independent experiments. j Enrichment of ESRRA in R2 of Spp1 promoter in adipogenesis induced 3T3-L1 cells with the indicated treatments. n = 3 biologically independent experiments. Spp1 mRNA in murine BMAds (k), matured 3T3-L1 adipocytes (l) or human BMSCs-derived BMAds (m) infected with adenovirus expressing ESRRA or GFP with E2 treatment for 2 days. n = 4, 6, 4 biologically independent experiments, respectively. n Diagram illustrating the mechanism of ESRRA-regulated repression of Spp1 transcriptional expression via interfering with E2/ESR1 signaling in adipocytes (schematic created with BioRender.com. Agreement number: BH26KF823M). Data are shown as mean ± SD. *p < 0.05, **p < 0.01 and ***p < 0.001. Statistical analysis is performed using unpaired two-tailed Student’s t test (c), one-way ANOVA followed by Bonferroni’s post hoc tests (k, l, m). Source data are provided as a Source Data file.
Although ESRRA does not bind 17β-estradiol (E2), ESRRA can modulate estrogen receptor alpha (ESR1)-mediated response of shared target genes in an E2 dependent way35. Spp1 promoter does not contain any canonical ESR1 response element (ERE) with an invert repeat of AGGTCA half-sites. Nonetheless, E2/ESR1 can regulate a single half-site preceded by a trinucleotide sequence TCA, which is also an ESRRA response element (ERRE)-like sequence36. Three such sites (S1–S3) can be found on the Spp1 promoter (Fig. 4e). We found that ESR1 induced Spp1 promoter activity, which was further enhanced by E2, in 3T3-L1 preadipocytes upon adipogenic differentiation for 2 days (Fig. 4f and Supplementary Fig. 5c). In contrast, ESRRA overexpression suppressed the E2/ESR1-driven Spp1 promoter activation in a dose-dependent manner, demonstrating a role of ESRRA in attenuating the E2/ESR1-dependent transcriptional activation (Fig. 4f). However, this attenuation was diminished by using a truncated ESRRA protein without its DNA-binding domain (DBD), confirming the repressive effect of ESRRA on Spp1 transcriptional activity is through binding to its promoter (Fig. 4g). To further evaluate this interference, we next determined whether ESRRA knockdown would result in an induction of E2/ESR1 transactivation on the Spp1 promoter. By chromatin immunoprecipitation (ChIP) assay, ESRRA abrogation led to enhanced recruitment of ESR1 to the Spp1 promoter, especially region 2 which was more responsive to E2 stimulation (Fig. 4h). To validate whether region 2 is responsible for the transcriptional regulation, we constructed a truncated Spp1 promoter without region 2 and found that it was no longer responsive to E2/ESR1 transactivation and ESRRA-mediated repression effect (Fig. 4i). Moreover, the directly interruption effect of ESRRA on E2/ESR1 modulation was further confirmed by ChIP assay, evidenced by increased occupancy of ESRRA to the Spp1 promoter upon ESRRA overexpression while decreased enrichment by ESR1 or E2 treatment (Fig. 4j). Consistently, mRNA expression of Spp1 was induced by E2 but suppressed by an adenovirus expressing ESRRA in fully differentiated BMAds (Fig. 4k and Supplementary Fig. 5d). Similar evidences were recaptured in 3T3-L1 mature adipocytes as well as human BMSCs-derived BMAds (Fig. 4l, m and Supplementary Fig. 5e, f). Collectively, our data demonstrated that ESRRA negatively modulates SPP1 expression through interfering with E2/ESR1 signaling in adipocytes (Fig. 4n).
Adipocyte ESRRA ablation results in an increase in SPP1 secretion facilitating type H vessel formation in osteoporotic mice
SPP1 is well known to exert a proangiogenic effect mediating neovascularization in the early stage of bone healing37,38. Notably, global knockout of SPP1 causes a reduction in type H vessels in mice long bone39. Therefore, it is possible that soluble form of SPP1 released from adipocytes might contribute to type H vessel formation. We performed CD31 and Endomucin (EMCN) double immunofluorescence staining in the metaphysis of distal femur to verify type H blood vessel formation. Consistent with previous studies14,40, OVX caused a significant reduction of type H blood vessels and adjacent Osterix+ osteoprogenitor cells in Esrrαfl/fl mice compared to sham (Fig. 5a–d). In contrast, the abundance of type H vessels and osteoprogenitors were markedly preserved in EsrraAKO mice following OVX (Fig. 5a–d). As a characteristic feature of metaphyseal type H vessels, the organization and length of columnar vessels exhibited pronounced improvement in mutant mice (Fig. 5a, b). Similarly, Esrrαfl/fl DIO mice exhibited apparently distorted type H vessels; however, this distortion was minimal in EsrraAKO DIO mice associated with an increase of osteoprogenitor cells (Supplementary Fig. 6a–d). These results suggest that adipocyte ESRRA ablation rescues deteriorated type H vessels under pathological osteoporotic conditions while promoting perivascular osteoprogenitors accretion.
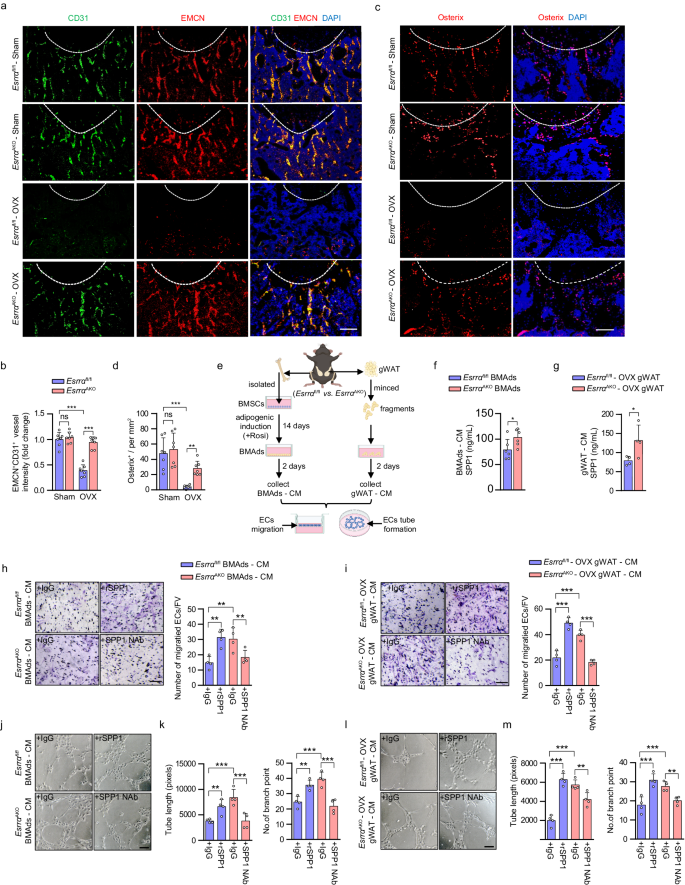
a Representative images of metaphyseal type H vessels near growth plate immunostained for Endomucin (EMCN, red) and CD31 (green) in distal femurs of Esrrafl/fl and EsrraAKO mice following sham and OVX. DAPI (blue) is used for counterstaining of nuclei (scale bar: 100 μm). b Quantification of CD31+ EMCN+ type H vessel intensity per mm2. n = 7 mice per group. c Immunostaining of Osterix (red) with DAPI (blue) in the metaphysis of distal femurs of Esrrafl/fl and EsrraAKO mice following sham and OVX (scale bar: 50 μm). d Quantification of Osterix+ cells in bone marrow per mm2. n = 7 mice per group. e Schematic diagram showing the procedure of the conditioned medium (CM) preparation, tube formation assay and cell migration assay (schematic created with BioRender.com. Agreement number: VY26KB8O73). The concentrations of soluble SPP1 in BMAds-CM (f) or gWAT-CM (g) prepared from Esrrafl/fl and EsrraAKO OVX mice were measured by ELISA. n = 6, 4 biologically independent samples, respectively. Microvascular endothelial cells (ECs) migration in response to BMAds-CM (h) or gWAT-CM (i) with the addition of 0.5 μg/ml recombinant SPP1 (rSPP1), 1 μg/ml neutralizing SPP1 antibody (SPP1 Nab), or an equal volume of IgG for 24 h was followed by quantification and presentation of representative images from four independent experiments (scale bars: 100 μm). n = 4 biologically independent experiments. j–m Matrigel tube formation assay was performed using ECs and BMAds-CM (j) or gWAT-CM (l) with the indicated treatments for 4 h (scale bar: 100 μm). The length of the tubes and the number of branch points (k, m) per field were analyzed. n = 4 biologically independent experiments. Data are shown as mean ± SD. *p < 0.05, **p < 0.01 and ***p < 0.001. Statistical analysis is performed using unpaired two-tailed Student’s t test (f, g) and two-way ANOVA with Fisher’s LSD post hoc analysis (b, d, h, i, k, m). Source data are provided as a Source Data file.
As a negatively charged non-collagenous matrix glycoprotein, soluble SPP1 has a high affinity for calcium allowing it to anchor in bone environment41. To determine whether BMAd- or WAT-derived soluble SPP1 contributed to the formation of type H blood vessels, we collected conditioned medium (CM) from both sources and performed co-culture assays to evaluate the efficacy of secreted SPP1 in inducting angiogenesis of microvascular endothelial cells (ECs) (Fig. 5e). We first detected the concentrations of SPP1 from CM and confirmed that adipocyte ESRRA abrogation enhanced SPP1 secretion (Fig. 5f, g). Transwell migration assay revealed that ECs cultured in either BMAds CM or gWAT CM from EsrraAKO mice displayed an enhanced ability to migrate relative to Esrrαfl/fl controls (Fig. 5h, i). Additionally, Matrigel tube formation assay confirmed that CM from both sources of mutant mice promoted the formation of capillary-like network structures (Fig. 5j–m). Importantly, recombinant SPP1 (rSPP1) rescued ECs migration and tube formation in two Esrrαfl/fl CM groups (Fig. 5h–m). On the contrary, addition of anti-SPP1 neutralizing antibody (SPP1 NAb) in two EsrraAKO CM groups hampered the angiogenic processes (Fig. 5h–m). These data indicated that soluble SPP1 released by both sources of ESRRA-deficient adipocytes was responsible for ECs migration and vascular formation. Taken together, our findings illustrated a potent protective effect of adipocyte ESRRA ablation on bone angiogenesis in OVX and DIO mice through elevated soluble SPP1 production. It is thus plausible that enhanced bone formation in EsrraAKO mice is in part facilitated by the sustained bone marrow vascularization, especially under osteoporotic condition induced by estrogen derivation or overfeeding.
Adipocyte ESRRA positively regulates transcriptional expression of Leptin by binding to the Leptin promoter
Compared to DIO or OVX controls, ESRRA deficient mice displayed declined levels of circulating leptin despite no differences in peripheral WAT mass, as well as repressed expression in both WAT- adipocytes and BMAds (Figs. 1e, 2d, 3j, 4b–d and Supplementary Fig. 7), suggesting that Lep may be a target gene of ESRRA. Thus, we evaluated whether ESRRA may directly regulate the expression of Lep by binding to four putative ERREs S1–S4 on the promoter (Fig. 6a). We first established that this wild-type Lep promoter is sufficient to confer, in a dose-dependent manner, responsiveness to ESRRA and its co-activator PPARGC1A (Fig. 6b). Moreover, the regulation on Lep promoter was dose-dependently suppressed by a well-studied ESRRA specific antagonist Compound 29 (C29) (Fig. 6c). Importantly, deletion and mutation analysis of these putative ERREs revealed that S1 and S3 ERREs were primarily responsible for the ESRRA-driven Lep expression (Fig. 6d). We next investigated if ESRRA is physically bound to these ERREs by ChIP assays using primers encompassing regions 1–3 (Fig. 6a). 3T3-L1 underwent adipogenic differentiation for 4 days to induce endogenous ESRRA and leptin expression. ChIP-qPCR analysis confirmed the binding of endogenous ESRRA to regions 1 and 2 that contains S1 and S3 respectively; however, C29 reduced said ESRRA occupancy (Fig. 6e). Furthermore, augmented ESRRA occupancy was measured in regions 1 and 2 in 3T3-L1 overexpressing ESRRA (Fig. 6f). In line with these observations, leptin expression was increased in a dose-dependent manner by an adenovirus overexpressing ESRRA in matured 3T3-L1 adipocyte as well as in BMAds differentiated from murine or human BMSCs (Fig. 6g–i). In summary, our data strongly established that Lep is a bona fide ESRRA target gene in adipocytes.
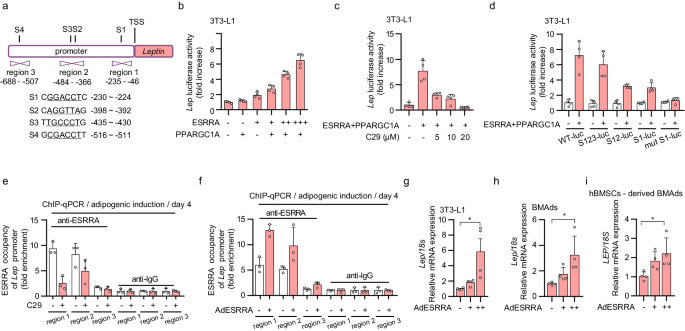
a Schematic diagram illustrating the putative binding sites of the ERRE on the mouse Leptin promoter, with four ERREs sequences highlighted by underlined nucleotides (S1, S2, S3 and S4). Positions of qRT-PCR primers on the Leptin promoter used in ChIP are shown as region 1, region 2 and region 3. b Luciferase reporter activities of the Leptin promoter in 3T3-L1 transiently transfected with Esrra, Ppargc1a or control plasmid. n = 4 biologically independent experiments. c Effects of compound 29 (C29) on ESRRA and PPARGC1A in the regulation of the Leptin promoter by using luciferase reporter assays. 3T3-L1 cells were transfected with Esrra and Ppargc1a expressing plasmids and treated with the indicated doses of C29 for 24 h. n = 4 biologically independent experiments. d Effects of ESRRA on different constructs of Leptin promoter activities were tested in 3T3-L1 cells transfected with WT-luc, S123-luc, S12-luc, S1-luc, or mut S1-luc. n = 4 biologically independent experiments. ChIP assay with ESRRA antibody or IgG in 3T3-L1 cells after adipogenic induction for 4 days along with treatment of 10 μM C29 or DMSO (e), or with an infection of adenovirus expressing ESRRA or control GFP (f). n = 3 biologically independent experiments. The mRNA levels of Leptin in matured 3T3-L1 adipocytes (g), murine BMAds (h) and human BMSCs-derived BMAds (i). After 14 days of adipogenic induction, matured adipocytes were infected with adenovirus expressing ESRRA or control GFP for another 2 days. n = 4 biologically independent experiments. All data in this figure are represented as mean ± SD. *p < 0.05. Statistical analysis is performed using one-way ANOVA followed by Bonferroni’s post hoc tests (g–i). Source data are provided as a Source Data file.
ESRRA ablation drives a reduction of leptin and an increase of SPP1 released from adipocytes synergistically directing BMSCs lineage commitment
Leptin released from adipocytes acts on LepR+ BMSCs dictating fate commitment toward adipogenesis3,7. On the other hand, SPP1 directs osteogenic differentiation of BMSCs mainly in an extracellular manner via binding to integrin β134. Altered BMSCs lineage commitment maybe behind the reduced BMAds and enhanced bone formation seen in EsrraAKO mice. To assess the effects of secreted factors from distinct adipocytes on MSCs fate determination, we first collected CM from either BMAds or minced gWAT depots isolated from Esrrαfl/fl and EsrraAKO OVX mice (Fig. 7a). BMSCs from wild-type adult mice were then cultured in CM supplemented with osteogenic/adipogenic mixed induction medium as reported42 (Fig. 7a). The concentration of leptin was dramatically lower in the gWAT-derived CM from EsrraAKO OVX mice (Fig. 7b); whereas, SPP1 level was higher (Fig. 5g). In wild-type BMSCs treated with said gWAT-CM, mRNA levels of well-established osteogenic markers, Runx2, Sp7 and Bglap were significantly up-regulated, revealing a shift toward committed osteoblast progenitors (Fig. 7c). On the contrary, adipogenic markers Pparg, Cebpa and Fabp4 expression were significantly down-regulated, indicating a reduction in adipogenic differentiation (Fig. 7c). As expected, BMSCs treated with gWAT-CM from EsrraAKO OVX mice exhibited a profound increase in osteogenic capability in contrast to a significant decrease in adipogenic potential (Fig. 7d, e). Compared to IgG control, when induction medium containing gWAT-CM from Esrrαfl/fl OVX mice was supplemented with Allo-aca, a specific leptin receptor antagonist peptide that blocks leptin/LepR signaling, BMSCs preferentially differentiated into osteoblasts at the expense of adipocytes differentiation (Fig. 7d, e). Additionally, rSPP1 facilitated osteogenesis and inhibited adipogenesis, which was even more profound in combination with Allo-aca, demonstrating their concerted effects (Fig. 7d, e). Conversely, when recombinant leptin (rLeptin) or SPP1 NAb was added to gWAT-CM from EsrraAKO OVX mice, osteogenic differentiation of BMSCs was reduced; whereas, adipogenic differentiation was enhanced (Fig. 7d, e). Similar results were obtained using BMAds-CM, suggesting the presence of a paracrine effect of BMAds on surrounding BMSCs (Fig. 7f–i). Collectively, these results delineated that the loss of ESRRA in adipocytes alters the production and secretion of leptin and SPP1, acting on BMSCs through either a paracrine or endocrine manner, promoting osteogenic differentiation at the expense of adipogenic differentiation; thereby, shifting the lineage commitment of BMSCs.
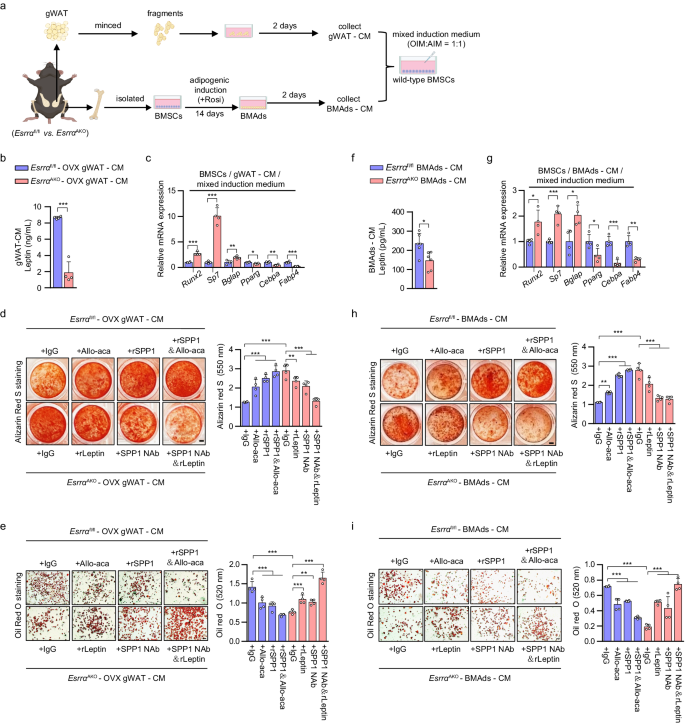
a Schematic diagram showing the procedure of the conditioned medium (CM) preparation from cultured BMAds or minced gWAT; and wild-type BMSCs were differentiated in osteogenic/adipogenic mixed induction medium (OIM:AIM = 1:1) supplemented with the indicated CM (schematic created with BioRender.com. Agreement number: ZP26KB8SN4). b The concentrations of soluble leptin in gWAT-CM prepared from Esrrafl/fl and EsrraAKO OVX mice were measured by ELISA. n = 4 biologically independent samples. c mRNA levels of osteogenesis markers Runx2, Sp7, Bglap, as well as adipogenic markers Pparg, Cebpa, Fabp4 in wild-type BMSCs cultured with mixed induction medium and indicated gWAT-CM for 14 days. n = 4 biologically independent experiments. Representative images and quantification of alizarin red S staining (d) and oil red O staining (e) of BMSCs cultured as in (c) with an addition of gWAT-CM for 14 days, in the presence of rSPP1, SPP1 Nab, recombinant leptin (rLeptin), leptin receptor antagonist Allo-aca or IgG as indicated. n = 4 biologically independent experiments. Scale bar: 2 mm (d); scale bar: 100 μm (e). f The concentrations of soluble leptin in BMAds-CM as prepared from (a). n = 6 biologically independent samples. g mRNA levels of indicated genes in wild-type BMSCs cultured in mixed induction medium supplemented with the indicated BMAds-CM for 14 days. n = 6 biologically independent experiments. Representative images and quantification of alizarin red S staining (h) and oil red O staining (i) of BMSCs cultured as in (g) with the indicated treatments for 14 days. The experiments were conducted according to the procedure shown in (a–e). n = 4 biologically independent experiments. Scale bar: 2 mm (h); scale bar: 100 μm (i). Data are shown as mean ± SD. *p < 0.05, **p < 0.01 and ***p < 0.001. Statistical analysis is performed using unpaired two-tailed Student’s t test (b, c, f, g) and two-way ANOVA with Fisher’s LSD post hoc analysis (d, h, e, i). Source data are provided as a Source Data file.
Pharmacological ESRRA inhibition protects bone loss and impedes MAT expansion in DIO mice
Next, we employed a specific ESRRA antagonist C29 to assess the pharmacological effect of ESRRA inhibition on adipocytes (Fig. 8a). In mature 3T3-L1 adipocytes, C29 dose-dependently suppressed leptin but induced SPP1 expression while preserving adipogenesis shown by Oil Red O staining (Fig. 8b, c). Moreover, we recaptured similar results in C29-treated BMAds differentiated from murine or human BMSCs; namely, C29 dose-dependently altered leptin and SPP1 production in an opposite manner (Fig. 8d, e and Supplementary Fig. 8a–e). These evidences confirmed the expression of leptin and SPP1 was dictated by ESRRA but not fate switching. These data proved that in vitro C29 treatment can efficiently inhibit ESRRA activity in adipocytes, raising the prospect of achieving augmented therapeutic efficacy by simultaneously targeting SPP1 and leptin pathways.
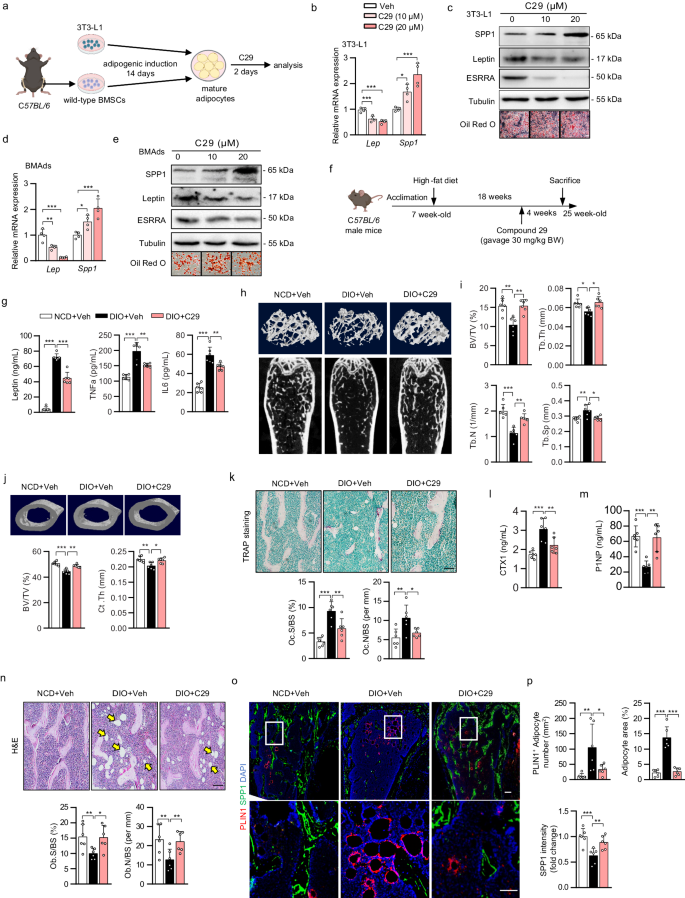
a Experimental design. Wild-type BMSCs were isolated from C57BL/6 mice and differentiated into BMAds, and 3T3-L1 preadipocytes were cultured in adipogenic medium for 14 days. Mature adipocytes were subsequently treated with C29 for an additional 2 days (schematic created with BioRender.com. Agreement number: IH26KB8VKA). The mRNA and protein levels of leptin and SPP1 in mature 3T3-L1 adipocytes (b, c) or BMAds (d, e). In vitro experiments were repeated four times. f Schematic diagram showing the experimental design for pharmacological treatments in DIO mice. Seven-week-old C57BL/6 mice were fed either a NCD or HFD for 18 weeks, and received either vehicle or C29 (30 mg/kg/body weight) every day during the last 4 weeks (schematic created with BioRender.com. Agreement number: WH26KBA0SE). g Plasma leptin, TNFa and IL6 levels. h, i Representative micro-CT images and histomorphometry analysis of BV/TV, Tb.N, Tb.Th and Tb.Sp at the distal femurs. j Representative micro-CT images of middle-segment of cortical bone and histomorphometry analysis of cortical bone volume/tissue volume ratio (BV/TV) and cortical thickness (Ct.Th). k Representative images of TRAP-stained femoral sections (scale bar: 100 μm). Quantitative assessment of trabecular Oc.S/BS and Oc.N/BS based on TRAP-stained sections. Plasma CTX-1 (l) and P1NP (m) levels. n Representative images of H&E-stained femur sections (scale bar: 100 μm). Quantitative assessment of trabecular Ob.S/BS and Ob.N/BS based on H&E-stained sections. o Representative PLIN1 and SPP1 immunostaining in femoral sections. Scale bar: upper panel, 100 μm; lower panel, 50 μm. p Quantification of PLIN1+ adipocyte number and of SPP1 fluorescence intensity. Six mice per group were used in all animal experiments. Data are shown as mean ± SD. *p < 0.05, **p < 0.01 and ***p < 0.001. Statistical analysis is performed using one-way ANOVA followed by Bonferroni’s post hoc tests (b–d) and two-way ANOVA with Fisher’s LSD post hoc analysis (g, i–n, p). Source data are provided as a Source Data file.
To further assess the pharmacological effects of C29 in vivo, we treated DIO male mice with C29 or vehicle for 4 weeks (Fig. 8f). Consistent with our previous report23, C29 did not alter body weight and visceral fat mass. In comparison to NCD vehicle mice, circulating levels of Lepin, TNFa and IL6 were dramatically enhanced in DIO vehicle mice which were significantly reduced by oral gavage of C29, indicating repressed systemic inflammation due to reduced ESRRA activity (Fig. 8g). Of note, DIO mice had significant bone loss evident from μCT analysis and quantitative bone parameters which was rescued by C29 (Fig. 8h, i). Consistent with a recent study27, HFD decreased cortical thickness by 7% and BV/TV by 10% both were restored by C29 (Fig. 8j). This protective effect may be in part due to decreased bone resorption shown by a reduction of TRAP staining and blood CTX-1 concentration (Fig. 8k, l). This result is also consistent with ours and other previous reports that pharmacological inhibition of ESRRA directly blocks osteoclastogenesis and bone resorption43. Moreover, SPP1 immunofluorescence staining and plasma P1NP level revealed more osteoblasts and bone formation in C29-treated than vehicle DIO mice (Fig. 8m, n). Remarkably, BMAT expansion in response to HFD was diminished by C29 (Fig. 8o, p). These findings illustrate a potential therapeutic option by inhibiting ESRRA function in adipocytes for treating osteopenia associated with high marrow adiposity.
- SEO Powered Content & PR Distribution. Get Amplified Today.
- PlatoData.Network Vertical Generative Ai. Empower Yourself. Access Here.
- PlatoAiStream. Web3 Intelligence. Knowledge Amplified. Access Here.
- PlatoESG. Carbon, CleanTech, Energy, Environment, Solar, Waste Management. Access Here.
- PlatoHealth. Biotech and Clinical Trials Intelligence. Access Here.
- Source: https://www.nature.com/articles/s41467-024-48255-8