Cell culture
The immortalized human fetal osteoblast cell line hFOB1.19 (hFOB1.19) was purchased (ATCC® CRL-11372™). It was cultured according to the protocol specified by the repository and regularly tested for mycoplasma contamination. hFOB1.19 cells were maintained in growth medium (GM): DMEM:Ham’s F12 (Sigma, D6421) supplemented with 10% fetal bovine serum (FBS), 2.5 mM L-glutamine, 100 U/mL penicillin and 100 μg/mL streptomycin, 300 µg/ml G418 (Sigma, G8168). All the experiments were carried out at 34 °C and 5% CO2. Two monoclonal hFOB1.19 cell lines expressing enhanced green fluorescent protein (eGFP) under the control of the i) human full-length osteocalcin promoter (hFOB hOC_eGFP) and ii) the human ubiquitinase (UbC) promoter (hFOB_eGFP) were generated previously by lentivirus transduction15. Cultivation was conducted at 34 °C in growth media. Osteogenesis was triggered in spheroids by incubating the cells at 34 °C in osteogenic medium (OM): DMEM:Ham’s F12 mixture containing 2% FBS, 500 µM ascorbic acid and 10 nM dexamethasone (Sigma, D4902). For adipogenic differentiation, the cells were incubated in adipogenic medium (AM) supplemented with 0.5 mM isobutyl‐methylxanthine (Sigma, I5879), 1 μM dexamethasone, 10 μM insulin (Sigma, l9278), and 60 μM indomethacin (Sigma, I7378). Spheroids were formed by incubating 103 cells in ultralow attachment U-bottom 96-well plates (Greiner)46. Further cultivation was carried out in 96-well-plates at 34 °C and 5% CO2, with medium changes performed every second day. eGFP fluorescence was quantified by summing all pixel values in the region of interest (raw integrated density) by means of image analysis (ImageJ, Fiji open source) at 3 and 6 days post-aggregation. eGFP signals related to growth and osteo- and adipogenic media were normalized to the area, and differences were statistically evaluated via unpaired t tests.
THP-1 cells were purchased (ACC16; DMSZ Leibniz-Institut-Deutsche Sammlung für Mikroorganismen und Zellkulturen GmbH). They were expanded in RPMI 1640 medium supplemented with 5% FBS, 100 U/mL penicillin and 100 μg/mL streptomycin. Human mesenchymal stem cells-hMSCs (Cambrex, East Rutherford, NJ) were expanded in α-MEM supplemented with 20% FBS, 100 U/mL penicillin and 100 μg/mL streptomycin. Both THP1 cells and hMSCs were cultivated as monocultures at 37 °C. For all co-culture experiments, complete DMEM:Ham’s F12 growth medium was used.
Immune and histochemical staining
The spheroids were fixed in 4% paraformaldehyde in PBS for 30 min and permeabilized with 0.3% Triton-X-100 solution in PBS for 15 min at room temperature. To prevent nonspecific antibody binding, the specimens were incubated for 1 h at room temperature in blocking solution (0.2% Triton X-100, 0.05% Tween-20, 3% bovine serum albumin in PBS) with gentle shaking. After blocking, the spheroids were incubated with primary antibodies overnight (ON) at 37 °C with gentle shaking. The primary antibodies used were as follows: anti-human BGLAP (ABclonal #A6205, Lot 1152580201; anti-human DMP1 #A16832, Lot 5500009628). The antibodies were diluted 1:100 in antibody buffer (1% bovine serum albumin, 0.2% Triton X-100, 0.05% Tween-20 in PBS). After washing, the samples were stained with the corresponding secondary antibody and nuclear dyes (Hoechst 33342, Sigma #14533) for 4 h at 37 °C with gentle shaking. The secondary antibodies used were as follows: anti-rabbit AlexaFluor 555 (Cell Signaling #4413, Lot 10) and anti-mouse AlexaFluor 555 (Cell Signaling #4409, Lot 11). The secondary antibodies were diluted 1:800 in antibody buffer together with Hoechst 33342 (10 µg/ml). After washing, the spheroids were cleared with glycerol as previously described47.
Calcium deposition was detected using Xylenol Orange (XO), Calcein blue and Von Kossa. Outgrown cultures were first stained with the fluorescence dye Calcein blue according to Yu-Hsiung Wang and colleagues11. After image acquisition, cultures were fixed with 4% paraformaldehyde for 30 min, and susequently stained with 5% Silver Nitrate solution. After 60 min exposure to ultraviolet light, cultures were rinsed in distilled water, incubated with 2.5% Sodium Thiosulphate for 5 min and washed in distilled water.
Calcium staining of living cells was carried out by incubating specimens overnight with 20 µM XO (Fluka, #33825). After extensive washing, the samples were resuspended in phenol red-free medium.
Hoechst 33342 (10 µg/ml) and propidium iodide (1 µg/ml) were applied to the growth media for 45 min at 37 °C. After staining, the spheroids were washed with PBS to remove residual dye and transferred to phenol-free medium.
Deconvolution microscopy
Image stacks from the central region of the spheroids were acquired by means of widefield microscopy (Leica DMi8 controlled by LAS X software 3.4.2, Leica Microsystems). Image deconvolution was performed using Huygens Essential Software (Scientific Volume Imaging, Hilversum, The Netherlands). Image stacks of 30–40 µm in the center of the micromass were acquired by automatically optimized spacing. Only images with a Nyquist number ≥ 0.9 were used for further analysis. Deconvolution was performed by applying the following settings: (i) automatically calculated point-of-spread-function (PSF), (ii) logarithmic function for the image intensity histogram, and (iii) classical maximum likelihood estimation (CMLE) as a deconvolution algorithm. Additional parameters were calculated from the imaging conditions according to the software instructions (Table 1).
Histology
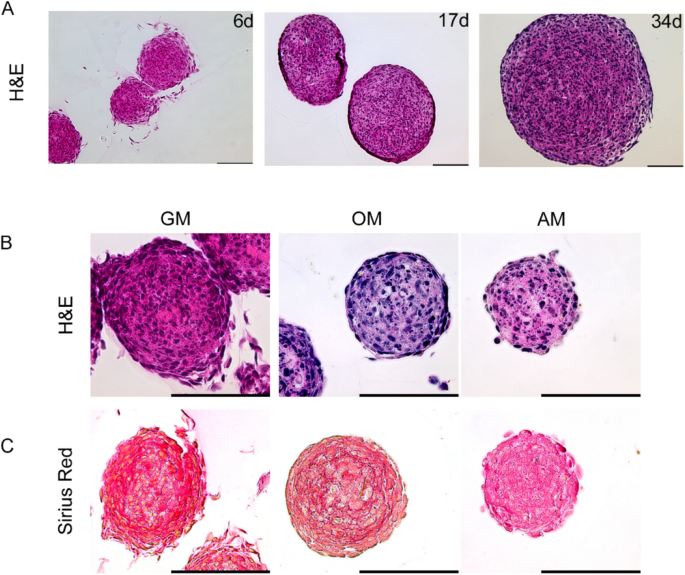
The process of spheroid collection, paraffin embedding, and staining was performed according to the methods of Clayton et al.48 The aggregates were transferred to a 15 ml tube and centrifuged at 300×g for 2 min. The supernatant was discarded, and the sedimented spheroids were washed twice with PBS and then fixed with 10% neutral-buffered formalin for 10 min at room temperature. The fixative was removed and replaced with PBS by washing the pellet twice. Specimens were decalcified by applying decalcifier soft solution (Roth, #6484.1) according to the manufacturer’s recommendations. Thereafter, the samples were rinsed three times in PBS and transferred to a small tube. Then, 1% agarose solution (Agarose Type I-A Low EEO, Sigma, A-0169) was added, followed by centrifugation and casting for 1 h at room temperature. The spheroid pellet was then gently removed and wrapped in Bio-Wrap (Surgipath Bio-Wrap, VWR #720-2430) before being transferred into an embedding cassette. Ethanol infiltration started with 70% and 80% ethanol for 10 min, followed by 95% ethanol for 15 min, three changes of 100% ethanol for 10 min, and three changes of xylene for 10 min. Samples were transferred into paraffin for 1 h with two changes of fresh paraffin for 15 min each. Sections were cut at 5 µm, mounted onto a hydrophilic glass slide (Superfrost Ultra Plus, Menzel #1014356190) and stained with hematoxylin and eosin (H&E, Thermo Scientific #411160250). When preparing for fluorescence immunohistochemistry, sections were first incubated in preheated citrate buffer (10 mM, 0.05% Tween, pH 6) at 90 °C. The slides were cooled to RT in citrate buffer for 15 min, rinsed with TBS-Tween (0.05% Tween), permeabilized in 1% BSA and 0.4% Triton X-100 in PBS for 20 min and incubated with blocking solution containing 3% BSA, 0.2% Tween-20 and 0.2% Triton X-100 in PBS for 1 h at RT. The blocking solution was removed, and the sections were incubated with anti-Lamin A/C (Santa Cruz Biotechnology, sc-376248, Lot H2719), mouse IgG isotypes (BioLegend #400101, Clone: MOPC-21, Lot B142616), or 1 × PBS as a negative control at 4 °C overnight in a humidified chamber, followed by incubation with secondary antibodies (anti-mouse AlexaFluor 555, 1:500) for 1 h at RT. Sections were washed and counterstained with 0.2 µg/ml DAPI (Sigma, # D9542).
Apoptosis analysis
The spheroids were fixed with 4% paraformaldehyde for 30 min and decalcified with CUBIC-B according to the manufacturer’s recommendation (TCI, #T3780). After permeabilization with 0.3% Triton-X100 in 0.1% sodium citrate (pH 6) for 30 min, the spheroids were incubated for 1 h in blocking solution (3% bovine serum albumin in PBS). TUNEL staining was carried out according to the manufacturer’s instructions (In Situ Cell Death Reaction Kit, Roche, #1684817), with the sole exception that the incubation was performed overnight at room temperature. Hoechst 33342 (10 µg/ml) was used as a nuclear counterstain.
To inhibit apoptosis, the aggregates were cultured in GM supplemented with 50 µM pancaspase inhibitor (Z-VAD-FMK, Targetmol Cat# T6013). Five days posttreatment, the spheres were stained with propidium iodide (PI) or Xylenol Orange, and the nuclei were counterstained with Hoechst 33342.
Quantitative PCR
Total RNA was isolated from 100 spheroids with a Direct-zol RNA MicroPrep Kit (Zymo Research, R2050), subjected to DNAse treatment, quantified with a NanoDrop 1000 spectrophotometer (Thermo Fisher Scientific) and stored at − 80 °C. Complementary DNA (cDNA) was synthesized from 100 ng of total RNA using the LunaScript® RT SuperMix Kit (New England Biolabs, E3010L). Only RNA samples with an A260/A280 ratio ≥ 1.9 were used, and reverse transcription was carried out in duplicate. Quantitative PCR was performed on an AriaMX Real-Time PCR System (Agilent) with Luna Universal qPCR Master Mix (New England Biolabs, M3003L; SYBR channel) using 2 µl of prior diluted cDNA (1:5). Non-template controls (NTCs) were included on each plate. To determine primer specificity, melting curves were generated after 40 cycles of PCR. The fold difference in gene expression was calculated using the ΔΔCt method, and normalization was performed according to the expression of the reference gene YWHAZ. The primers used spanned exon junctions to avoid genomic DNA amplification; the sequences are given in Table 2. Statistical significance was evaluated by a two-tailed unpaired Student’s t test for at least three experiments performed in triplicate.
Statistical analysis
The data are shown as the mean ± s.d.; n is indicated in the figure legends. Statistical analyses were performed using an unpaired two-tailed Student’s t test. A P value of less than 0.05 was considered to indicate statistical significance.
- SEO Powered Content & PR Distribution. Get Amplified Today.
- PlatoData.Network Vertical Generative Ai. Empower Yourself. Access Here.
- PlatoAiStream. Web3 Intelligence. Knowledge Amplified. Access Here.
- PlatoESG. Carbon, CleanTech, Energy, Environment, Solar, Waste Management. Access Here.
- PlatoHealth. Biotech and Clinical Trials Intelligence. Access Here.
- Source: https://www.nature.com/articles/s41598-024-60986-8