Single nuclei RNA-sequencing of healthy limbus tissue snap frozen from cataract patients
We used snRNAseq to obtain an unbiased transcriptional profile of the different cells of the corneal epithelium, as snRNAseq has previously been used to resolve the cellular heterogeneity and transcriptional profiles of several frozen tissues and organs. To preserve the in situ transcriptomic profile of the limbus, healthy human limbal tissue was excised from cataract patients for immediate snap-freezing with liquid nitrogen. SnRNAseq was then performed using the 10X genomics chromium platform on 10 pooled human limbus samples to define the transcriptomes of the cell sub-populations within the human limbus (Fig. 1).
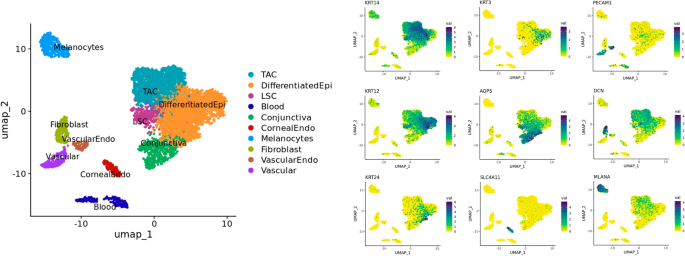
Cell clustering and annotation of single nuclei RNAsequencing data of human limbus samples snap-frozen from cataract patients (n = 10). Separate clusters were identified for basal corneal epithelial cells (KRT14), differentiated corneal epithelial cells (KRT12 and KRT3), supra-basal corneal epithelial cells (KRT24), conjunctival epithelial cells (AQP5), corneal endothelial cells (SLC4A11), vascular endothelial cells (PECAM1), stromal fibroblasts (DCN), and melanocytes (MLANA) based on the expression of well-established cell specific markers.
The Uniform Manifold Approximation and Projection (UMAP) algorithm was used for dimension reduction to visualize how separable the cell clusters are with respect to their transcriptomes. For cell annotation of the limbus sub-populations in the UMAP plot (Fig. 1), cytokeratin (KRT) expression was used to define the basal (KRT14) and differentiated populations of the cornea (KRT12 and KRT3). Supra-basal corneal epithelial cells (KRT24), conjunctival epithelial cells (AQP5), corneal endothelial cells (SLC4A11), vascular endothelial cells (PECAM1), stromal fibroblasts (DCN), and melanocytes (MLANA) were also used to annotate cell type based on well-established markers.
The LSC cluster was defined as the remaining cluster with a gene expression profile closest to basal corneal epithelial cells, and one differentiator was the global suppression of their transcriptome (Fig. 2), which is likely tied to their quiescent state. To specifically identify the LSC cluster in the UMAP plot, we assessed the expression of epithelial cytokeratins (KRT3; KRT12; KRT14; KRT15); and S100 genes (Fig. 2A); which have previously been used as markers to identify LSCs6,15,21,22,23. We also determined total gene expression levels (Fig. 2B), cell type frequency (Fig. 2C), and the S score, which is used to determine the level of cell division (Fig. 2D). KRT15, ITGβ1, and ITGβ4 represented some of the highest transcript levels in the LSC sub-population, and these genes were found expressed in approximately 50% (KRT15), and 25% (ITGβ1 and ITGβ4) of cells within the LSC cluster (Fig. 2A). KRT17 increased in expression as LSCs become transiently amplifying cells (TACs) that frequently divide, while KRT12, S100A4 and S100A6 increase in expression as TACs proliferate and differentiate to corneal epithelial cells. The LSC population represented 6.7% of the total cell population that was sequenced (Fig. 2C), however, there was no definitive quiescent sub-population of the LSCs from the S score (Fig. 2D).
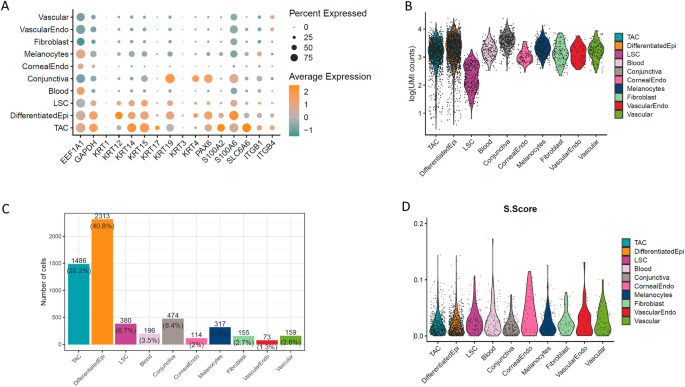
Expression profiles, cell frequencies, total read counts, and cell cycle S scores across ocular surface cell sub-populations. (A) In terms of cytokeratin expression, LSCs and TACs progenitors highly express KRT14 and KRT15, while TACs are enriched for KRT17 and differentiated corneal epithelial cells exclusively express KRT3 and KRT12. Conjunctival epithelial cells express KRT4. S100A2 was expressed in TACs, whereas S100A4 and S100A6 were enriched in differentiated corneal epithelial cells and conjunctival epithelial cells. ITGβ1 and ITGβ4 are highly expressed in approximately 25% of LSCs and 50% of the TAC population. (B) Total read counts represent the level of gene expression in each cell type captured, which was used to identify LSCs as a basal corneal epithelial cell population with a low-level of gene expression. (C) Cell frequencies indicate that approximately 6.7% of sequenced cells were identified as LSCs. (D) The S score was used to assess cell cycle rate in the cell clusters by the expression level of markers of the DNA synthesis (S-phase) stage of cell division, however, no discernable sub-population of quiescent LSCs with a low S score could be readily identified.
We investigated the genes specific to the LSC and TAC sub-populations and found KRT15, CXCL14, ITβ4, and TP63 were highly expressed in these progenitor populations of the limbus (Fig. 3). SLC6A6 expression was found to be more specific to the LSCs and the TAC population, which may represent a viable candidate to enrich corneal epithelial progenitor populations as a surface marker, alongside integrin β4. S100A2 was also found to be expressed higher in TACs when compared with differentiated corneal epithelial cells. Interestingly, CXCL14, S100A2, and SLC6A6 expression was largely absent from the conjunctival epithelium.
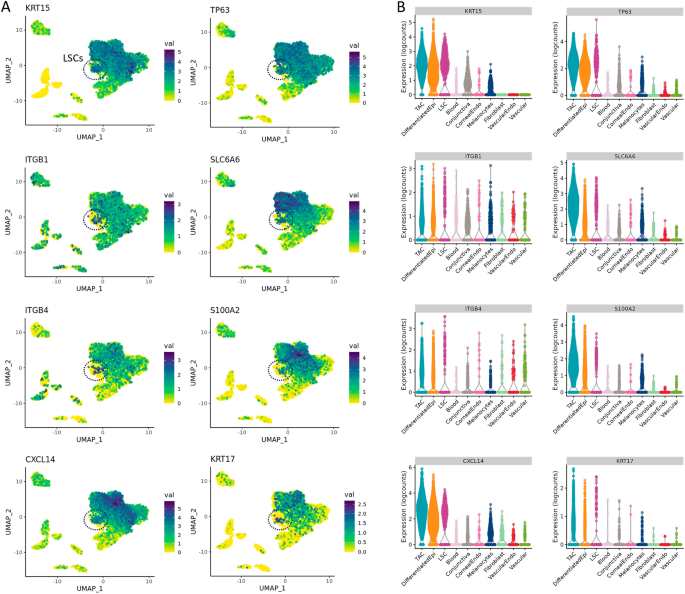
Expression profiles of genes highly expressed in LSC and TAC progenitors of the corneal epithelium. (A) Localization and (B) expression levels of KRT15, TP63, ITGβ1, SLC6A6, ITGβ4, S100A2, CXCL14, and KRT17 in corneal epithelial cell types. KRT15, TP63, CXCL14, and ITGβ4 were found to be highly expressed in both LSCs and TACs. S100A2 and SLC6A6 were largely expressed in the TAC progenitor population.
We also determined the expression levels of putative LSCs markers, such as AC093496.1, NOTCH1, GPHA2, MMP10, CASP14, and ABCB5 (Fig. 4). In our data, AC093496.1 and MMP10 are specifically expressed in the progenitor TAC population and could be used as markers, alongside SLC6A6. GPHA2 was found to be present in a sub-population of TACs and differentiated corneal epithelial cells, while NOTCH1 had the highest expression level in LSCs and low-level expression throughout the corneal and conjunctival epithelium. BMI1 and CASP14 did not show any meaningful expression levels in the LSC and TAC populations, and ABCB5, which has been suggested as an LSC marker, was found to expressed only in melanocytes in our dataset.
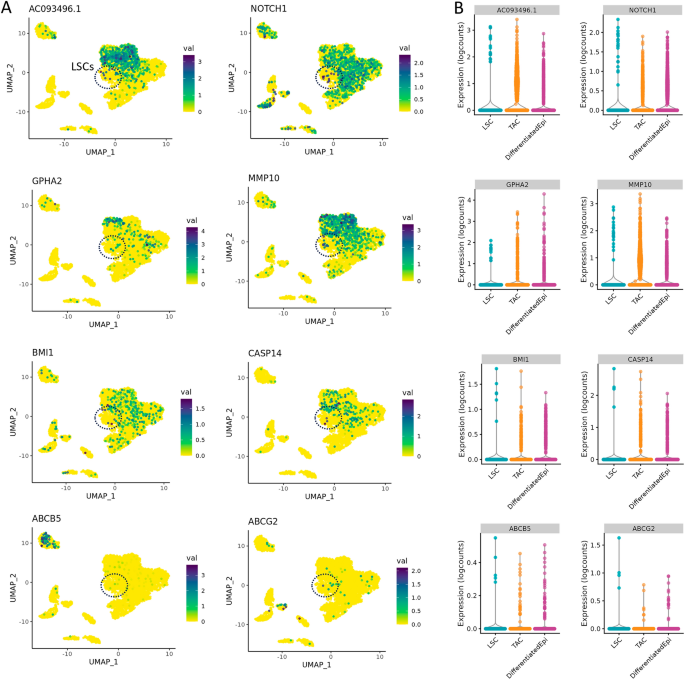
Expression profiles of putative LSC markers in the limbus. (A) Localization and (B) expression levels of AC093496.1, NOTCH1, GPHA2, MMP10, BMI1, CASP14, ABCB5, and ABCG2. We found that AC093496.1 and MMP10 expression was largely specific to the TACs sub-population and may represent the best markers for corneal epithelial cell progenitors. GPHA2 was expressed in a sub-set of TACs and differentiated corneal epithelial cells. A small proportion of the LSC cluster showed NOTCH1 expression, which was widely expressed in other epithelial cell types, much and like BMI1 and CASP14. We did not observe high expression of either of the ATP transporters, ABCB5 or ABCG2, in the LSC or TAC progenitor populations. In fact, ABCB5 expression was confined to the melanocyte population in our dataset.
Immunolabelling and holoclone forming efficiency of purified SLC6A6 and ITGβ4 positive cells from cadaveric human limbus tissue
To validate the snRNAseq of human limbus biopsies from cataract patients, we performed immunohistochemistry, immunocytochemistry, and cell purification for in vitro clonogenicity assays using the limbal progenitor markers SLC6A6 and ITGβ4 identified through snRNAseq (Fig. 5). In Fig. 5A, SLC6A6 is shown to be expressed in the membranes of basal and suprabasal limbal epithelial cells in cadaveric human tissue sections, whereas ITGβ4 was found to be expressed on the basal side of the human limbus (Fig. 5B). When only secondary antibody was used on human limbus sections, no staining was apparent (Fig. 5C).
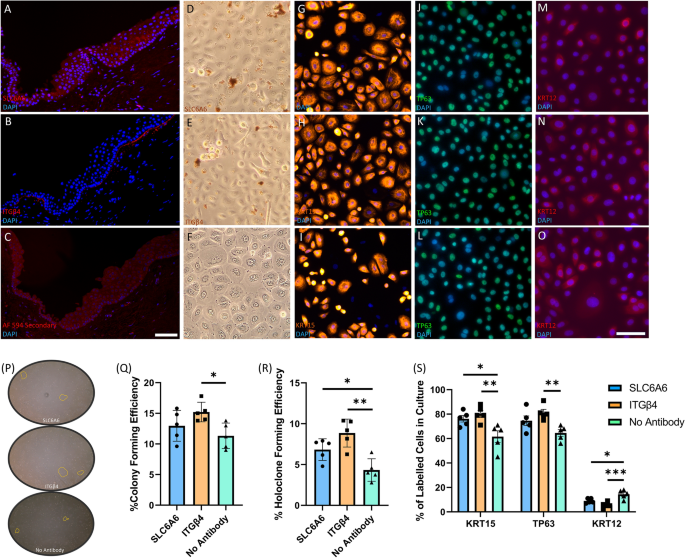
Immunofluorescence and in vitro validation of SLC6A6 and ITGβ4 surface markers of limbal epithelial progenitor cells in cadaveric human tissue. Cadaver human limbus tissue sections were stained with (A) SLC6A6, (B) ITGβ4, or (C) secondary antibody alone, to identify if these putative progenitor surface markers were expressed at the limbus, as suggested by the snRNAseq data. SLC6A6 was found to be expressed in basal and suprabasal limbal epithelial cells, while ITGβ4 was limited to basal expression at the limbus, and no specific antibody labelling was observed when only the secondary antibody was used. (D) SLC6A6 antibodies conjugated to magnetic beads were able to isolate limbal progenitor cells that can be expanded in CnT-Prime media to reach confluence in 24-well plates within 8 days. Immunolabelling of SLC6A6 purified cultures for KRT15 (G), TP63 (J), and (M) KRT12 confirmed their progenitor capacity in vitro. (E) ITGβ4 conjugated antibodies are also able to isolate limbal progenitors that expand and reach confluence in vitro and can be immunolabelled for for KRT15 (H), TP63 (K), and (N) KRT12. (F) Limbal epithelial cells that were surgically extracted from cadaveric limbal biopsies and not enriched by surface markers also reach confluence within 8 days, however, they exhibit a different immunofluorescence profile compared to SLC6A6 and ITGβ4 purified cells when stained for KRT15 (I), TP63 (L), and (O) KRT12 (Scale bar = 100µm). (P) Colonies present in culture after 10 days from seeding were quantified using ImageJ software and used to determine the colony formation efficiencies in (Q). (R) Colonies were isolated, dissociated, and then re-plated into individual wells to determine holoclone forming efficiency, which was calculated by multiplying the original colony formation efficiency with the percentage of re-seeded wells with a holoclone present. (S) The number of cells that express KRT15, TP63, and KRT12, was quantified in SLC6A6, ITGβ4, and unpurified cultures by immunocytochemistry after they had reached confluence.
Importantly, we were able to isolate SLC6A6 + (Fig. 5D,G,J,M), and ITGβ4 + (Fig. 5E,H,K,N) cells using antibodies directly conjugated to magnetic beads and then purified using an ‘easysep’ magnet for 10min for in vitro assay. Unpurified cells dissociated straight from cadaveric tissue are shown in Fig. 5F,I,L,O. Next, we compared the proliferation potential of purified and unpurified cells over 10 days and found that they all maintained their capacity to reach confluence when 25,000 cells were seeded into 24-well plates with CnT-Prime media. Immunocytochemistry was then used to compare the expression of limbal (KRT15—Fig. 5G–I), basal (TP63—Fig. 5J–L), and differentiated corneal epithelial cell markers (KRT12—Fig. 5M–O) in SLC6A6 + and ITGβ4 + purified cells compared with unpurified cells.
To determine the colony and holoclone forming efficiency of unpurified cells and SLC6A6 + and ITGβ4 + purified cells from cadaveric limbal biopsies, we plated 500 cells into 6-well plates and cultured in CnT-Prime for 8 days to quantify the number of colonies present (Fig. 5P). We found that colony forming efficiency (CFE) (Fig. 5Q) was significantly greater in ITGβ4 + purified cultures in comparison to unpurified cells (ITGβ4 + CFE = 15.2% ± 0.71 versus unpurified CFE = 11.32% ± 0.93, P = 0.031), as well as holoclone forming efficiency (Fig. 5R—ITGβ4 + HFE = 8.9% ± 0.76 versus unpurified HFE = 4.33% ± 0.0.62, P = 0.001). However, there was no significant difference in colony forming efficiency between SLC6A6 purified cells and unpurified cells, although there was a significant difference in holoclone forming efficiency when SLC6A6 cultured cells were compared with unpurified cells (SLC6A6 HFE = 6.83% ± 0.59 versus unpurified HFE = 4.33% ± 0.0.62, P = 0.049). Taken together, these results indicate that ITGβ4 + is capable of labelling progenitor cells with a higher colony and holoclone forming potential than unpurified cells.
After magnetic isolation of SLC6A6 and ITGβ4 cells, we also cultured 25,000 cells in 24-well plates and CnT-Prime media for 8 days before fixation in paraformaldehyde and immunocytochemistry labelling for KRT15, TP63, and KRT12, to determine the extent of basal and differentiated corneal epithelial cells in culture (Fig. 5S). Of note, we found that ITGβ4 + purified cells generate a significantly greater proportion of the basal limbal epithelial markers KRT15 (ITGβ4 + KRT15 = 80.2% ± 2.85 versus unpurified KRT15 = 61.6% ± 4.77, P = 0.0079) and TP63 (ITGβ4 + TP63 = 81.2% ± 5.9 versus unpurified TP63 = 64.6% ± 6.025, P = 0.0077). Moreover, the percentage of cells that express the differentiated corneal epithelial marker KRT12 was significantly decreased in ITGβ4 + purified cells (ITGβ4 + KRT12 = 5.4% ± 1.12 versus unpurified KRT12 = 14.4% ± 1.6, P = 0.0006), suggesting that ITGβ4-positive cells preferentially maintain an undifferentiated state when proliferating.
Limbal stem cell differentiation to corneal epithelium unveiled by trajectory analysis of gene expression
To determine the gene expression changes that define LSC differentiation, we applied a pseudo-time analysis to understand the trajectory and gene expression changes that occur as LSCs transition to differentiated corneal epithelial cells. Pseudo-time analysis is a computational method that infers a dynamic trajectory of a process, such as cell differentiation, from a snapshot of cells in different states of the entire process. In this way, the pseudo-time analysis can capture a biologically relevant process in the dataset, such as a progression from stem cells to terminally differentiated epithelial cells in our case (Fig. 6). In this way, we aimed to determine the genes that may be responsible for stem cell quiescence or activation of LSCs to undergo differentiation to corneal epithelial cells.
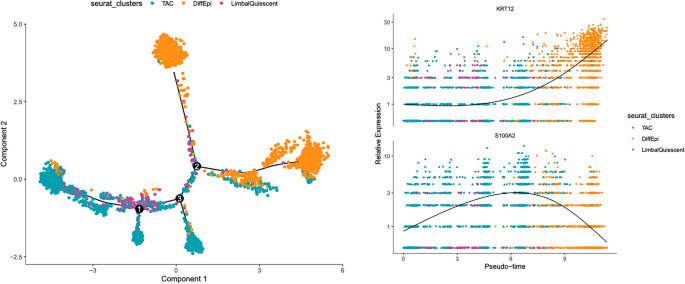
Pseudo-time analysis of LSC differentiation to corneal epithelial cells. LSCs (purple) and TACs (cyan) exhibit a similar gene expression pattern and overlap in a trajectory analysis of LSC differentiation, suggesting that LSCs are uni-potent progenitors of TACs. Differentiated corneal epithelial cells (orange) are defined by increased KRT12 expression and a loss of S100A2. Overall, LSC differentiation is defined by a loss of stem cell quiescence, centripetal migration towards the central cornea and a subsequent increase in KRT12 expression and loss of S100A2 expression.
In Fig. 6, the cells that we have identified as LSCs in our samples are inferred to be at one end of the pseudo-time projection, and as this is an unsupervised analysis, these results support our initial conclusion with respect to that cell population. Secondly, we found that the most distinctive gene expression changes that occurred when LSCs differentiated to corneal epithelial cells was an increase in KRT12 coupled with a decrease in S100A2. However, S100A2 was expressed in LSCs and TACs so the two populations have merged when it is used to project cell differentiation. The similarity in the transcriptomes of LSCs and TACs was observed in the trajectory analysis as the clusters consistently overlap. From this, we can infer that LSCs and TACs have similar transcriptomes and, therefore, LSC quiescence may be regulated through epigenetic changes, paracrine cell signaling, the extra-cellular matrix that forms the stem cell niche, or in development.
- SEO Powered Content & PR Distribution. Get Amplified Today.
- PlatoData.Network Vertical Generative Ai. Empower Yourself. Access Here.
- PlatoAiStream. Web3 Intelligence. Knowledge Amplified. Access Here.
- PlatoESG. Carbon, CleanTech, Energy, Environment, Solar, Waste Management. Access Here.
- PlatoHealth. Biotech and Clinical Trials Intelligence. Access Here.
- Source: https://www.nature.com/articles/s41598-024-57242-4