Inhibition of FAK leads to acinar lineage conversion to insulin-producing cells
We have previously reported that while conditional deletion of Ptk2 (the gene encoding FAK) during pancreatic development in PdxCre;Fak fl/fl mice caused delayed acinar differentiation, the pancreas of the postnatal heterozygous littermates contained cells co-expressing insulin and amylase26. Pdx1 is one of the earliest markers for pancreatic lineage, thus the appearance of these insulin+/amylase+ cells in 1-month-old PdxCre;Fak fl/wt pancreas could be due to abnormal pancreatic development in the mutant embryos. Alternatively, these insulin+/amylase+ cells could be cells in transition during either β-cell to acinar or acinar to β-cell conversion. To discriminate between these possibilities, we first treated 8-week-old wild-type C57BL/6 mice with the FAK inhibitor PF562271 (FAKi), which specifically inhibits pFAK kinase activity27,28,29,30. The mice received FAKi treatment (50 mg/kg) or vehicle via oral gavage twice a day for 3 weeks. The regiment used in our study was based on a phase I trial in cancer patients as well as previous studies in mice29,30. The mice were euthanized immediately following the 3 weeks treatment. Serum amylase and lipase, glucose tolerance and body weights were not different between the FAKi-treated and vehicle-treated cohorts (Fig. 1a–e). The pancreas of FAKi-treated mice displayed overall normal histology.
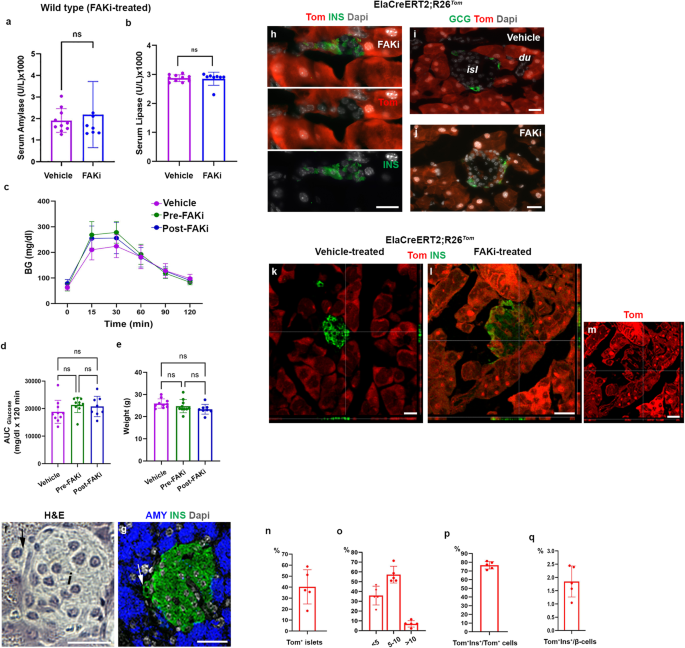
a, b Measurement of serum amylase (a), or serum lipase (b) in vehicle-treated (n = 8) or FAKi-treated mice (n = 7 in a, and n = 8 in b). c–e Graphs showing glucose tolerance test (n = 10 for Vehicle, 10 for Pre-FAKi, and 8 for Post-FAKi group) (c), area under the curve (AUC) analysis for the IPGTT (d), or body weight of the mice at the time of the IPGTT (e). f, g H&E (f) and the corresponding immunostaining for detection of insulin and amylase on samples obtained from FAKi-treated mice showing a single insulin+ cell adjacent to an islet (arrows in f and g). n = 5 mice. h Imaging of tamoxifen-induced ElaCreERT2,R26Tom mice treated with FAKi showing Tom+/insulin+ cells outside the endocrine islets. n = 5 mice from 3 independent experiments. i, j Fluorescent imaging of tamoxifen-induced ElaCreERT2,R26Tom mice treated with vehicle (i) or FAKi (j) for detection of tomato and glucagon showing Tom+/Gcg– cells within the islets. n = 5 mice from 3 independent experiments. k–m Confocal imaging of tamoxifen-induced ElaCreERT2,R26Tom mice treated with vehicle (k) or FAKi (l, m) for detection of Tomato and insulin showing Tom+/insulin+ cells within islets. n = 5 mice from 3 independent experiments. n–q Quantification of tomato-labeled (Tom+) cells infiltrating the endocrine islets at the end of FAKi treatment. The percentage of islets infiltrated by Tom+ cells (n). The percentage of islets containing, less than 5 Tom+ cells, 5–10 Tom+ cells or more than 10 Tom+ cells per islet (o). The percentage of insulin-producing cells among the intra-islet Tom+ cells (p). The contribution of acinar-derived insulin-producing cells to the total β-cell population (q). n = 5 mice. Statistical analysis was performed using unpaired, two-tailed t-test in (a, b) and one-way ANOVA in (d, e). Data is presented as mean ± SD. isl: islet, du: duct. Scale bar = 20 μm. Source data are provided as a Source data file.
However, upon closer examination, we could occasionally find cells co-expressing insulin and amylase in the FAKi-treated pancreas (Supplementary Fig. 1a). These insulin+/amylase+ cells, which resembled those found in the PdxCre;Fakfl/wt pancreas26 displayed relatively lower levels of insulin and amylase compared to the regular acinar or β-cells (Supplementary Fig. 1b–d). Anecdotally, we could also detect few single endocrine cells adjacent to islets (Fig. 1f). Presence of peri-insular endocrine cells was determined by immunostaining of insulin (Fig. 1g). The normal serum pancreatic enzymes, glucose tolerance test and overall pancreas histology suggest that FAKi treatment does not have any adverse effects on the exocrine enzyme secretion nor endocrine function of the pancreas.
To determine whether chemical inhibition of FAK could convert acinar cells into insulin-producing cells, we next employed ElaCreERT2;R26Tom mice (ElaTom mice), which uses the elastase promoter to target Cre-recombinase expression to pancreatic acinar cells7,31,32. Tamoxifen treatment leads to tomato-red expression in essentially all acinar cells in the ElaTom mice. Hence, the presence of tomato-labeled non-acinar cells would imply that these cells originated from pre-existing labeled acinar cells. In this study, 6-week-old ElaTom mice received tamoxifen via gavage feeding. At 8 weeks of age, these mice were then treated with FAKi or vehicle for 3 weeks, in conjunction with BrdU administration via drinking water. Finally, mice were sacrificed 2 weeks after cessation of the FAKi treatment. Unlike the vehicle-treated cohort, in the FAKi-treated ElaTom mice we could occasionally find Tom+/Ins+ cells outside the islets (Fig. 1h and Supplementary Fig. 2a–d). These Tom+/Ins+ cells could be found in larger (Fig. 1h and Supplementary Fig. 2a, b) or smaller clusters (Supplementary Fig. 2c) or as single cells (Supplementary Fig. 2d). These Tom+/Ins+ cells displayed different degrees of maturation, as evident by differences in detectable GLUT2 (Supplementary Fig. 2a), a marker for β-cell maturation33. Moreover, amylase expression was lost in the Tom+/Ins+ cells (Supplementary Fig. 2a–d), which is consistent with the notion that lineage conversion requires cells to initially lose their identity before acquiring the new one. The presence of Tom+/Ins+ cells in the FAKi-treated mice shows a progenitor-progeny relationship between the acinar cells and insulin-producing cells.
Acinar-derived insulin-producing (ADIP) cells infiltrate pre-existing endocrine islets
In line with previous reports7,31, tamoxifen-treatment in the control ElaTom mice led to tomato expression in the acinar cells, whereas endocrine and duct cells were negative for tomato-labeled cells (Fig. 1i, k). However, in the FAKi-treated mice, we could find Tom+ cells in 40.2% ± 15.6 of endocrine islets (Fig. 1j, l–n). Among islets containing Tom+ cells, 35.8% ± 9.6 had less than 5 Tom+ cells, 57.2% ± 8.5 had 5–10 Tom+ cells and 6.9% ± 3.3 contained more than 10 Tom+ cells per islet (Fig. 1o). While we could not find any Tom+/Gcg+ cells in the FAKi-treated ElaTom mice (Fig. 1j), 76.5% ± 4.3 of Tom+ cells found in islets were insulin+ (Fig. 1p). In total, the intra-islet ADIP cells contributed to 1.85% ± 0.6 of all β-cells in the FAKi-treated mice (Fig. 1q).
Similar to the Tom+/Ins+ cells detected outside the islets, the Tom+/Ins+ cells within the islets did not express amylase (Fig. 2a). However, unlike their extra-islet counterparts where GLUT2 displayed a heterogenous expression (Supplementary Fig. 2a), the intra-islet Tom+/Ins+ cells were all positive for GLUT2 (Fig. 2b), indicating that the intra-islet ADIP cells are likely more mature than extra-islet ADIP cells. Along with GLUT2, we could find other bona fide β-cell markers such as PDX1 (Fig. 2c), and NKX6.1 in ADIP cells (Fig. 2d–f and Supplementary Fig. 2e). Consistent with our quantification analysis (Fig. 1p), confocal immunofluorescence imaging further revealed that the intra-islet Tom+ population was not homogenous, but rather consisted of cells at different stages in the transformation process of acinar into insulin-producing cells (Fig. 2d–f). Accordingly, we could find Tom+/Nkx6.1−/Ins– cells (Fig. 2d) Tom+/Nkx6.1+/Ins+ cells (Fig. 2e) and Tom+/Nkx6.1+/Ins– cells (Fig. 2f) embedded within the same islet. Notably, none of the intra-islet Tom+ cells displayed BrdU incorporation (Fig. 2g), suggesting that this phenomenon relies primarily on acinar conversion rather than proliferation of ADIP cells.
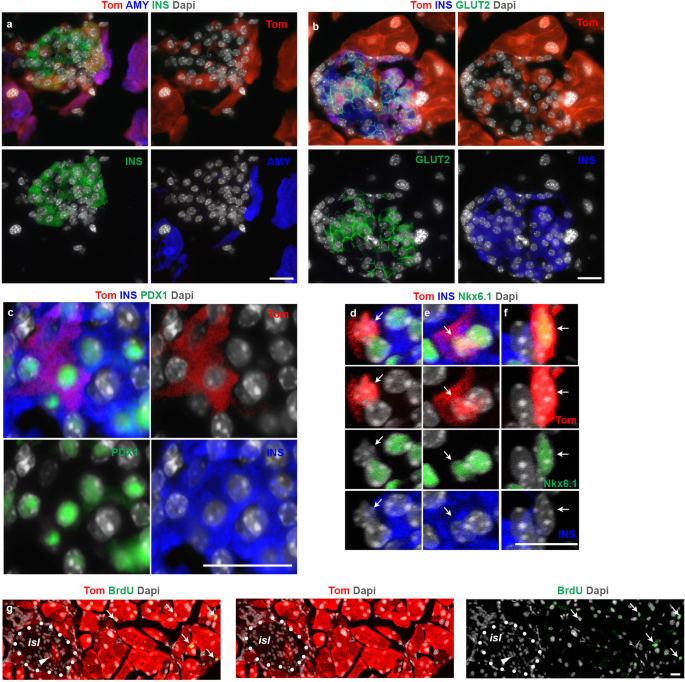
a–f Imaging of tamoxifen-induced ElaCreERT2,R26Tom mice treated with FAKi showing Tom+/insulin+ cells within the endocrine islets. n = 5 mice from 3 independent experiments. Fluorescent imaging of Tomato in conjunction with insulin and amylase (a), insulin and GLUT2 (b), insulin, and PDX1 showing islet infiltrated with three Tom+ cells (c). Confocal fluorescent imaging of Tomato in conjunction with insulin and Nkx6.1 (d–f). d–f Higher magnification of three Tom+ cells shown in (Supplementary Fig. 2e). Arrows highlight a Tom+/Nkx6.1–/Ins– cell (d), a Tom+/Nkx6.1+/Ins+ cell (e) and a Tom+/Nkx6.1+/Ins– cell (f). g Fluorescent imaging of Tomato in conjunction with BrdU on tissues obtained from tamoxifen-induced ElaCreERT2,R26Tom mice treated with FAKi showing the absence of proliferation among Tom+ cells within the endocrine islets. Dotted line mark and islet. Arrowheads in (g) highlight Tom+ cells inside the islet. Arrows in (g) show BrdU+ acinar cells. isl: islet. Scale bar = 20 μm. n = 5 mice from 3 independent experiments.
Together, our lineage-tracing data clearly shows that specific inactivation of FAK kinase activity converts acinar cells into insulin-expressing cells. Noteworthy, these cells can either form clusters outside the islets or infiltrate pre-existing endocrine islets.
ADIP cells partially improve blood glucose in diabetic mice
FAKi-induced conversion of acinar cells into insulin-producing cells is indeed a remarkable finding. However, there is no translational benefit if these cells are not functional. If being integrated into pre-existing islets would be a key element for ADIP cells to be functional, then near-total ablation of β-cells with high dose streptozotocin (STZ) would most likely undermine the ability of ADIP cells to infiltrate the islets and restore normoglycemia. Therefore, to achieve partial β-cell ablation, we treated 10-week-old wild-type CD1 female mice with low dose (40 mg/kg) STZ. While this approach resulted in elevated random blood glucose (BG) within a week in all treated mice, only 50% developed hyperglycemia in the following weeks (Supplementary Fig. 3a). Noteworthy, mice that maintained normoglycemia never displayed BG above 300 mg/dl (Supplementary Fig. 3f–j, green line) and those who reached 300 mg/dl did not show any signs of recovery (Supplementary Fig. 3b–e, k, red line). Thus, in this cohort, a BG of 300 mg/dl appears to be a critical threshold for further progression to diabetes.
To test whether FAKi treatment would improve or reverse hyperglycemia, we next treated 10-week-old CD1 female mice with low-dose STZ. Mice that reached a random BG of 300 mg/dl were either treated with 50 mg/kg FAKi twice daily for 3 weeks (Fig. 3a, blue line) or vehicle (Fig. 3a, red line). Mice that did not reach the 300 mg/dl BG threshold were left untreated (Fig. 3a, green line). As demonstrated in Fig. 3a, FAKi treatment led to partial improvement of the hyperglycemia (Fig. 3a, blue line and Supplementary Fig. 4a). Interestingly, one week into FAKi-treatment the random BG dropped sharply below 300 mg/dl in 20% (2/10) of mice (Supplementary Fig. 4b, c). In addition, 70% (7/10) showed a gradual decrease below 300 mg/dl post-FAKi treatment (Supplementary Fig. 4d–j), whereas 10% (1/10) did not respond and progressed to diabetes (Supplementary Fig. 4k). Importantly, mice that recovered (9/10) showed BG values below 300 mg/dl for the remainder of the study (1 month after FAKi-treatment cessation), at which time the mice were sacrificed. These data indicate that maintaining blood glucose does not rely on continuous FAKi-treatment.
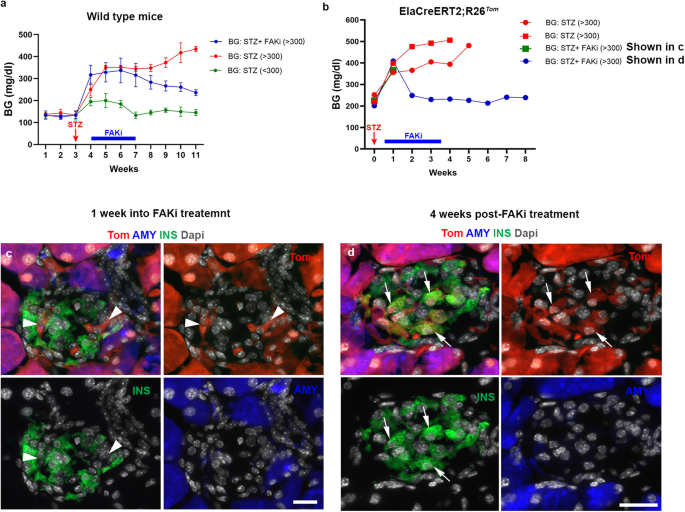
a Graph showing average weekly blood glucose (BG) measurements in wild-type mice treated with low-dose STZ. (green line, BG < 300, n = 5), (red line, BG > 300, n = 5), and (blue line, FAKi treated BG > 300, n = 10). b Graph showing average weekly blood glucose measurements in ElaCreERT2;R26Tom mice treated with low dose STZ, which reached 300 mg/dl (n = 4) showing that mice that received vehicle (n = 2) did not recover (red lines). Among FAKi-treated mice (n = 2), one was euthanized a week into treatment (green line, corresponding to c), whereas the other mouse showed improved BG values and was euthanized 4 weeks post-FAKi treatment (blue line, corresponding to d). c, d Fluorescent imaging of Tomato in conjunction with insulin and amylase on tissues obtained from ElaCreERT2,R26Tom mice treated with low dose STZ (n = 4) followed by FAKi or vehicle (n = 2 per group). Mice were euthanized either 1 week into FAKi treatment (c), (n = 1), or 4 weeks after FAKi treatment cessation (d), (n = 1). Random blood glucose was checked daily at the same time to calculate the average weekly BG in (a, b). Arrowheads in (c) and arrows in (d) show Tom+/Ins– or Tom+/Ins+ cells, respectively. Data in (a) is presented as mean ± SD. Scale bar = 20 μm. Source data are provided as a Source data file.
To confirm that the observed improvement of hyperglycemia in diabetic mice is the result of acinar cell conversion (ADIP cells), we studied the effect of FAKi treatment on diabetic ElaTom mice. Here, low-dose STZ-treated ElaTom mice were given FAKi or vehicle once BG reached 300 mg/dl. In line with our previous results in wild-type mice treated with low dose STZ (Fig. 3a), we observed improved BG values following FAKi-treatment, whereas the vehicle-treated mice remained hyperglycemic (Fig. 3b). The mice were then euthanized either 1 week into FAKi treatment (early group) (Fig. 3c) or 4 weeks after treatment cessation (late group) (Fig. 3d). Similar to the non-diabetic FAKi-treated mice (Fig. 2a), in both cohorts the intra-islet Tom+ cells had lost amylase expression and could be detected among pre-existing β-cells that had survived the STZ-treatment (Fig. 3c, d). However, while the Tom+ cells in the early cohort did not express insulin (Fig. 3c), the Tom+ cells in the late cohort displayed a mixture of insulin+ and insulin– cells, suggesting a progressive transition of acinar cells into insulin-producing cells (Fig. 3d). The appearance of Tom+/Ins+ cells post-FAKi treatment (Fig. 3d) is consistent with the observed improvement in hyperglycemia in diabetic mice treated with FAKi (Fig. 3a and Supplementary Fig. 4).
To study the effect of FAKi treatment following near total ablation of β-cells, 10-week-old CD1 female mice were treated with high dose STZ (150 mg/kg), or saline. Once the STZ-treated mice developed hyperglycemia (BG > 300 mg/dl), insulin pellets were implanted subcutaneously as a bridge to maintain a reasonable BG in these mice. Then, the mice from both groups were subjected to either FAKi treatment or vehicle for 3 weeks (Fig. 4a).
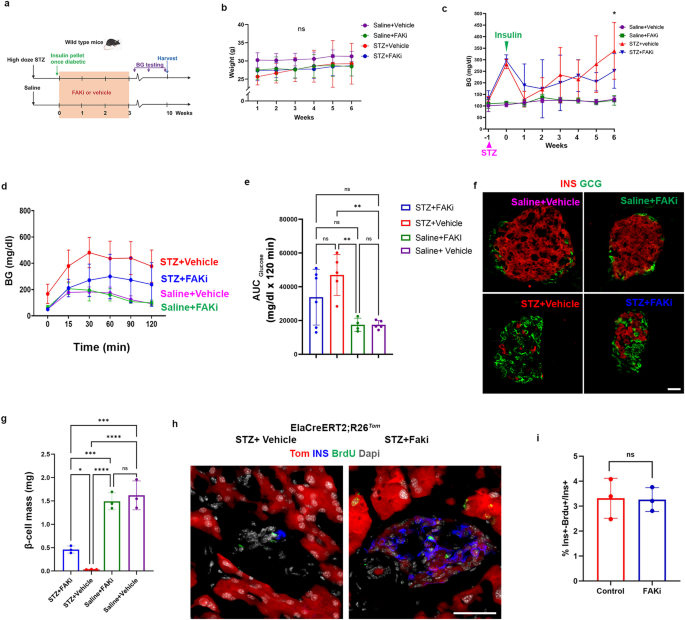
a A schematic representation of high-dose STZ-induced diabetes and FAKi treatment in wild-type mice. b, c Weekly measurements of the body weight (b) or the average random BG (c) in the 4 cohorts, *p ≤ 0.05 refers to multiple comparison between STZ+vehicle or STZ+FAKi treated mice. Random blood glucose was checked daily at the same time to calculate the average weekly BG in (c). The timepoints for STZ treatment or insulin pellet insertion are indicated by pink (STZ) or green (insulin) arrowheads in (c). d, e Graph for glucose tolerance test (d) and area under the curve (e) performed on the four indicated cohorts (n = 6 for STZ+FAKi), 5 for STZ+Vehicle, 4 for Saline+FAKi, and 5 for Saline+Vehicle group). f Immunofluorescent imaging for detection of insulin and glucagon of representative islets obtained from the indicated cohorts (n = 3 per group). g β-cell mass quantification in the indicated cohorts (n = 3 per group). h Immunofluorescent imaging for detection of Tomato, insulin and BrdU in STZ+vehicle or STZ+FAKi ElaCreERT2,R26Tom treated mice showed no differences in proliferation between the cohorts (n = 3 per group). i Quantification of ins+/BrdU+ cells in ElaCreERT2,R26Tom mice treated with STZ+vehicle or STZ+FAKi (n = 3 per group). Data is presented as mean ± SD. Statistical analysis was performed using two-way ANOVA (b, c), one-way ANOVA in (e, g) followed by Holm-Sidak for multiple comparisons, and unpaired two-tailed t-test (i). *p ≤ 0.05, ***p ≤ 0.001, ****p ≤ 0.0001. Scale bar = 20 μm. Source data are provided as a Source data file.
To evaluate the effect of FAKi treatment on glucose homeostasis, the weight of the mice was monitored on a weekly basis (Fig. 2b). In addition, daily random blood glucose measurements were performed after the initiation of the FAKi/vehicle treatment (Fig. 4c). The insulin pellets started to dissolve 5 weeks after implantation (Fig. 4c). All cohorts were subjected to an intraperitoneal glucose tolerance test (IPGTT) 4 weeks after the cessation of the FAKi treatment (7 weeks post-STZ). Consistent with our previous results (Fig. 1), FAKi treatment in non-diabetic mice did not have any substantial effects on the blood glucose, GTT or β-cell mass (Fig. 4d–g). The STZ+FAKi-treated mice showed lower BG compared to the STZ+vehicle-treated mice at 6 weeks but had higher BG than the saline+vehicle-treated control cohort (Fig. 4c). Furthermore, the STZ+FAKi-treated mice showed partially improved glucose tolerance compared with the STZ+vehicle cohort (Fig. 4d, e). Accordingly, immunofluorescence analysis showed that the STZ+FAKi-treated animals regained approximately 30% of their original β-cell mass compared to the saline+vehicle or saline +FAKi cohorts (Fig. 4f, g). The ki67 staining revealed that the few proliferating insulin+ cells (Supplementary Fig. 5) could not account for the observed increased β-cell mass in the STZ+FAKi-treated mice. To determine whether the partial β-cell mass recovery was due to higher proliferation rate among ADIP cells during FAKi treatment, diabetic ElaTom mice (high dose STZ) were then treated with FAKi or vehicle for 3 weeks, during which they were given BrdU via drinking water. The mice were sacrificed immediately after cessation of the FAKi treatment. The subsequent BrdU analyses showed no difference in proliferation between the two cohorts (Fig. 4h, i).
These data collectively indicate that FAKi treatment could partially restore β-cell mass and reverse hyperglycemia in mice treated with high dose STZ. This partial recovery does not rely on proliferation of ADIP cells but is rather the result of higher conversion rate of acinar cells into insulin-producing cells. Furthermore, it shows that ADIP cells are attracted to the islets even in the absence of β-cells.
Pharmacological inhibition of FAK in a diabetic non-human primate (NHP)
The effect of FAKi on mouse acinar cells encouraged us to further investigate the potential translational benefits of FAKi for diabetes treatment. In an exploratory study we investigated the effect of FAKi on a STZ-induced diabetic NHP. To induce diabetes, the NHPs are injected with a single dose of 50 mg/kg STZ. Once random blood glucose reaches 300 mg/dl, the NHPs are managed with multiple daily injection insulin therapy (a basal and a bolus insulin). Administration of exogenous insulin allows STZ-treated NHPs to maintain BG mostly between 60 and 200 mg/dl. The blood glucose and insulin dose generally take ~1 month to stabilize. Therefore, further interventions are typically planned for after this initial month.
In our study, four diabetic Cynomolgus macaques (males and females), which were part of an unrelated study conducted at our NHP facility, were used as non-FAKi treated cohort. These animals were between 4 and 6 years of age and weighed 4.5–7 kg. We monitored the daily BG and insulin intakes of these four diabetic animals for up to 3 months after STZ treatment. During this period, the exogenous insulin requirements of these diabetic NHPs ranged between 5 and 20 units per day (Fig. 5a, red line and Supplementary Fig. 6a). Next, we studied the FAK inhibitor in an experimental animal. To do so, FAKi treatment was initiated in a diabetic Cynomolgus macaques (male), approximately 5 weeks after the STZ administration, when the BG and insulin dose were stabilized (Fig. 5a, blue line and Supplementary Fig. 6b). The exogenous insulin requirements of this diabetic animal fluctuated between 5 to 20 units per day in the weeks before and after FAKi treatment. However, approximately 6 weeks after FAKi cessation, a stable near 60% reduction of exogenous insulin requirements was observed (Fig. 5a and Supplementary Fig. 6b). The reduced insulin requirement in the FAKi-treated diabetic NHP sustained without additional treatments until the animal was euthanized 4 months later (Fig. 5a and Supplementary Fig. 6b). Of note, the NHP maintained the same weight throughout the study (Fig. 5b). In the normal pancreas, islets composed of α- and β-cells were easily detected (Fig. 5c and Supplementary Fig. 7a). STZ treatment led to near complete ablation of β-cells (Fig. 5d and Supplementary Fig. 7b), However, in accordance with the reduced exogenous insulin requirements, we could find clusters of β-cells in the diabetic NHP that had been treated with FAKi (Fig. 5e and Supplementary Fig. 7c–e). Quantification of β-cell area from the head, the body and the tail of the pancreas revealed a significant increase in the β-cell area in the STZ+FAKi-treated NHP compared to the diabetic control NHP (Fig. 5f).
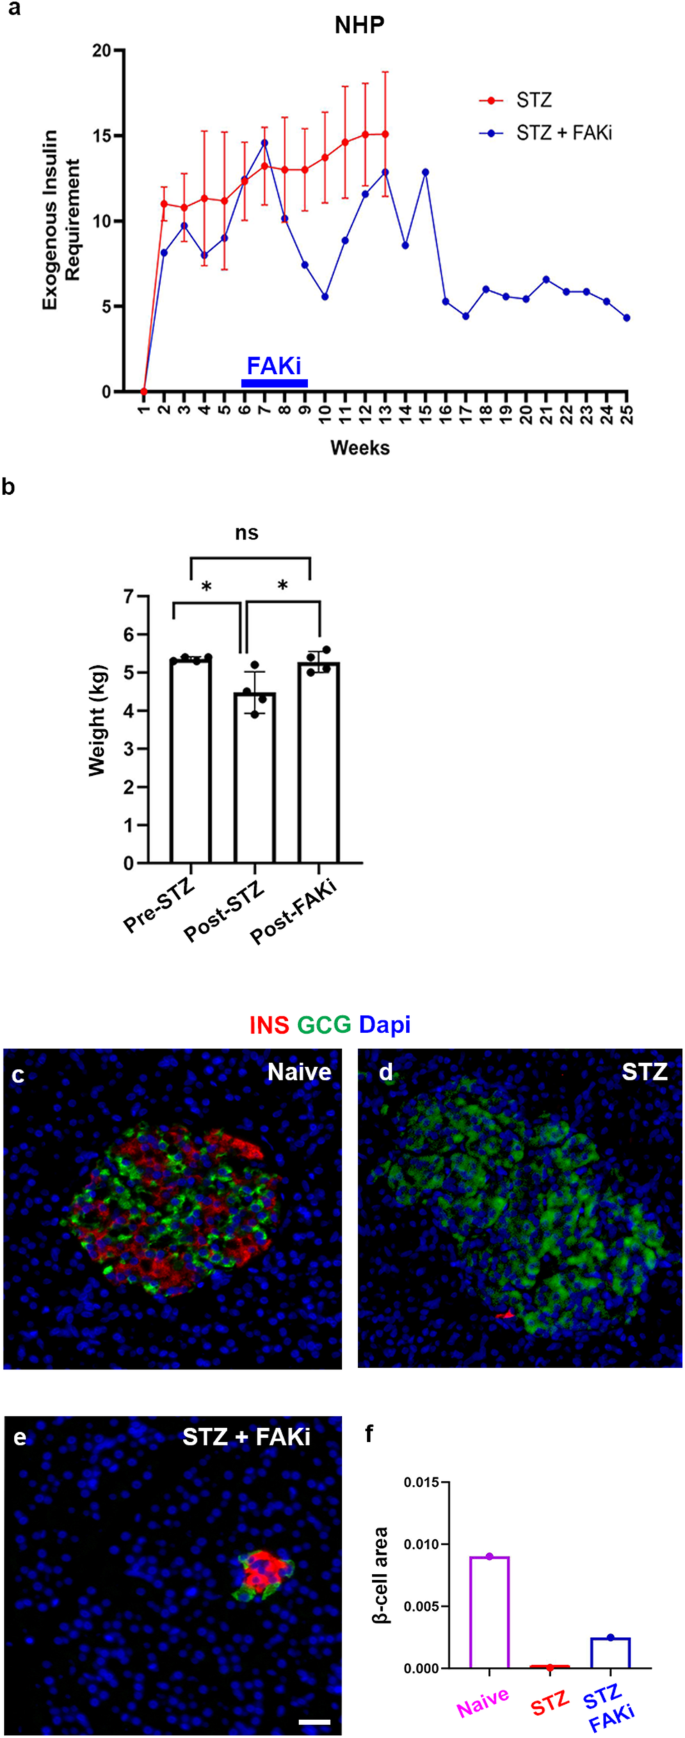
a Graph showing the average total weekly exogenous insulin requirements based on daily measurements in NHPs treated with STZ (n = 4) or STZ followed by FAKi treatment (n = 1). The blue bar on the x-axis denotes the period of FAKi treatment. b Graph showing the average weight of the FAKi-treated diabetic NHP (n = 1), at different occasions during indicated timepoints, including Pre-STZ treatment, Post-STZ treatment, and Post-FAKi treatment. c–e Immunofluorescent imaging for detection of insulin and glucagon of representative islets obtained from the indicated cohorts (n = 1 per group). f β-cell area quantification in the indicated cohorts. n = 1 NHP in each cohort. Data is presented as mean ± SD. Statistical analysis was performed using one-way ANOVA followed by Holm-Sidak test for multiple comparisons in (b). Scale bar = 20 μm. Source data are provided as a Source data file.
Unlike rodents, α- and β-cells are found intermixed in the human and NHP islets. However, endocrine clusters in both developing and postnatal human pancreas (up to 6 months of age) display an architecture commonly observed in the rodent islets34. Notably, in the STZ+FAKi-treated NHP pancreas we could find clusters of insulin-expressing cells that were surrounded by α-cells, resembling the rodent islets (Fig. 5e). This observation would further support the concept that these are newly formed islet-like structures. Together, these findings warrant more rigorous and in-depth studies to determine whether FAKi treatment would lead to β-cell neogenesis in NHPs.
Transcriptomic analysis of FAKi-treated pancreatic endocrine islets
Our lineage tracing studies establish a progenitor-progeny relationship between acinar cells and the ADIP cells. To better characterize these newly formed insulin-producing cells, we conducted single-cell RNA sequencing (scRNA-seq) analysis on islets isolated from wild-type mice 10 days after cessation of vehicle- or FAKi treatment. Approximately 8500 cells were sequenced at 225,000 reads per cell. Only single cells with mitochondrial RNA less than 8% of the total RNA were included. Using previously established scRNA-seq data analysis pipeline (see “Methods”), a uniform manifold approximation and projection (UMAP) plot of the control and FAKi-treated cells was generated (Supplementary Fig. 8a). The overall identity of the cells was confirmed by the expression of known endocrine-, ductal-, acinar-, endothelial-, or immune cells markers (Supplementary Fig. 8b).
In our transcriptomic analysis, we focused on acinar and β-cells, as we expected the ADIP cells to display an acinar/β-cell hybrid signature. We found two clusters of acinar cells along with two clusters of β-cells in both vehicle- and FAKi-treated samples (Fig. 6a and Supplementary Fig. 8a). Surprisingly, the distinction between these two groups of acinar cells was based primarily on differential expression of both acinar genes and β-cell markers (Fig. 6b). Comparing to acinar cells in cluster 2, cells in acinar cluster 1 displayed significant lower expression of the acinar markers such as Ptf1a, Cpa1, Amy2a2, Prss2, and Klk1, but increased expression of β-cell markers Ins1, Ins2, Pdx1, Nkx6.1, and Mafa (Fig. 6b). Immunostaining analyses further confirmed the presence of amylaselow acinar cells in proximity of islets (Fig. 6c). Interestingly, in response to FAKi treatment, we noticed the formation of a bridge between cluster 1 acinar and cluster 1 β-cells (Fig. 6a) and a loss in Ptf1a expression among cluster 1 acinar cells (Fig. 6b). Notably, cluster 1 β-cell expressed higher levels of Cpa1 and Prss2 than cells in cluster 2 β-cells (Fig. 6d). While FAK inhibition altered gene expression patterns of cluster 1 acinar cells, it did not significantly affect expression of genes such as Pdx1, or Ptf1a expression in cluster 2 acinar cells (Fig. 6b).
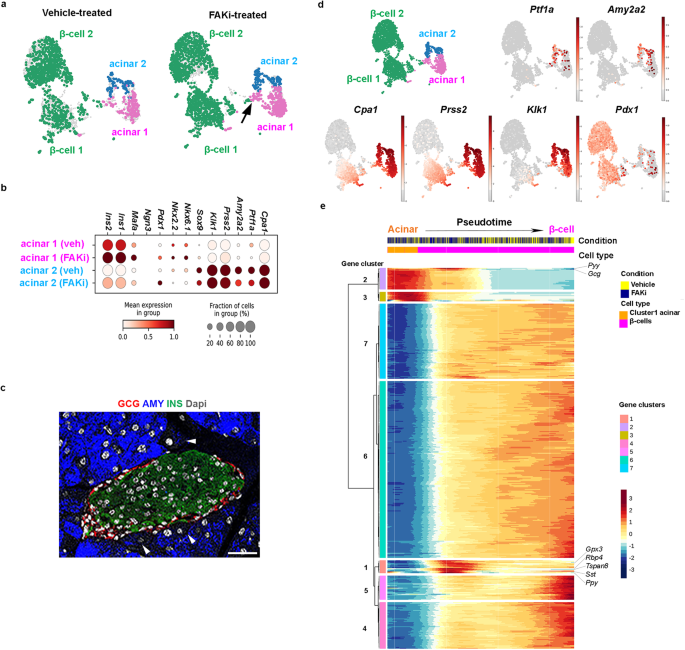
a UMAPs of the identified acinar or β-cell clusters defined by specific color showing vehicle- vs FAKi-treated. Arrow shows the formed bridge between acinar cluster 2 and β-cells in FAKi-treated samples. b Gene expression dot plots of selected marker genes across cluster 1 vs cluster 2 acinar cells in vehicle- versus FAKi-treated samples. c Fluorescent imaging for detection of amylase, insulin, and glucagon in wild type control pancreas. Arrowheads highlight two peri-islet acinar cells with low amylase expression. Scale bar = 20 μm, n = 5. d Single-cell gene expression of known pancreatic or acinar markers. e Heatmap showing the gene expression dynamics of the acinar and β-cell from acinar cells onward. Genes were grouped based on k-means clustering, and select genes are labeled on the right side of the plot.
Gene ontology terms (GO-term) analysis showed differential activation of insulin resistance, MODY and prolactin signaling pathways in cluster 1 acinar cells in vehicle-treated samples (Supplementary Fig. 8c). Accordingly, Differentially Expressed Genes (DEGs) analysis identified several genes with β-cell specific expression in vehicle-treated cluster 1 acinar cells such as Ins1, Ins2, islet amyloid polypeptide (Iaap), glucose-6-phosphatese c2 (G6pc2), prolactin receptor (Prlr) and cyklinD2 (Ccnd2) as the top DEGs in cluster 1 acinar cells. G6PC2 converts glucose-6-phosphate to glucose and is predominantly expressed in β-cells35. IAAP is expressed in β-cells and is co-secreted with insulin in response to glucose36, whereas PRLR mediates proliferation during pregnancy in rodents37. These data indicate that at baseline, acinar cells within cluster 1 not only express insulin, but also genes involved in different aspects of β-cell function. In addition, in vehicle-treated mice, GO-term of DEGs also revealed suppression of genes associated with the acinar lineage including amylase (Amy2a2), Cpa1, and elastatse (Cel1) (Supplementary Fig. 8c). In FAKi-treated mice, cluster 1 cells displayed further activation of insulin resistance, and FoxO signaling pathways FAKi-treated mice (Supplementary Fig. 8d). Interestingly, GO-term of DEGs showed suppression of additional acinar pathways in cluster 1 with FAKi treatment such as lipase-, hydrolase-, or peptidase activity, and zymogen granule or zymogen granule membrane (Supplementary Fig. 8d). These results suggest that FAKi treatment suppresses the acinar gene signature of cluster 1 acinar cells and enhances their endocrine gene expression.
In order to reconstruct the sequence of gene expression profiles and the evolution of the ADIP cells, we performed an in-silico reconstruction of the cell lineages using slingshot and ordered them along a pseudotime (Fig. 6e). We obtained two cell lineages (acinar and β-cells), and we compared how the lineages acquire their identity by selecting differentially expressed genes (q-values < 1e10−5) along the predicted pseudotime. We found seven gene clusters that were upregulated along different segments of the pseudotime trajectory and conducted pathway analysis to identify pathways enriched at each stage of pseudotime (Fig. 6e). Genes upregulated at the beginning of the pseudotime in gene clusters 2 and 3, included those expressed specifically in acinar cells, such as Cela1, Cpa1, Reg1, Prss2, and Try4. Conversely, gene clusters 4, 5, 6, and 7, were downregulated at the beginning, but were highly expressed towards the end of the pseudotime. These four gene clusters (clusters 4–7) contained genes that can be linked to mature β-cell function38, such as Isl1, Prlr, NeuroD, urocortin 3 (Ucn3), chromogranin B (Chgb), G6pc2, and neuropeptide y (Npy) (Fig. 6e). To our surprise, gene cluster 2, which otherwise showed a strong acinar signature, also included two endocrine hormones Gcg and peptide YY (Pyy). Unlike the acinar genes, these hormones were not expressed at the beginning of the pseudotime but instead only during the transition phase between acinar and β-cells (Fig. 6e). Perhaps the most intriguing cluster was the gene cluster 1, which was absent in the acinar cells but displayed its highest expression during the acinar to β-cell transition phase (Fig. 6e). Gene cluster 1 included genes associated with immature β-cells, or β-cells with reduced function such as glutathione peroxidase 3 (Gpx3), and retinol binding protein 4 (Rbp4)38,39. This transitory cluster was further marked with the endocrine hormones Sst and Ppy expression. Moreover, consistent with the polyhormonal signature of cells in transition, we found MafB and Tspan8 expression, which are expressed in α- as well as immature β-cells, and Ppy-cell lineages40, respectively. The transcriptomic analysis show that in response to FAKi treatment, a subset of acinar cells (cluster 1 acinar cells) can convert into insulin-producing β-like cells. Furthermore, this transformation seems to entail a polyhormonal stage, where cells express glucagon, somatostatin, and pancreatic polypeptide.
Peri-islet acinar/β-hybrid cells are a putative source for ADIP cells
Identification of a subset of acinar cells with a gene expression profile typically associated with endocrine cells was an unexpected finding and required further validation. Since the islet isolation protocol used in our studies involves handpicking of the islets, we reasoned that the two acinar clusters described in Fig. 6 are likely peri-islet acinar cells which have been picked up together with islets during the isolation process. Therefore, to support the transcriptomic analysis, we looked for potential acinar/β-hybrid cells specifically among acinar cells surrounding the islets. First, we used the RNAscope technique to detect insulin transcripts in peri-islet acinar cells in wild type control mice (Fig. 7a, b). While the acinar cells in general were devoid of any detectable insulin transcripts (Fig. 7a), we could detect insulin mRNA in few peri-islet acinar cells (Fig. 7b). Next, we performed confocal microscopy for detection of insulin protein on pancreatic tissues obtained from FAKi-treated ElaTom mice and were able to find tomato-red cells with low insulin levels next to an islet (Fig. 7c). Notably, Tom+/Ins+ cells could not be detected in vehicle-treated ElaTom mice (Fig. 1k). Finally, we performed transmission electron microscopy (TEM) (Fig. 7d–f and Supplementary Fig. 9). β-cells are characterized on electron micrographs by mature β-granules, which are secretory granules with dense cores surrounded by wide non-stained halos41. In addition to these more abundant mature β-granules, β-cells also contain relatively few newly formed and immature granules that display cores with much thinner halos, or no halos at all41. In accordance with our transcriptomic data, where a cluster of acinar cells expressed both acinar and endocrine genes, we could find mature β-granules in a subset of peri-islet acinar cells in the mouse pancreas (Fig. 7d). We next performed TEM on the pancreas of FAKi-treated mice harvested either immediately (Fig. 7e) or 10 days after cessation of the treatment (Fig. 7f). Of note, we could no longer find peri-islet acinar cells that contained β-granules in the FAKi-treated cohorts (Supplementary Fig. 9). Instead, we were able to detect cells with β-granules (proportionally fewer mature β-granules than normal β-cells) in the periphery of islets, which appeared polyhormonal (Fig. 7e, f).
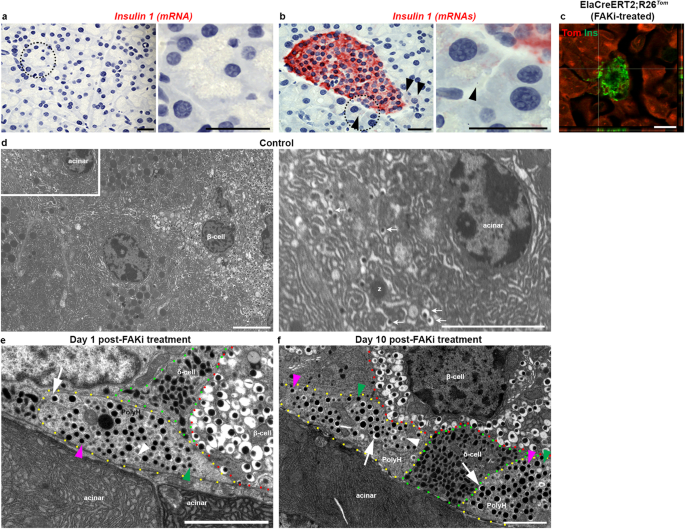
a, b Single-molecule in situ hybridization for detection of mouse insulin 1 in tele-islet acinar cells (a) or within islets and the peri-islet acinar cells (b) showing low levels of insulin 1 RNA in some peri-islet acinar cells. Right panels in (a, b) are higher magnifications of areas marked by dotted circles in the left panels. Arrowheads in (b) highlight peri-islet acinar cells with low insulin 1 expression. Scale bar = 20 μm, n = 3. c Confocal fluorescent Imaging of tamoxifen-induced ElaCreERT2,R26Tom mice treated with FAKi showing Tom+/insulin+ cells within the endocrine islets as well as in a peri-islet acinar cell. Scale bar in (a–c) = 20 μm. n = 5 mice from 3 independent experiments. d Transmission electron microscopy (TEM) of control mouse pancreas showing peri-islet acinar cells with β-granules (n = 5). Right panel in shows the Inset from (d) illustrating a peri-islet cell containing zymogen granules (z), and insulin granules (arrows). e, f TEM of mouse pancreas harvested 1 day (e) or 10 days (f) after completion of FAKi treatment showing a polyhormonal cell (outlined by yellow dotted line) that contains mature β-granule (white arrow), immature β-granule (white arrowhead), α-granule (pink arrowhead), and δ-granule (green arrowhead) (n = 3 per group). Scale bar = 6 μm.
Together, our transcriptomic and the subsequent validation analysis reinforce that FAKi treatment leads to conversion of acinar cells into β-like cells. Furthermore, it suggests that the peri-islet acinar cells are likely the primary cell of origin for this process.
Heterozygous deletion of Ptk2 in acinar cells leads to conversion of acinar cells into insulin-producing cells
We have previously reported that heterozygous deletion of Ptk2 in the developing pancreas using PdxCre results in the appearance of insulin+/amylase+ cells in the postnatal pancreas26. Given the observed effect of chemical inhibition of FAK on acinar cells, we next conditionally knocked out the gene encoding FAK in the acinar cells by generating ElaCreERT2;R26Tom;Fakfl/wt (ETFfl/wt) mice. Tamoxifen was administered to 12-week-old ElaCreERT2;R26Tom;Fakwt/wt (ETFwt/wt), and ETFfl/wt, mice via gavage feeding, and mice were sacrificed 1 or 3 months post-tamoxifen treatment. Successful Cre-recombinase activity was evident by the expression of tomato-red in the vast majority of acinar cells. Interestingly, 1 month after induction of Cre-recombinase activity we were able to find acinar-derived insulin-producing Tom+/Ins+ cells either as single cells or in small clusters scattered within the ETFfl/wt parenchyma (Fig. 8a). In addition, we could detect Tom+/Ins+ cells invading 33.2% ± 2.9 of the pre-existing islets in ETFfl/wt mice (Fig. 8b–d). This finding indicates that deletion of one allele of Ptk2 gene can transform a subset of acinar cells into insulin-producing cells. Our findings in the ETFfl/wt mice further supports that the reduction in FAK activity could trigger acinar to β-like cell conversion.
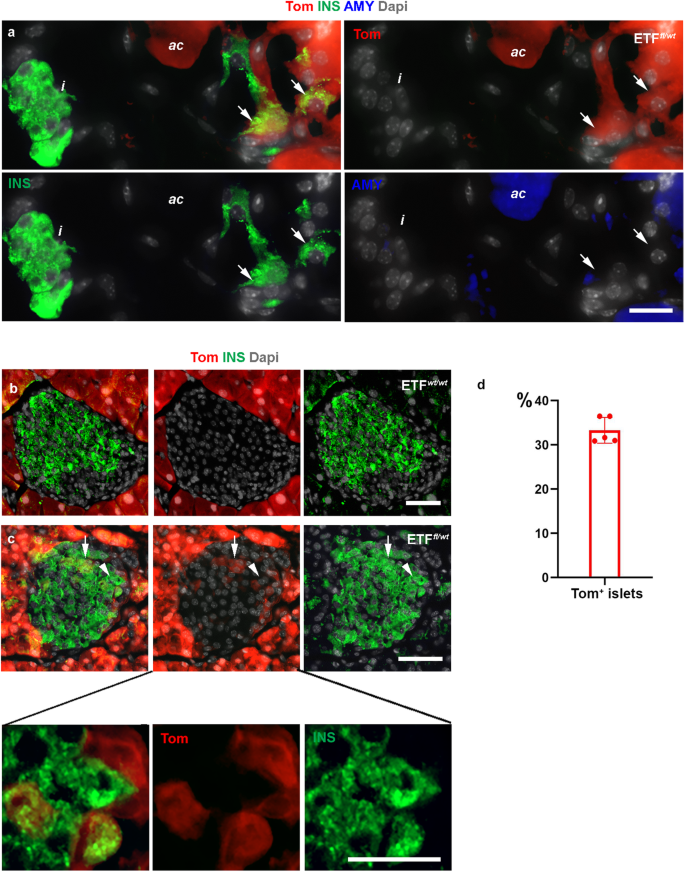
a Fluorescent imaging of Tomato in conjunction with insulin and amylase on tissues obtained from ElaCreERT2,R26Tom, Fakfl/wt (ETFfl/wt) mice 1 month post tamoxifen treatment showing Tom+/insulin+ cells outside the endocrine islets (arrows). b, c Fluorescent imaging of Tomato in conjunction with insulin and amylase on tissues obtained from ElaCreERT2,R26Tom, Fakwt/wt (ETFwt/wt) (b) or ETFfl/wt (c) mice 1 month post tamoxifen treatment showing Tom+/insulin+ cells within the endocrine islets of ETFfl/wt mice. d Quantification of islets containing Tom+ cells in the ETFfl/wt mice. Arrows in (a) show some Tom+/Ins+ cells outside the islets. Arrows in (c) show Tom+/Ins+ cells within the islets. The bottom panel in (c) is a higher magnification of the cells marked by arrowhead in (c). n = 5 mice from 3 independent experiments. Data in (d) is presented as mean ± SD. Scale bar = 20 μm. Source data are provided as a Source data file.
- SEO Powered Content & PR Distribution. Get Amplified Today.
- PlatoData.Network Vertical Generative Ai. Empower Yourself. Access Here.
- PlatoAiStream. Web3 Intelligence. Knowledge Amplified. Access Here.
- PlatoESG. Carbon, CleanTech, Energy, Environment, Solar, Waste Management. Access Here.
- PlatoHealth. Biotech and Clinical Trials Intelligence. Access Here.
- Source: https://www.nature.com/articles/s41467-024-47972-4