Morphological identification of bRG cells
First, we validated the identification of bRG cells based on morphological features. Human fetal pre-frontal cortex tissues from gestational weeks (GW) 14–18 were stained for phospho-Vimentin (p-VIM), which marks mitotic RG cells. Imaging within the SVZ revealed four different morphologies for these cells: unipolar with a single apical process, unipolar with a basal process, bipolar with both an apical and a basal process, and cells with no visible process (Fig. 1b,c). Bipolar bRG cells always had a major thick process and a minor thin process, which could be apical or basal (Fig. 1b, 2P). Overall, over 80% of p-VIM+ cells displayed at least one process, and 60% a basal process. All process-harbouring p-VIM+ cells were also SOX2+, while 20% of non-polarized p-VIM+ cells were negative for SOX2 (Fig. 1d).
We then explored bRG cell morphology in non-mitotic cells. We first validated bRG identity by showing that they were positive for HOPX, PTPRZ1, LIFR and SOX2 (bRG cells)15, but negative for EOMES (IPs), and HuC/D and NEUN (neurons) (Extended Data Fig. 1a–d). We note that a small subset of SOX2+/EOMES−/NEUN− may be oligodendrocyte progenitor cells (OPCs), which begin to appear around these stages. Fetal brain slices were infected with GFP-expressing retroviruses (RVs) and stained for SOX2, EOMES and NEUN (Fig. 1e and Extended Data Fig. 1e,f). This analysis confirmed that over 80% of SOX2+/EOMES−/NEUN− cells displayed apical and/or basal processes, while 20% were non-polarized (Fig. 1f,g). Moreover, the majority of process-harbouring cells were SOX2+/EOMES−/NEUN−, and around 40% of non-polarized cells were SOX2+/EOMES−/NEUN− (Fig. 1h). Therefore, human fetal bRG cells largely display elongated processes, though 20% are non-polarized.
Next, we performed live imaging of GFP-expressing cells in fetal slices, focusing on elongated bRG cells. Dividing cells had the same morphology as previously described in fixed samples (Extended Data Fig. 1g). The majority of process-harbouring cells performed MST, though 25% performed stationary divisions (Fig. 1i,j and Supplementary Video 1). MST could occur in the apical direction or the basal direction, depending on their shape. When bRG cells had two processes, MST occurred in the dominant (thick) process (Fig. 1j).
Finally, week 8–10 cortical organoids were infected with RV and stained for the cell fate marker SOX2, EOMES and NEUN, which revealed abundant SOX2+ bRG cells above the ventricular zone (Fig. 1k and Extended Data Fig. 1h,i). As in fetal tissue, the majority of SOX2+/EOMES−/NEUN− cells displayed one or two elongated processes, and 20% were non-polarized (Fig. 1l,m). The vast majority of process-harbouring cells, and around 40% of non-polarized cells, were SOX2+/EOMES−/NEUN− (Fig. 1n). Live imaging confirmed these morphologies and indicated that the majority of bRG cells performed MST (Fig. 1o and Extended Data Fig. 1j). Therefore, the majority of human bRG cells can be identified in live samples based on their elongated morphology and ability to divide, which is conserved between fetal tissue and organoids.
A correlative imaging method to identify cell fate decisions
Next, we developed a method to identify the fate acquired by daughter cells following progenitor cell division in cerebral organoids. We established a correlative imaging method consisting of live imaging GFP-expressing progenitors and, following fixation and immunostaining, assigning a fate to the live-imaged cells (Fig. 2a). We developed a computer-assisted method to automate the localization of the videos in the immunofluorescence images (Supplementary Information). In brief, RV-infected tissue slices are live imaged for 48 hours and, at the end, 4X brightfield images of the slices containing positional information from each video are generated (Fig. 2b and Supplementary Video 2). Slices are then fixed, stained for the cell fate markers SOX2, EOMES and NEUN, and tile scan images of the entire slices are acquired. Both live and fixed images are automatically segmented, paired, flipped and aligned. The position of each video is thereby obtained on the immunostained images, leading to the identification of matching cells between the live and fixed samples (Fig. 2b). Using this method, dividing bRG cells can be live imaged and the fate of the two daughter cells identified (Fig. 2c and Supplementary Video 3). Daughter cell fate was analysed on average 30 hours after division. We noted that when a daughter cell differentiated (for example, into an EOMES+ IP), it often retained some expression of the mother cell fate marker (SOX2), irrespective of the division mode (Fig. 2c). Expression of a novel fate marker was on the contrary very rapid, with EOMES or NEUN being detected in daughter cells that had divided 1–2 hours before the end of the movie (Extended Data Fig. 2a). Moreover, putative IPs and migrating neurons could be live imaged and cell fate analysed at the last timepoint (Fig. 2d,e and Supplementary Videos 4 and 5). Therefore, this semi-automated correlative microscopy method allows the identification of cell fate markers in live-imaged cerebral organoids, in a highly reproducible and quantitative manner.
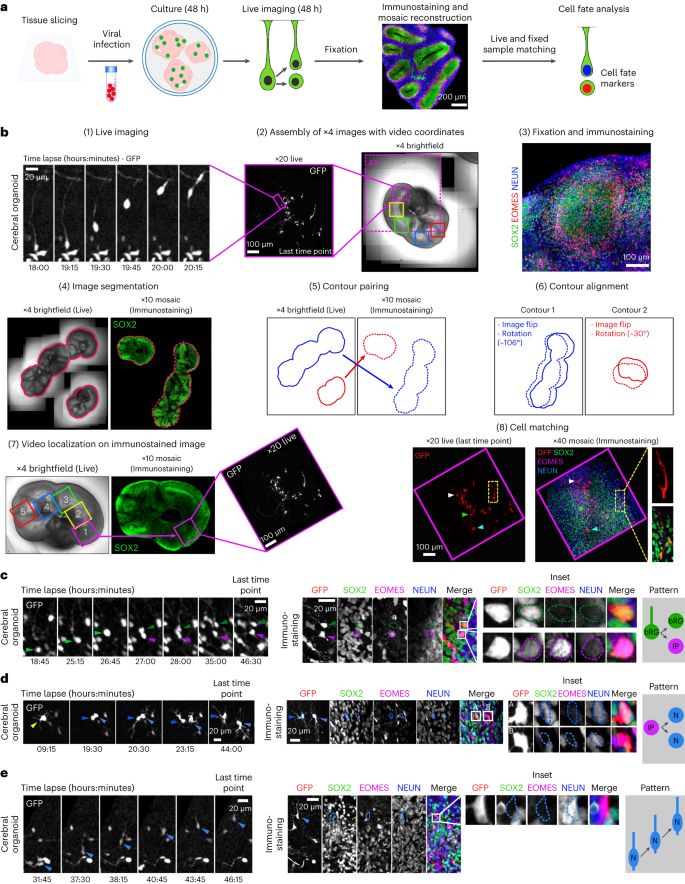
a, Schematic representation of correlative microscopy pipeline. b, Step-by-step protocol for semi-automated correlative microscopy. (1) bRG cells are live imaged at 20X for 48 hours. (2) 4X brightfield images containing the video coordinates are assembled. (3) Organoid slices are fixed, immunostained for SOX2, EOMES and NEUN, and imaged. (4) Images are automatically segmented to outline slices from live and fixed samples. (5) Slice contours are automatically paired based on shape and area and (6) aligned (including a horizontal flip if needed). (7) Video fields of view are automatically annotated on the immunostaining images. (8) Regions of interest are re-imaged at higher resolution (×40) and cells from live and fixed samples are manually matched. c, Live/fixed correlative analysis of a dividing bRG cell generating a self-renewing bRG daughter and a differentiating IP daughter. d, Live/fixed correlative analysis of a dividing IP cell generating two neuronal daughters. e, Live/fixed correlative analysis of a migrating neuron. All images are representative examples of experiments performed at least three times independently (N = 1,101 bRG cells).
A map of cell fate decisions in cerebral organoids
To generate a map of progenitor division modes, we analysed 1,101 dividing bRG cells, in weeks 7 to 9 and 13 to 15 cerebral organoids, prior to the start of gliogenesis18,20 (Fig. 3a, Extended Data Fig. 2b,c and Supplementary Videos 6–8). We report the relative probabilities, through time, of all possible division modes (Fig. 3b for week 8, and Extended Data Fig. 3 for all other stages). Notably, we never observe asymmetrically dividing bRG cells generating one IP and one neuron. We first quantified the fraction of proliferative (amplifying) divisions (leading to two SOX2+ cells) versus neurogenic divisions (leading to at least one differentiating cell, EOMES+ or NEUN+). This analysis revealed a high rate of bRG cell amplification, which increases between weeks 7 and 9, and decreases between weeks 13 and 15 (Fig. 3c). Within neurogenic divisions, bRG cells performed symmetric self-consuming divisions, leading to two differentiating cells, or asymmetric self-renewing divisions, leading to one bRG cell and one differentiating cell. Self-consuming divisions decreased between weeks 7 and 9 and increased between weeks 13 and 15 (Fig. 3d). In both types of neurogenic divisions (asymmetric or symmetric), bRG cells could divide directly into neurons or indirectly, via the generation of IPs. Strikingly, we observed that direct neurogenic divisions dominated in human bRG cells, indicating that the generation of IPs is not a systematic differentiation trajectory in these cells (Fig. 3e). These divisions decreased between weeks 7 and 9 and increased between weeks 13 and 15 (Fig. 3e).
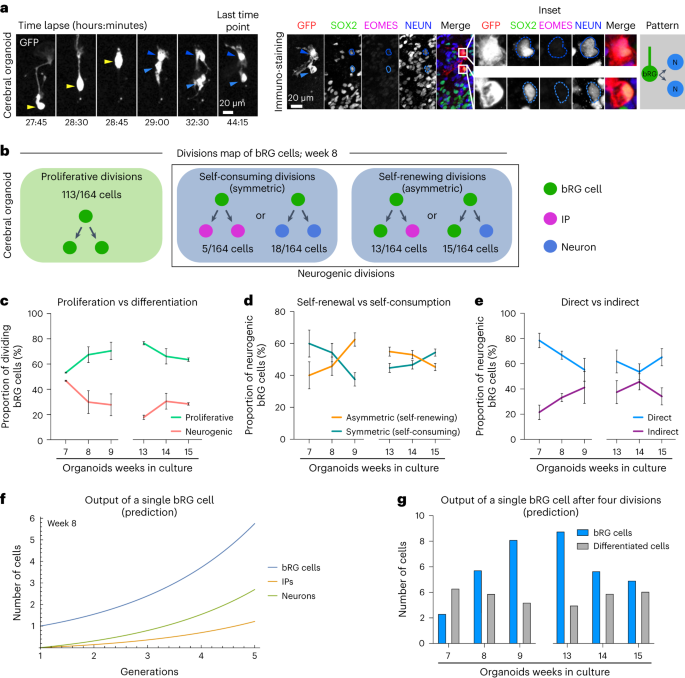
a, Live/fixed correlative analysis of a dividing bRG cell generating two neuronal daughters. b, Summary of all division patterns identified in bRG cells in week 8 cerebral organoids (N = 164 bRG cells). c, Proportion of proliferative versus neurogenic divisions of bRG cells in week 7–9 and 13–15 cerebral organoids. d, Proportion of asymmetric (self-renewing) versus symmetric (self-consuming) neurogenic divisions of bRG cells in week 7–9 and 13–15 cerebral organoids. e, Proportion of direct versus indirect neurogenic divisions of bRG cells in week 7–9 and 13–15 cerebral organoids. c–e, Week 7, N = 114 bRG cells and two independent live-imaged slices; week 8, N = 164 bRG cells and two independent live-maged slices; week 9, N = 106 bRG cells and two independent live-imaged slices; week 13, N = 206 bRG cells and two independent live-imaged slices; week 14, N = 254 bRG cells and three independent live-imaged slices; week 15, N = 257 bRG cells and two independent live-imaged slices. f, Simulation of the output of a single bRG cell after one to five generations, based on week 8 fate decision probabilities. g, Simulation of the output of a single bRG cell after four divisions (five generations) in week 7–9 and 13–15 cerebral organoids. All images are representative examples of experiments performed in at least two independent fetal brains. Data are presented as mean +/− s.d.
Next, we modelled how these different modes of progenitor divisions affected their final output (Methods). At each stage, we predicted the average number of bRG cells, IPs and neurons generated from a single bRG cell, after four rounds of division, which corresponds to approximately 1 week of development (Fig. 3f for week 8 and Extended Data Fig. 4a for all other stages). At week 8, a single bRG cell leads on average to the generation of 5.75 bRG cells, 1.21 IPs and 2.69 neurons, highlighting their strong self-amplification potential (Fig. 3f). Modelling bRG output through time reveals that bRG amplification increases from week 7 to 9 and decreases from 13 to 15 (Fig. 3g). Strikingly, this occurs at a relatively constant neurogenic rate indicating that, at the single-progenitor level, self-amplification varies but not the number of differentiated cells produced. Finally, we tested how variations in cell fate decision probabilities would affect their output. Reducing the rate of proliferative divisions by 20% in favour of asymmetric self-renewing indirect divisions (one bRG and one IP)—the dominant division mode in mouse aRG cells at neurogenesis onset—reduced the total production of bRG cells by 31% after only four divisions (Extended Data Fig. 4b). Overall, this analysis indicates that bRG cells are highly proliferative and undergo important self-amplification. Upon differentiation, they undergo frequent self-consuming terminal divisions, as well as abundant direct neurogenesis.
A map of cell fate decisions in human fetal tissue
Next, we adapted this correlative imaging method to human frontal cortex samples at GW 14–18. Although slices were substantially larger, the macro proved to be equally efficient at automatically identifying and aligning corresponding regions between the live and fixed datasets, indicating that it can be used for any type of tissues (Extended Data Fig. 5a,b). We analysed the division modes of 335 human fetal bRG cells, following 48-hour live imaging (Fig. 4a, Extended Data Fig. 5c and Supplementary Videos 9 and 10). We confirmed the rapid expression of differentiation markers following cell division (Extended Data Fig. 5d). As in cerebral organoids, the majority of bRG cells performed symmetric proliferative division, generating two SOX2+ daughters (Fig. 4b,c and Extended Data Fig. 5e). At GW 18, we noted a decrease in neurogenic division in favour of gliogenic divisions, indicating that the switch begins around this developmental time. Within neurogenic divisions, we again observed abundant symmetric self-consuming divisions that remained relatively constant (around 32% of all neurogenic divisions; Fig. 4b,d Extended Data Fig. 5e). Finally, we confirmed that direct neurogenic divisions are an abundant bRG cell division mode, which again remained stable from GW 14 to 18 (over 40% of all neurogenic divisions; Fig. 4b,e Extended Data Fig. 5e). We tested whether these cell fate decisions varied depending on bRG cell mitotic behaviours (apical MST, basal MST or static division) but found no clear effect of this parameter (Extended Data Fig. 5f). Overall, we find a strong conservation of division modes between human fetal tissue and cerebral organoids, with the coexistence of asymmetric self-renewing progenitors—as classically observed in mouse aRG cells—together with self-amplifying and self-consuming neurogenic progenitors, which represents an alternative route for neuronal generation.
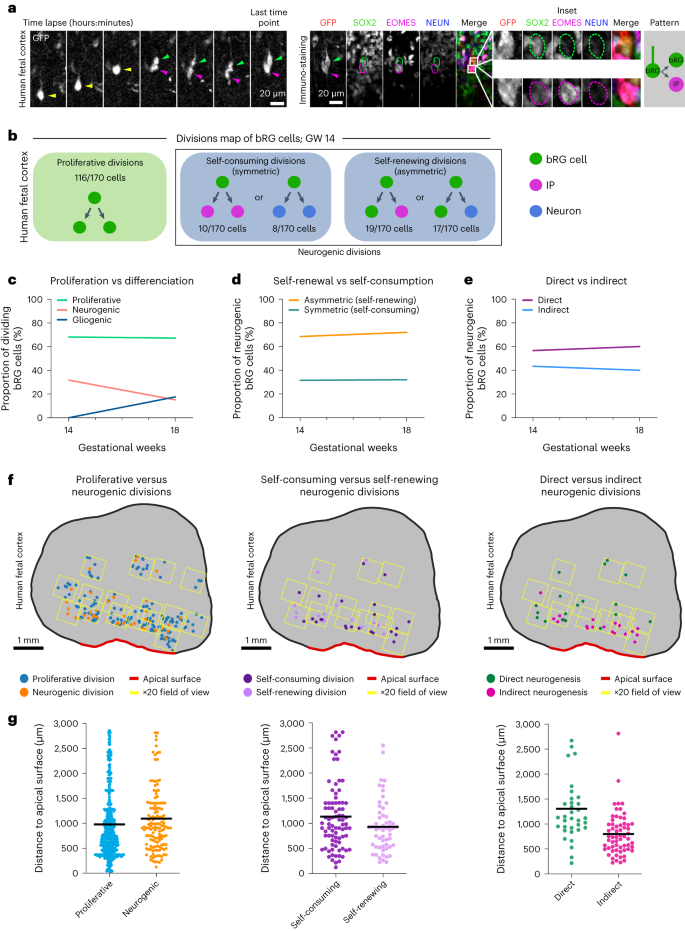
a, Live/fixed correlative analysis of a dividing bRG cell generating a bRG daughter and an IP daughter. b, Summary of all division patterns identified in bRG cells at GW 14 (N = 170 bRG cells) human frontal cortex. c, Proportion of proliferative versus neurogenic divisions of bRG cells in GW 14 and 18 human fetal tissue. d, Proportion of asymmetric (self-renewing) versus symmetric (self-consuming) neurogenic divisions of bRG cells in GW 14 and 18 human fetal tissue. e, Proportion of direct versus indirect neurogenic divisions of bRG cells in GW 14 and 18 human fetal tissue. f, Spatial distribution of proliferative versus neurogenic (left), self-consuming versus asymmetric self-renewing (middle) and direct versus indirect neurogenic divisions (right) in GW 17 human frontal cortex. g, Quantification of proliferative versus neurogenic (left), self-consuming versus asymmetric self-renewing (middle) and direct versus indirect neurogenic divisions (right) in GW 17–18 human frontal cortex (N = 355 cells for GW 17 and 172 cells for GW 18). Data are presented as mean values. Images are representative examples of experiments performed in at least two independent fetal brains.
Increased direct neurogenesis in the basal OSVZ
The human OSVZ is extremely large (approximately 3 mm at GW 17) and bRG cells may, therefore, be exposed to different microenvironments depending on their position, which may influence their division modes. Moreover, bRG cells progressively migrate through the SVZ and have a different history depending on their position. We, therefore, explored whether bRG division modes vary along the apico-basal axis in the human fetal brain. To test this, we adapted the above-described method to automatically record the position of each dividing bRG cell within the tissue. The position of bRG cells along the apico-basal axis only had a minor effect on symmetric proliferative versus neurogenic division (Fig. 4f,g). Similarly, the rate of symmetric self-consuming versus asymmetric self-renewing divisions was not significantly different (Fig. 4f,g). However, we observed a clear difference in the rates of direct versus indirect neurogenesis, depending on the position in the tissue. Indeed, indirect neurogenic divisions (EOMES+ cells) occurred on average 800 μm from the apical surface, while direct neurogenic divisions (NEUN+ cells) occurred much more basally, 1,306 μm from the apical surface (Fig. 4f,g). These experiments could not be performed in cerebral organoids, as they display a much smaller OSVZ. Overall, they demonstrate that dividing bRG cells undergo more direct neurogenic divisions when located in the basal part of the fetal OSVZ.
Basal-process-independent self-renewal
The mechanism of bRG cell asymmetric division remains unknown. In mouse aRG cells, growing evidence supports the role of basal process inheritance in stem cell fate maintenance30,31,32. We, therefore, used our correlative imaging method to test whether process inheritance correlates with bRG fate maintenance upon asymmetric division of human bRG cells. We first live imaged 79 asymmetrically dividing bRG cells (one bRG daughter and one differentiating daughter) within week 8–10 cerebral organoids, and analysed daughter cell fate depending on process inheritance (Fig. 5a,b and Supplementary Videos 11 and 12). In half of these cells, process-inheriting daughters maintained a bRG fate but in the other half, process-inheriting daughters differentiated (Fig. 5c,d). This was the case whether the asymmetric divisions generated an IP or a neuron directly. We next performed a similar analysis in GW 14–17 human fetal brain tissue. We analysed 82 asymmetrically dividing bRG cells and again found no correlation between basal process inheritance and bRG cell fate (Fig. 5e,f and Supplementary Videos 13 and 14): 52.4% of basal-process-inheriting daughters remained bRG cells, and 47.6% differentiated (Fig. 5g,h). In support of these results, SOX2+ daughter cells that did not inherit a process could be observed to regrow one after division (Extended Data Fig. 6 and Supplementary Video 15). Therefore, in human bRG cells, the basal process appears to be a consequence, rather than a cause, of bRG cell fate upon asymmetric division. Its presence during interphase may however participate in long-term bRG fate maintenance.
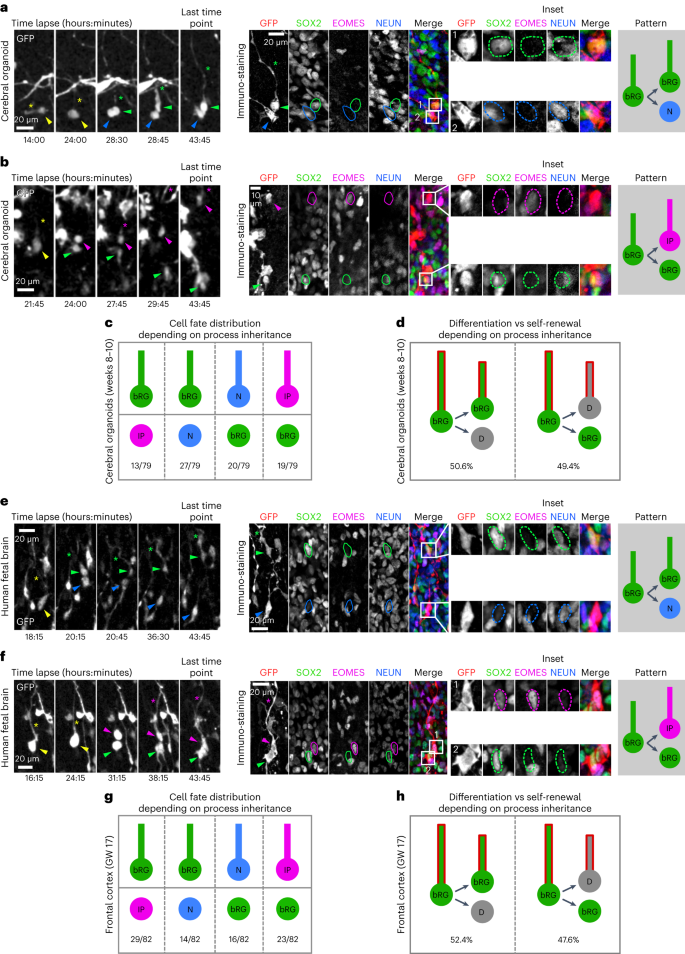
a, Live/fixed correlative analysis of basal process inheritance in a dividing bRG cell generating a process-inheriting bRG daughter and neuron, within a cerebral organoid. b, Live/fixed correlative analysis of basal process inheritance in a dividing bRG cell generating a process-inheriting IP daughter and a bRG daughter, within a cerebral organoid. c, Distribution of cell fates depending on process inheritance upon asymmetric cell division in week 8–10 cerebral organoids (N = 79 asymmetrically dividing cells from five experiments). d, Proportion of self-renewing versus differentiating daughter cells upon asymmetric division, depending on process inheritance in week 8–10 cerebral organoids (N = 79 asymmetrically dividing cells from five experiments). e, Live/fixed correlative analysis of basal process inheritance in a dividing bRG cell generating a process-inheriting bRG daughter and a neuron, within fetal frontal cortex. f, Live/fixed correlative analysis of basal process inheritance in a dividing bRG cell generating a process-inheriting IP daughter and a bRG daughter, within fetal frontal cortex. g, Distribution of cell fates depending on process inheritance upon asymmetric cell division in GW 14–17 human frontal cortex (N = 82 asymmetrically dividing cells from two experiments). h, Proportion of self-renewing versus differentiating daughter cells upon asymmetric division, depending on process inheritance in GW 14–17 human frontal cortex (N = 82 asymmetrically dividing cells from two experiments). All images are representative examples of experiments performed in at least three independent organoid batches and two independent fetal brains. N, neuron; D, differentiating daughter.
Basal-process-independent Notch activation
In aRG cells, it was proposed that the basal process acts as an antenna for the reception of Notch signalling from the surrounding cells, in particular neurons31,32. First, we validated the role of Notch signalling for bRG cell self-renewal in cerebral organoids4. Following retroviral infection to deliver GFP, slices were treated with the γ-secretase inhibitor DAPT—which blocks Notch signalling—for 2 days. Quantification revealed a depletion of GFP+ bRG cells and a corresponding increase of IPs (Extended Data Fig. 6a,b). The neuronal population was not affected in the timeframe of the experiment, indicating that indirect neurogenesis is the default differentiation pathway in the absence of Notch signalling. Next, we monitored Notch signalling in bRG daughter cells, depending on process inheritance. As a readout, we analysed the expression of its downstream target HES1. In cerebral organoids, HES1 was strongly expressed in the ventricular zone where aRG cells are highly abundant and in a sparse manner in the SVZ, reflecting the SOX2+ bRG cell distribution (Fig. 6a). Week 8–11 organoid slices were live imaged for 48 hours, stained for HES1, EOMES and NEUN, and processed through the correlative imaging protocol. Out of 276 bRG cell, 186 symmetric proliferative divisions, 53 asymmetric divisions and 37 symmetric self-consuming divisions (Fig. 6b). Consistent with its oscillatory behaviour in RG cells33, HES1 was only detected in a subset of bRG cells, whether these cells were generated following symmetric or asymmetric divisions (Fig. 6c,d and Supplementary Video 16). As expected, HES1 was never detected in differentiating cells (N = 90 cells; Fig. 6d). Out of 276 live-imaged bRG cells, we identified 16 cells that divided asymmetrically, with detectable HES1 expression in daughter cells (Fig. 6d). HES1 was always detected in the non-differentiating daughter (EOMES− and NEUN−), supporting preferential Notch signalling in the self-renewing bRG daughter upon asymmetric division (Fig. 6d). However, we found no correlation between HES1 expression and process inheritance: 8 HES1-expressing cells inherited the basal process and 8 did not (Fig. 6e,f and Supplementary Video 17). These data further indicate that process inheritance does not correlate with bRG cell fate, and that the basal process is not involved in differential Notch signalling upon asymmetric division in bRG cells, as it is believed to be in aRG cells.
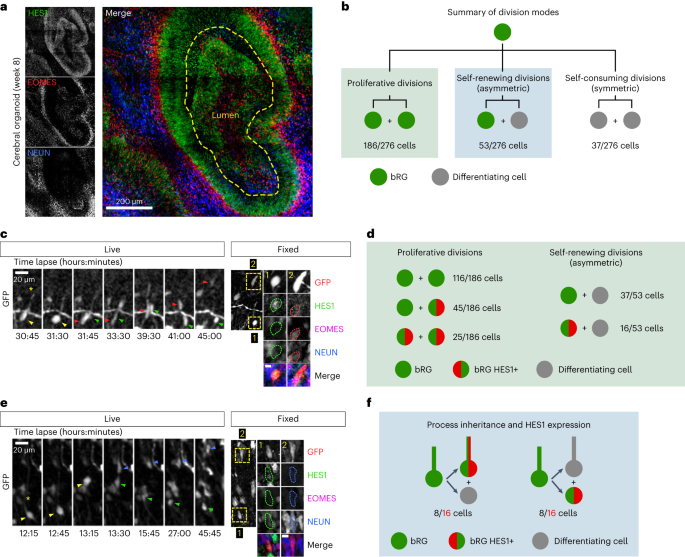
a, HES1, EOMES and NEUN immunostaining in human cerebral organoid at week 8. b, Distribution of division modes identified in bRG cells within week 8–11 cerebral organoids. bRG daughter (EOMES− and NEUN−), differentiating daughter (EOMES+ or NEUN+) (N = 276 bRG cells from three batches of organoids). c, Live/fixed correlative analysis of an asymmetrically dividing bRG cell revealing HES1 expression specifically in self-renewing daughter (EOMES− and NEUN−). d, Summary of HES1 expression in daughter cells depending on division modes (N = 239 cells from three batches of organoids). e, Live/fixed correlative analysis in asymmetrically dividing bRG cells revealing lack of correlation between HES1 expression and basal process inheritance. f, Summary of HES1 expression depending on process inheritance in asymmetrically dividing bRG cells, within week 8–11 cerebral organoids (N = 16 cells from three batches of organoids). All images are representative examples of experiments performed in at least three independent organoid batches.
- SEO Powered Content & PR Distribution. Get Amplified Today.
- PlatoData.Network Vertical Generative Ai. Empower Yourself. Access Here.
- PlatoAiStream. Web3 Intelligence. Knowledge Amplified. Access Here.
- PlatoESG. Carbon, CleanTech, Energy, Environment, Solar, Waste Management. Access Here.
- PlatoHealth. Biotech and Clinical Trials Intelligence. Access Here.
- Source: https://www.nature.com/articles/s41556-024-01393-z