Low transcriptome diversity within cell line development workflow
We were interested in the cellular population diversity at different stages of an isogenic TI CLD platform22. This platform is based on simultaneous dual-plasmid RMCE-mediated targeted integration into a single genomic locus thus generating isogenic cells, which theoretically excludes variability derived from position effects, copy number and epigenetic silencing (Fig. 1a).
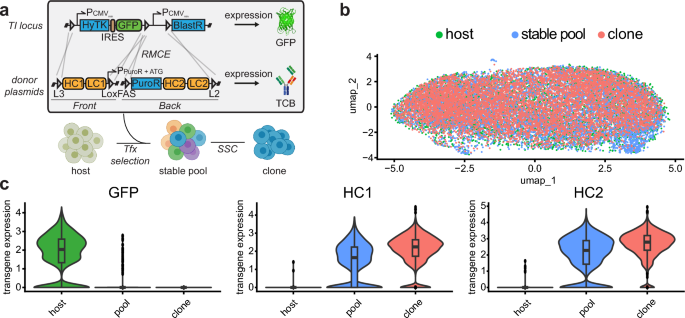
CHO cells are remarkably similar across the CLD process (a) Dual plasmid (front and back plasmid) integration strategy via recombinase-mediated-cassette-exchange (RMCE) into a CHO host cell line containing a landing pad (with lox acceptor sites: L3, LoxFAS, L2). Host cells express GFP and sensitive to FIAU due to thymidine kinase expression. Single copy targeted integration is enforced by negative selection (FIAU) and positive selection (puromycin). The start codon for the puromycin CDS is located on the front plasmid. (b) Overlay of single-cell transcriptome profiles from host cells containing the RMCE landing pad (expressing GFP), a stable expression pool, and clonal cell line originating from the expression pool. (c) Average levels of transgene expression in single-cell transcriptome profiles of host, stable pool, and clonal cells. UMAP, uniform manifold approximation and projection; HCL, host cell line; Pool, stable expression pool; Clone, stable expression clonal cell line.
We harvested cells at three different stages of the CLD process: the GFP-expressing host cell (“host”), a stable bispecific antibody expression pool with a distinct gene configuration in our TI platform (“stable pool”), and a final producer clone (“clone”) that has been derived from the same stable pool. Each population was transcriptionally profiled on single-cell level using scRNAseq (Chromium Single Cell 3’ solution) and, after merging and batch correction, we observed no relevant cell population substructures (Fig. 1b). We hypothesized that variability in the expression of genes encoding the recombinant protein is insufficient to contribute to significant global transcriptomic differences during the CLD process.
We therefore specifically analyzed GFP expression within the host population and noticed some degree of variability with a fraction of cells showing no GFP expression (Fig. 1c, left panel). This variability was more pronounced in stable pools where a substantial fraction of cells showed no detectable expression of heavy chain 1 (HC1) and 2 (HC2, Fig. 1c, middle and right panel). In contrast, we observed a substantially smaller variability in HC1 and HC2 expression in a monoclonal cell population. This population had underwent recent single cell cloning and had been pre-selected based on high production performance.
The data indicate that while the overall cellular gene expression is remarkably similar across transfection, stable pool selection, and single cell cloning, transgene expression remains variable in host cells and stable expression pools.
Single-copy targeted barcode integration in stable CHO producer cells
To shed light on the source of transgene expression variety we aimed to implement a genetic lineage tracing method within our CLD workflow. To achieve this, we developed an exhaustive single-copy genetic barcode labeling method, implemented within a state-of-the-art CLD workflow applicable for therapeutic protein production. Most barcode delivery methods (retroviral-based) lead to an inhomogeneous labeling of the population with possibly no or multiple barcode integration per individual cell clone. In contrast, the implementation of a barcode within an isogenic dual-plasmid RMCE-mediated targeted integration into a single genomic locus, allows for the selective expansion of clones with mainly single-copy integration22. Notably, the start codon of the puromycin resistance gene is placed on the “Front” expression vector, ensuring that only cells with in-frame- and targeted-integration survive the selection procedure. Additionally, all cells with off-target integration of the expression plasmids do not lose the Thymidine kinase selection marker that is encoded in the landing pad of the host cell line. Overall, only clonal cells undergoing correct on-target recombination between the three LoxP sites become resistant to puromycin and survive in the presence of FIAU. This stringent selection process substantially increases the proportion of single-copy targeted integration survivors.
A N15 barcode region was included into one of two plasmids (“Back”) adjacent to the lox site outside of the coding sequence (Fig. 2a). The N15 region is placed in close proximity to the genomic area outside the landing pad, allowing discrimination between on-target and off-target integration events by positioning of the primer binding sites during amplicon deep sequencing. To additionally incorporate cell line metadata, we added 10 fixed positions to the N15 region and devised a nucleotide representation of year, number of CLD (in the respective year), used host cell line and expressed biotherapeutic molecule (Fig. 2b). We validated the plasmid library by amplicon deep sequencing and observed a near uniform barcode representation with homogenous nucleotide composition at each position (Supplementary Fig. 1a,b). This provides a minimum diversity of > 2 × 10⁷, enough to label 105 cells with < 0.3% collision probability (Supplementary Fig. 1c,d).
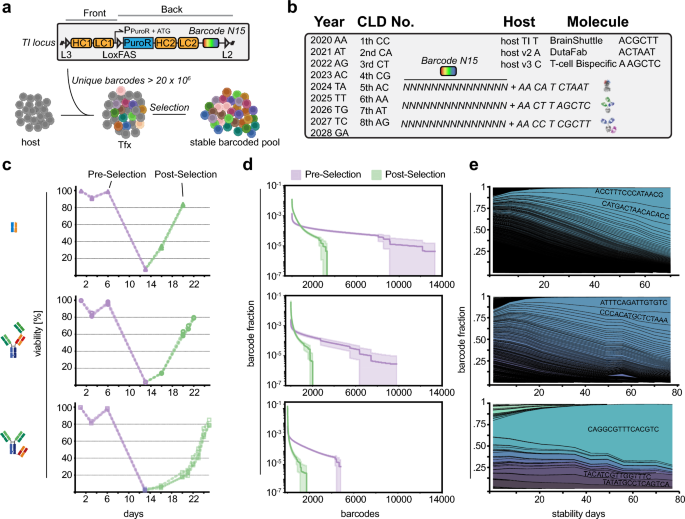
Single-copy targeted barcode integration in stable CHO producer pools (a) Notably, the barcode library (N15) is placed adjacent to the L2 lox site to discriminate on- and off-target integration events. (b) Barcode sequence design used in this project. Total barcodes combines a randomized N15 region with 10 fixed positions for cell line meta-data. (c) CHO host cells were transfected with Front and Back plasmid containing the barcode library at day 0. Selection started at day 6 and continued until cell pool recovery (cell viability > 80%). Note the different cell pool recovery kinetics. (n = 3) (d) Barcodes reflect the amount of successful RMCE events and thus the pool diversity. Note the substantially lower pool diversity at the post-selection time point (green) as compared to the pre-selection time point (purple). The error bands represent the standard deviations of biological replicates (n = 3) (e) Pool composition drifts during prolonged cultivation and diversity decreases substantially within 80 days. Notably, the effect is more pronounced in case the initial pool diversity is lower. Averaged fraction values of biological replicates (n = 3). (f) Retrospective analysis of barcode composition found after single cell cloning and random sampling for 96 clones (ambr15). Width of line indicates relative fraction of cells carrying a unique barcode in the cellular population.
To investigate a representative repertoire of therapeutic proteins produced in CHO cell lines, we selected three different molecules based on the observed viability loss of the cell population during stable pool selection: 5–10%: M1 DutaFab, 1–5%: M2 TCB, < 1%: M3 BS-Fusion (Fig. 2c). We analyzed the clonal diversity of respective CHO cell pools expressing M1-M3 during stable pool selection at two time points: (i) pre-selection at day five post-transfection and (ii) post-selection at the day the cell population reached ~ 80%viability.
We transfected 4.5 × 10⁶ cells of the host cell line with respective antibody-encoding TI and Cre recombinase-encoding plasmids by electroporation at day 0 followed by a recovery phase without selection pressure. Selection pressure (+ Puromycin & FIAU) was started subsequently at day 5 (“Pre-Selection”) and lowest cell viability was reached at day 13 for all CHO pools. The recovery time until reaching ~ 80% cell viability differed dramatically depending on the complexity of the encoded molecule and associated gene configuration (M1: day 20, M2: day 22, M3: day 26) (Fig. 2c). This observation was consistent with our previous experience showing that the speed of CHO pool recovery during resistance marker-based stable cell pool selection is linked to the complexity of molecules encoded on the expression plasmids (unpublished observation). DutaFab (M1) expressing cell lines recover quickly, potentially because of their overall smaller size and corresponding smaller plasmid sizes. In contrast, TCBs (M2) and BS-Fusion (M3) molecules are complex multi-domain fusion molecules, which makes them increasingly difficult-to-express for CHO biofactories28. Interestingly, pool composition was approximately 3.5–4.0 times higher at the pre-selection time point (M1: Ø 10060, M2: Ø 6355, M3: Ø 4560) as compared to post-selection across molecules, indicative of rapid clone loss during the stringent selection process (Fig. 2d). Recovered stable pools consisted of a low total amount of barcodes (M1: Ø 2884, M2: Ø 1691, M3: Ø 1158) with a skewed population distribution already at post-selection. Notably, in M3 the most abundant barcode encompassed 10% of the population at the post-selection time point.
Next, we analyzed population dynamics of the three M1-M3-expressing stable CHO pools for a total of 11 weeks with selection pressure. In all three biological replicates, the number of barcodes detected in each population decreased substantially with loss of 80–87% of barcode variants over the observed time course (Fig. 2e). This indicates that stable CHO pools display rapid clonal dynamics under standardized cell cultivation conditions.
Overall, these experiments demonstrate that CHO producer pools generated by TI display a low diversity, which further depends on the expressed molecules, and undergo rapid population skewing towards dominant clones.
Improving efficiency of limited dilution and alternative proof-of-monoclonality by genetic barcoding
Motivated by the success of using cellular barcoding for monitoring CHO producer pools, we next explored the use of barcoding for assurance of monoclonality. To limit heterogeneity of cell banks and ensure consistent product quality, proof of monoclonality has become an important measure of regulatory-approved antibody manufacturing processes. Genetic barcoding offers the inclusion of a cell-intrinsic nucleotide marker which can be repetitively used to validate monoclonality and identity at any given stage and time of a given antibody producer cell clone throughout the production process. Similar approaches based on NGS-analysis of single nucleotide variants or targeted locus amplification products have been published recently29,30. However, we speculated that the assessment of genetic barcodes at a pre-defined stable locus offers higher sensitivity, i.e. detection of minor subpopulations below 1%, and is not subject to change during cultivation of clonal cell lines.
We cross-validated two monoclonal cell lines by image detection at single cell cloning stage and subsequent Sanger sequencing of barcodes at day 18 (Supplementary Fig. 2a–c). To test the sensitivity of barcode detection within our workflow we mixed the two validated barcoded cell clones at different ratios and measured barcode occurrence via deep sequencing (> 36 × 106 reads). To discriminate genuine barcodes from background introduced by sequencing errors, we included an unbiased knee-point filter method and detected clonal cross-contamination reliable in mixtures at ratios of 1:10–1:1000 (Supplementary Fig. 3a). In addition, we could detect 3, 5, and 17 different monoclonal cell lines in a defined pool (Supplementary Fig. 3b).
Monoclonality is traditionally validated by microscopy after limited dilution to achieve a single cell per well based on Poisson distribution31. However, limited dilution (LD) is inherently inefficient with most wells either empty or containing more than one cell. To determine if genetic barcoding can improve the single cell cloning process, we compared the number of clones detected with traditional image detection and manual inspection with the amount of clones detected by cellular barcoding. First, we mimicked a traditional single cell cloning process by limited dilution using a Poisson parameter λ = 0.6 (Fig. 3a). We found that for cells, which were classified as monoclonal by traditional image detection, barcoding confirmed the presence of a single barcode in all observed cases (Fig. 3b). Notably, image detection overestimated the number of clones per well by ~ 60% as compared to barcode detection (Fig. 3b). We hypothesized that the number of clones is overestimated by image detection because of poor outgrowth rates during limited dilution.
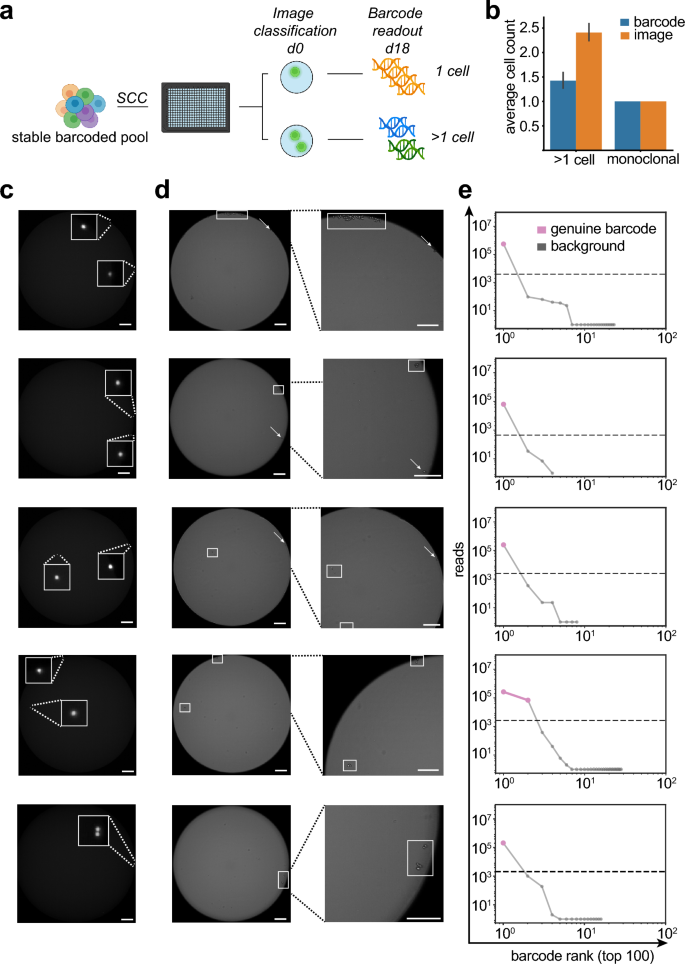
Cellular barcoding can reliably detect clonal status of cell lines during single-cell cloning (a) Stable barcoded expression pools were single cell cloned by limited dilution in 384 well plates. Monoclonality was assessed by fluorescent imaging directly after seeding at d0 and barcodes were detected via amplicon deep sequencing at day 18. Wells were grouped based on the initial image based classification in either wells with 1 cell or > 1 cell. (b) Bar graphs depicting average number of barcodes detected by the barcoding method as compared to an automated image analysis method. Samples are grouped according to initial image classification to wells containing only 1 cell and > 1 cell, n = 96. Error bars indicate SD. (c) Fluorescence imaging at d0 directly after seeding of barcoded stable pools in 384 well plates. This image was used for initial classification of wells. (d) Bright-field imaging at day 2 after single-cell cloning (left panel) and magnified view on the cell colonies (right panel). Cell colonies with visible division are marked with a rectangle, cells without visible division are marked by an arrow. Size bar indicates 200 µm. (e) The number of barcodes were detected via amplicon deep sequencing and unique top 100 barcodes are plotted. Dashed line indicates the minimum read count cutoff to discriminate erroneous barcodes from genuine barcodes using an unbiased knee point detection algorithm. (c) Initial fluorescent imaging directly after seeding cells into 384-well plates during single-cell cloning. Cells are marked by an arrow (d).
Therefore, for wells with 2 cells, we inspected consecutive images of wells on d2 after seeding. Notably, we frequently observed only 1 cell with distinct cell division events (Fig. 3c,d, top 3 panels). In one case, we observed cell divisions of both cells, and another case with a potential cell division event (Fig. 3c,d, bottom 2 panels). In case only a single cell survives and gives rise to a new clonal population we should observe a single genuine barcode. We analyzed the new potential clonal populations by deep sequencing at day 18 after seeding. Indeed, for clones where we previously identified only one cell survivor, only a single genuine barcode was detected in the population (Fig. 3e, top 3 panels). In contrast, we observed that for 2 cell survivors, 2 distinct barcodes were detected (Fig. 3e, bottom 2 panels). The barcode analyses also confirmed the presence of only 1 genuine barcode for the cell division event. Intrigued by the possibility to redefine assurance of clonal derivation by a cell intrinsic feature, we calculated the probability of clonality (PoC) when exchanging imaging evidence with barcode analysis. First, we assessed project-specific survival statistics, which represents the best approximation of PoC in the absence of imaging and method-validation studies (α = 0.372, based on 1552 wells with confluence > 10% at day 18 out of a total of 7767 plated wells) Ref.31. Next, based on the known relative frequency of barcodes at the time of limited dilution (Table S2), we estimated a “worst-case” probability for barcode collisions in all cases of an amount of k cells > 1 per well. Finally, this calculated to a PoC of 99.63%, when multiplying the probabilities for an amount of k > 1 cells in one well with the probabilities that: (i) at least two barcodes collide and (ii) both cells survive and form colonies. Collectively, these data indicate that barcode detection not only confirmed results of monoclonality assessment via image detection during limited dilution, but outperforms imaging evidence for assessment of PoC. Notably, imaging evidence overestimates the number of clones because of non-proliferating and duplet cells, while barcoding only counts viable monoclonal populations. Thus, NGS-derived cellular barcode readouts represent an improved imaging-independent monoclonality assessment method for CHO producer cell lines, offering a very high PoC (> 99.5%) by analysis of a cell intrinsic feature and project-specific survival statistics31. In addition, our barcode methods enables the option to revisit cell line identity (i.e. exclude clone mix-ups) and integrity (i.e. clone cross-contamination) at any given stage and time during the CLD process.
Cells originating from individual RMCE events share cellular phenotypes
Despite exclusion of position effects and copy number variation by using targeted integration technologies (e.g. RMCE-based), cell clones generated from stable expression pools display a relatively high variability of production-relevant readouts such as volumetric titer, metabolite profile and growth rates15. The described genetic barcoding method allows us to trace clonal CHO lineages from the time point of transfection onwards. Importantly, this allows discrimination between related cell clones originating from the same TI event but derived from different single cell cloning events (“sibling clones” that share the same barcode sequence and occurred from a cell duplication event in the CHO pool after transfection) and those from different TI events (“relative clones” with different barcodes) (Fig. 4a).
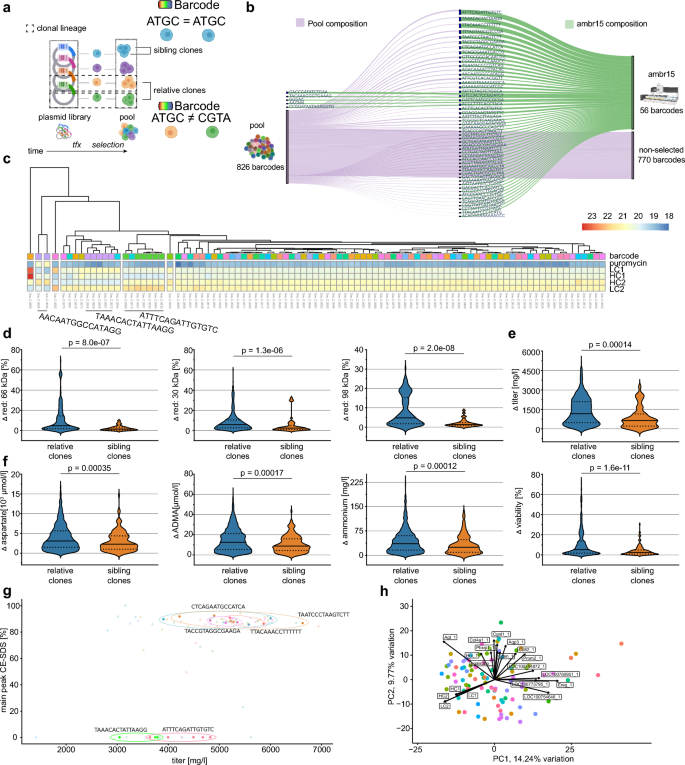
Clonal origin predicts similarity in bioprocess relevant features despite overall similarity (a) Experimental outline to evaluate the cellular production performance of clonal cells which originated from different RMCE events. Clones were randomly selected (confluence threshold) and expanded for testing in ambr15 microbioreactors. (b) Hierarchical clustering of individual producer clones by antibody chain expression in bulk transcriptome profiling. Note the distance of cells, which share the same barcode. Violin plot comparing (c) absolute differences in product quality parameters, (d) metabolite concentrations, and (e) cellular features between unique barcodes (relative clones) as compared to barcodes with ≥ 3 occurrences (sibling clones). Dotted line indicates the arithmetic mean. FDR-adjusted statistical significance was calculated by Wilcoxon rank-sum test. (f) Product quality (main peak measured by CE-SDS) and titer after protein A purification of clonal cells. Clonal cells with identical barcodes are color matched. Barcodes which occurred ≥ 3 times (sibling clones) are highlighted (circle). (g) Principal component analysis (PCA) of bulk transcriptome data from 94 randomly selected clonal cell lines. Cells were sampled at day 10 during a 14-day fed batch process in ambr15 bioreactors. Clonal cells with identical barcodes are color matched.
To test whether the phenotypic variability in cell clones is a stochastic event or whether it was predetermined, we generated cell clones from one barcoded CHO producer pool. Cell clones were selected randomly during limited dilution with a confluence threshold of 10% at day 12 in the 96-well plate. The composition of barcodes within all tested clones in the ambr15 stage was comparable to the barcode composition within the originating cell pool (Fig. 4b). Notably, frequent and rare barcode variants (from the original pool) were present in the final clonal populations. Cell clones were then tested for production-relevant markers using a downscale micro bioreactor system (ambr15).
Remarkably, cell clones clustered partially based on antibody chain transcript levels at day 10 of the ambr15 fed batch run (Fig. 4c). We speculated that cells originating from the same TI events (“sibling clones”, same barcode) may show less phenotypic variance as compared to cells from distinct TI events (“relative clones”, unique barcodes). To holistically compare phenotypic distance between clones we next compared pairs of absolute differences within all measured phenotypic data points. We selected 34 “sibling clones” (3 or more barcode occurrences) and 33 “relative clones” and observed a significantly lower variance in the group of “sibling clones” as compared to the group of “relative clones” for secreted antibody chain fragments (Fig. 4d), cellular features (Fig. 4e), and metabolite consumption (Fig. 4f). A list of all tested parameters which were statistically significant is provided (Table S1). The lower phenotypic distance was also apparent when we compared product titer with overall product quality (main peak CE-SDS), where we observed clusters of sibling clones(Fig. 4g)). In agreement with our previous results, bulk transcriptomic profiling during the ambr15 fed batch revealed little overall differences. PCA of gene expression between clones displayed low variation, PC1 explaining 14.24% and PC2 9.77% of variation (Fig. 4h). Notably, antibody chain expression was dominant in the component loading of PC1 and PC2.
The lower variance observed within clones sharing the same barcodes (“sibling clones”) raises the question as to how phenotypic variance is generated within the cell line generation process. A recent study by Weinguny and colleagues hints toward the single cell cloning process, where a distinct DNA methylation pattern emerged in each clone32. We therefore asked whether the TI event could influence the epigenetic landscape in a similar way and analyzed the genome-wide methylation profile of 12 clones (6 “sibling clones” same barcode, 6 “relative clones”). Indeed, “sibling clones” cluster closely as compared to “relative clones” (Suppl. Fig. 4a–d). In the analyzed subset most of the differential methylation occurs in intergenic regions and in regions which could not be mapped to defined chromosomes (Suppl. Fig. 4b,c).
Collectively, the data indicate that the majority of observed phenotypic diversity is pre-existing and cell-intrinsic. While some diversity remains within cells sharing the same barcode (“sibling clones”), the majority of phenotypic diversity is explained by the common origin of cells occurring from the identical TI event.
Clonal diversity control
The increased diversity of cells from distinct TI events implies that we can utilize barcodes as a proxy for cellular diversity during the cell line development process. First, we integrated barcode assessment during hit-picking in the limited dilution process and could therefore monitor the cellular origin of clones during the CLD workflow. Second, we designed one group with enriched diversity, i.e. containing only unique barcodes (“relatives clones”), and a second group with decreased diversity, i.e. with many “sibling clones” sharing the identical barcode (Fig. 5a). We hypothesized that the group with enriched barcode diversity would show a higher degree of phenotypic variance as compared to the group with decreased barcode diversity.
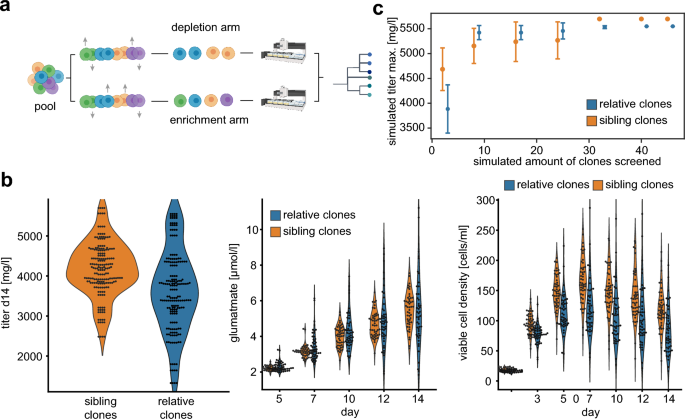
Clonal diversity controls results in leaner CLD process (a) Experimental outline of clonal diversity control during the cell line development (CLD) process. Cellular barcodes were used as proxy for cellular diversity and classified in two groups. The depletion arm contained 48 clones with 15 different barcodes, the enrichment arm 48 clones with 48 distinct barcodes. (b) Absolute values for antibody titer after protein A purification(left panel), glutamate levels (middle panel), and viable cell density (right panel) grouped by classification into depletion or enrichment arm of cellular diversity. (c) Average values for maximum titer simulation of three independent CLD processes when screening different amount of clones. The error bars represent the standard deviations of the simulated titer values.
We evaluated the cellular diversity of cell clones in ambr15 bioreactors during 14 day fed batch production. Intriguingly and in line with our previous results, key phenotypic parameters as volumetric titer values, glutamate consumption and viable cell density did demonstrate substantially increased variability (Fig. 5b). To identify the best performing clone in a population, the screening burden increases with the amount of diversity. Thus, we next simulated the maximum observed titer when systematically sampling different numbers of cell clones. Specifically, we randomly picked n previously measured titer values from cell clones three times independently and plotted the relationship between screening depth (increased amount of n clones) against the maximum titer achieved within each subset. This allowed us to estimate, whether the increased phenotypic diversity would increase or decrease the amount of clones necessary to include the top producer clones.
We observed that despite a lower average titer in the enriched diversity group, the maximum titer was reached when screening substantially lower number of clones and with higher confidence (lower SD) as compared to the decreased diversity arm (Fig. 5c).
Together, our data indicate that cellular barcodes can serve as a proxy for cellular diversity and can improve CLD screening workflows towards enriched diversity of production-relevant parameters substantially.
- SEO Powered Content & PR Distribution. Get Amplified Today.
- PlatoData.Network Vertical Generative Ai. Empower Yourself. Access Here.
- PlatoAiStream. Web3 Intelligence. Knowledge Amplified. Access Here.
- PlatoESG. Carbon, CleanTech, Energy, Environment, Solar, Waste Management. Access Here.
- PlatoHealth. Biotech and Clinical Trials Intelligence. Access Here.
- Source: https://www.nature.com/articles/s41598-024-65323-7