Production of RBCEVs starting from RBCs subjected to the loading procedure
As mentioned in the method section, human RBCs were purified from a small amount of fresh whole blood (WB) (i.e., 5 ml collected in EDTA) by means of two washes in Hepes buffer followed by filtration with a leukodepletion filter to completely remove white blood cells. The removal of granulocytes was really effective, as demonstrated by the hemocytometer analysis reported in Table S1. Regarding the loading of cargoes into RBCs, this was extremely efficient, showing that both low and high-molecular weight polymers can be effectively loaded thanks to the fine-tuned and versatile protocol already published by our group28. Loading efficiency into RBCs will be shown contextually to the one into the final RBCEVs. Cell recovery was high (60.07 ± 5.39% and 60.63 ± 6.03% for RBCs unloaded (UL) and loaded (L), respectively) in all the tested conditions and applications, demonstrating that the procedure is independent of the presence of the tested cargo.
Different conditions were tested for RBCEV production from loaded RBCs: (1) temperature (from room temperature to 37 °C); (2) different hematocrits (ranging from 4 to 20%); (3) different pore-sized PC membranes (1-µm and 5-µm), to find the most suitable procedure that allowed obtaining a reproducible and high yield amount of RBCEVs. Surprisingly, an optimal yield was achieved when hematocrit was maintained between 5 and 7%; thus, we selected 6% for further steps. In fact, higher hematocrits result in a reduced yield against any expectations. Leucocytes were removed before extrusion using leukodepletion filters. Concerning temperature, we found that performing the procedure at 37 °C produced a higher yield as well, probably due to the higher fluidity of the RBC membrane. To obtain the “soft extrusion”, a preliminary passage through a 5-μm membrane was performed (4 cycles) followed by 4 cycles through a 1-μm membrane. All these technical solutions made the extrusion as soft as possible so as not to damage cells or lose their content.
The “soft extrusion” process has been monitored using Dynamic Light Scattering (DLS) technique to evaluate the vesiculation and the reproducibility of the steps from batch to batch by physically characterizing the raw product. Table 1 shows the dimensions and the polydispersity index (PdI) of the obtained product at the end of each step of extrusion.
Results obtained starting from both UL and L RBCs are also compared. As reported, after the first passage at 5 µm, we obtained a product with a mean Z-average of 312.4 ± 43.4 nm and 311.1 ± 57.5 nm, respectively for UL and L. This demonstrates that vesiculation occurred already at the first extrusion; however, after the second extrusion, we can observe a decrease in particle size for both samples (202.9 ± 27.9 nm and 207.1 ± 14.2 nm, respectively). The decrease in the dimensions after the second extrusion was in accordance with the lower size of the membrane’s pores. In addition, the difference in terms of size when the vesicles were loaded (L) compared to the unloaded (UL) was not significant after each cycle of extrusion, indicating that the payload was not affecting the physical characteristics of the vesicles. Regarding the PdI values, which is a measure of the heterogeneity of a sample based on size, we had high values (about 0.5–0.6) owing to the presence of a small peak in all the samples, with a size of 6–7 nm that has been associated with the hemoglobin released by some cells that inevitably broke36,37. The raw product was then subjected to purification by ultracentrifugation (UC), and the final product was physically and biologically characterized by NTA, TEM, and FC.
Purification and physical characterization of the obtained RBCEVs
Nanoparticle Tracking Analysis (NTA) can often provide higher resolution than DLS, which in turn may allow faster assessment of the mean size and polydispersity. Thus, we moved to this kind of analysis to monitor the purification and to characterize the final product. Purification has been optimized starting from serial centrifugations and according to standard protocols (data not shown). The final protocol envisaged a first low-speed centrifugation to remove cell debris, filtration across a 0.45 µm polyethersulfone (PES) filter, and finally, a single UC step at 50,000 × g. NTA characterization of the final products (Fig. 1A–C) showed that UL and L RBCEVs have similar size distributions, with a hydrodynamic diameter ranging from 100 to 300 nm. Furthermore, the proposed methodology resulted in the formation of very reproducible vesicles, as shown by the mode and mean of vesicle diameter distribution corresponding to about 130 and 200 nm, respectively (n = 9). In terms of yield, we obtained from 4 to 5 × 10¹² particles/ml starting from 1 ml of RBCs at 6% Hct (that corresponds to about 2–3 × 10⁸ cells). A comparison of the yield with other methods17,38 is reported in Table S2. The effect of the soft extrusion on the particle zeta potential was also assessed by ZetaView-NTA; the obtained zeta potential was − 19 mV, in line with typical EV potential (Fig. 1D). Theoretically, each RBC should give rise to 500–600 EVs (considering the ratio between the RBC area ≅ 15 µm2 and the RBCEV area ≅ 0.015–0.020 µm2). We obtained about 450 RBCEVs per RBC, a ratio very close to the theoretical yield. This demonstrates that the soft extrusion actually allowed the vesiculation of almost all RBCs and that the breakage of cells was minimal.
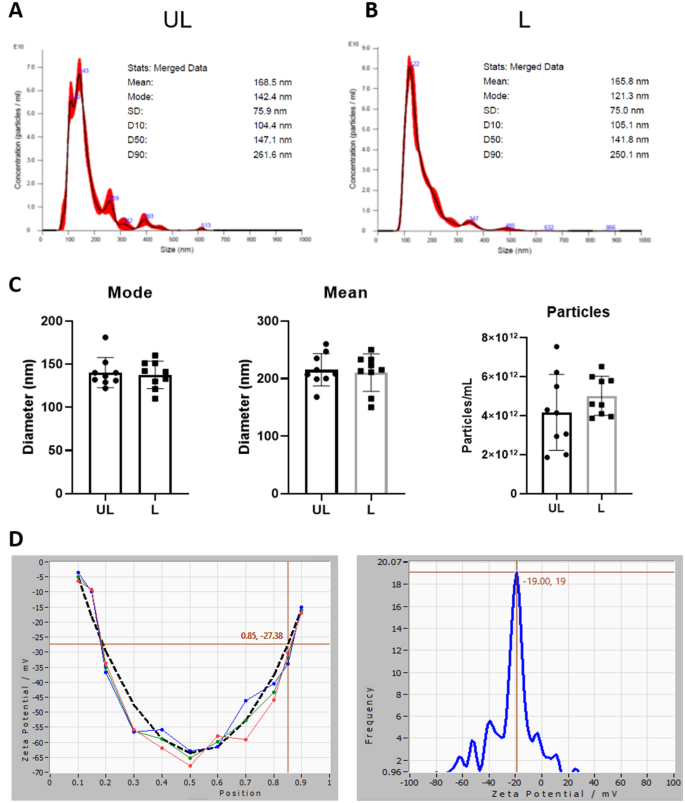
Physical characterization of RBCEVs. (A) Representative distribution plots of the UL RBCEVs diameter. (B) Representative distribution plots of the L RBCEVs diameter. (C) Histograms of the physical parameters of the distribution. Bar graphs showing inter-experiment variability over several replicates (n = 9) in terms of mode and mean of the RBCEVs size (particle diameter) and yield (particle number). As shown, no significant difference can be observed between UL and L samples for all the considered parameters, confirming the possibility of encapsulating cargoes inside RBCEVs (T-test (n = 9), P > 0.05). (D) Zeta Potential analyses of loaded RBCEVs at the end of their purification.
Purified products were further analyzed by transmission electron microscopy (TEM) using negative staining. The obtained RBCEVs appeared as membrane-closed rounded vesicles delimited by a well-defined thin bilayer with a measured diameter ranging from 50 to 200 nm (Fig. 2). The little discrepancy between the vesicle dimensions resulting from TEM and NTA could be due to sample fixation commonly leading to sample dehydration. Altogether, the reported data demonstrate that our products are indeed extracellular vesicles delimited by intact membranes, confirming once again that the developed process was suitable and very efficient for vesiculation.
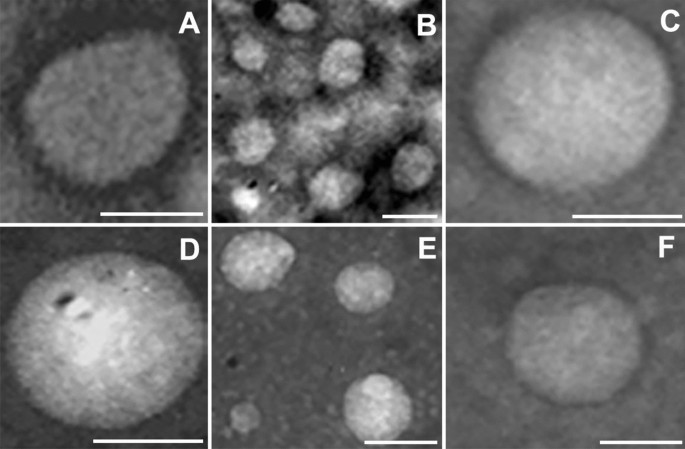
TEM analysis. Representative pictures of transmission electron microscopy analysis of negative stained RBCEVs. They were obtained at 20–50,000× magnification and represented the size distribution of the obtained RBCEVs (50–200 nm) that correlates quite well with the NTA characterization shown in Fig. 3. Scale bar = 100 nm.
Biological characterization by flow cytometry
Finally, RBCEVs have been characterized from a biological point of view using a cytofluorimetric-based approach in an attempt to detect the presence of the RBC’s typical proteins on the membrane of the obtained vesicles and to show that these proteins are correctly oriented. As better described in section “Characterization by flow cytometry (FC)”, the threshold was mainly placed on side scatter (SSC), and the correct area of analysis was established using Rosetta beads (Fig. S1 A, B), allowing to define an area that ranges from P2 to P6 (Fig. S1A). In Fig. S1B it is possible to monitor the SSC values of the acquisition threshold or a back-check of the physical characteristics, in case of thresholding on fluorescence.
LCD (an APC-emitting Lipophilic Cationic Dye) was employed to support the acquisition and analysis of the EVs since it diffuses into double-layer structures assisted by membrane potential, thus staining both particles and cells39. In Fig. 3A, gating on LCD positivity of UL and L RBCEVs is reported. Meanwhile, LCD mean fluorescence intensity (MFI) data are shown in Fig. 3B, highlighting similar profiles for UL and L samples.
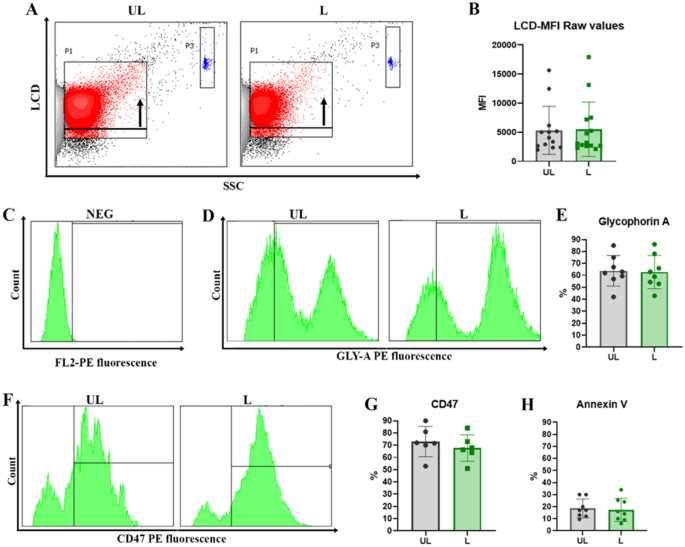
Biological characterization of unloaded and loaded RBCEVs. (A) Dot plots of LCD fluorescent probe positivity and (B) bar graph of MFI values for both UL and L RBCEVs. The black arrow in panel (A) indicates the shift in fluorescence, highlighting the specific signal of the probe. In blue, enclosed by gate P3, Dako Cytocount beads are traceable. No statistical difference can be observed between UL and L positivity in graph (B). In the next panels, only LCD+ events are shown. In (C) the marker setting up to evaluate glycophorin A positivity is reported. In (D) UL and L RBCEVs glycophorin A profiles; (E) overall statistical evaluations for PE fluorescence- GYPA RBCEVs percentages. In (F) UL and L RBCEVs CD47 profiles. In (G), overall statistical evaluations for PE fluorescence- CD47 RBCEVs percentages. (H) Bar graphs show the low mean percentages of Annexin V positivity for both UL and L RBCEVs. No statistical difference can be found between L and UL samples. Unpaired T test by PRISM software was employed for statistical analyses.
The UL and L preparations were then labeled with the reagents indicated in the “Materials and Methods” section, highlighting the following results. Most of the EVs appeared Glycophorin A (GYPA) positive (Fig. 3D, E), indicating their unequivocal origin from RBCs. GYPA-PE levels from unlabeled samples are reported in Fig. 3C. GYPA positivity also means that the membrane of the vesicles was correctly oriented since eventual inside-out phenomena would have internalized this membrane antigen. As observable, percentages of GYPA positivity under the setting conditions reached 85% for both the EV production process and EV characterization protocols. Finally, these percentages do not present a significant difference in UL and L samples, revealing that the cargo encapsulation does not alter the expression of this transmembrane protein.
Another very important antigen, the CD47, which has been associated with the “don’t eat me” signal in mother RBCs, was investigated. The labeling by anti-CD47 mAb gave (Fig. 3F–G) high positivity for both UL and L samples, confirming the absence of relevant and significant differences in UL and L preparation and highlighting that RBCEVs mirror the mother cells40,41. Natively produced and chemically produced RBCEVs usually expose PS in their outer phospholipid bilayer, thus favoring their removal from the circulation, as well. Actually, the uptake of EVs by phagocytes has been associated with the staining by Annexin V,Annexin V is a protein that binds to phosphatidylserine on the plasma membrane42,43,44. For these reasons and for the reported biochemical composition of physiologically released EVs (CD63 + /CD81 + -EVs, Annexin V + EVs)22, Annexin V positivity was investigated to complete the EV characterization. Results reported in Fig. 3H revealed very low percentages of positivity, which go in the direction of CD47 data and are in agreement with the literature on mother cells18 and physiologically-produced RBCEVs45. Finally, the autofluorescence of RBCEVs and the fluorescence of an irrelevant antibody have been checked as control. Representative histograms are reported in Fig. S2.
In addition, the proteome and miRNOme composition of RBCEVs has been compared with the respective RBC samples (Figs. S3 and S4). As displayed, the protein composition of total extracts from RBCs and RBCEVs produced by ionomycin and soft extrusion were perfectly comparable. The same was found for some selected miRNAs. Hence, RBCEVs mirror the mother RBCs concerning protein and small RNA populations.
Taken together, the data reported so far demonstrate the feasibility and the reproducibility of the process and the homogeneity in terms of physical and biological parameters of the produced population of RBCEV mimetics. Further results are next reported to prove that the process is able to produce RBCEVs loaded with different cargoes starting from preloaded RBCs, that loaded RBCEVs can be efficiently taken up by different cell kinds, and that the cargo is conveniently released inside cells to produce a biological effect.
Production of RBCEVs loaded with low molecular weight polymers
At first, we tried to produce RBCEVs starting from RBCs preloaded with a low molecular weight dextran-conjugate (10,000 Da), where the fluorophore was Cascade Blue. RBCEVs have been produced according to the herein-developed procedure, and the final products were analyzed by scattering- and fluorescence-based NTA. When dextran-loaded RBCEVs were analyzed in fluorescence mode, particles were detectable only in L samples, clearly demonstrating that Cascade Blue-Dextran was encapsulated into RBCs and retained in RBCEVs after the procedure of vesicle formation (Fig. 4A). Nanoparticle tracking under fluorescence setting of the L RBCEVs showed size distribution in agreement with those obtained in scatter mode (Fig. 4B). The loading of Cascade-Blue dextran into RBCEVs was assessed and also confirmed by flow cytometry. Figure 4C shows that L samples presented a significantly higher MFI (to be considered Cascade-Blue specific) with respect to control (UL) RBCEVs.
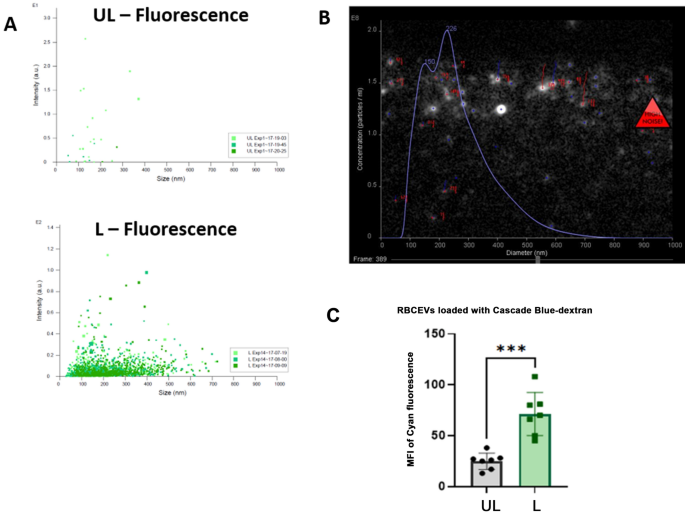
Monitoring the production of RBCEVs loaded with Cascade Blue-dextran (10 kDa). (A) Dot plots showing vesicle number and size distribution using NTA fluorescence mode in L samples compared to UL as control. (B) Representative snapshots of the Cascade Blue positive particle acquisition in L samples. In (C), the bar graph of MFI Cascade blue values recorded by flow cytometry in UL and L RBCEVs is reported. A statistically higher value is shown for L samples compared to UL ones. Unpaired T test by PRISM software was employed for statistical analyses of flow cytometric evaluations (p-values *** < 0.001).
Production of RBCEVs loaded with high-molecular weight polymers
Afterwards, we produced RBCEVs starting from RBCs loaded with high-molecular weight dextran (70,000 Da) to demonstrate that also high-molecular weight polymers can be efficiently loaded both in RBCs and RBCEVs. This kind of dextran was conjugated with Fluorescein isothiocyanate (FITC), so the presence of the cargo in the final product was analyzed using flow cytometry in the respective channel. The loading efficiency into RBCs was calculated by the ratio of Mean Fluorescence Intensity (MFI) of L versus the UL ones (Fig. 5A, B). As shown, an extremely efficient loading efficiency was obtained into RBCs, being the ratio between L and UL MFI greater than 60. Regarding the loading efficiency into RBCEVs, in Fig. 5C–E, flow cytometry and statistical histograms demonstrate the presence of the cargo also in L RBCEVs and an extremely significantly higher MFI. NTA confirmed that RBCEVs loaded with high-molecular weight dextran have overlapping dimension profiles when acquired under scatter or fluorescence mode (Fig. 5F).
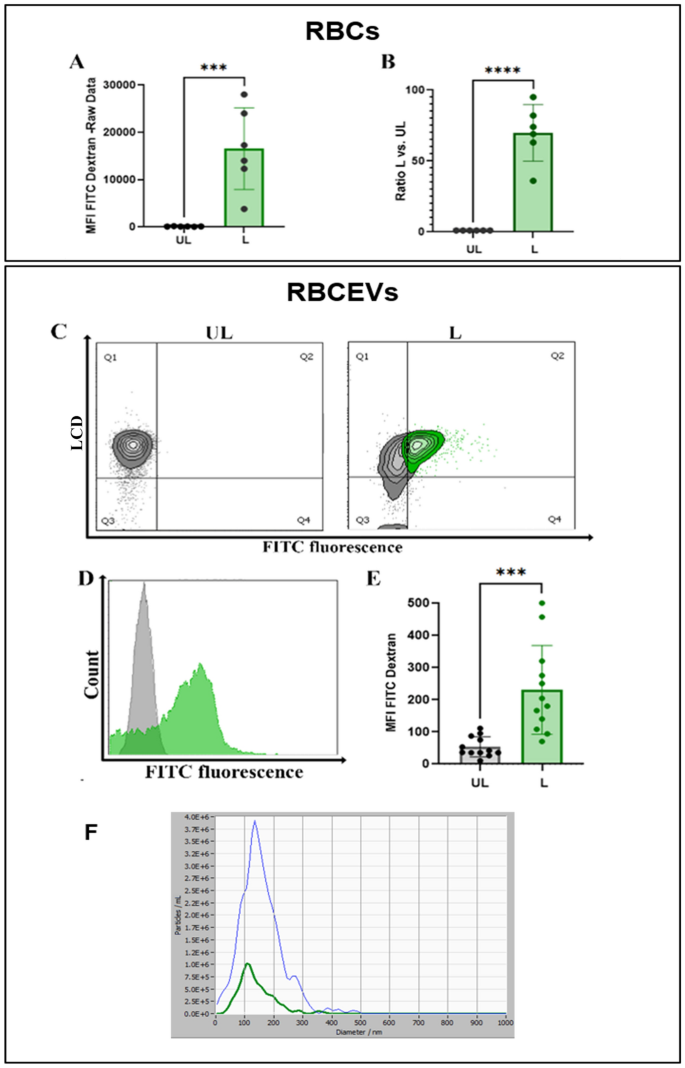
Monitoring the production of RBCEVs loaded with FITC-dextran (70 kDa). (A) Bar graph reporting green fluorescence MFI values for RBCs L compared to the relative UL controls. (B) Ratio calculated between L and UL samples. (C) Dot plot showing FITC-dextran positivity of LCD positive events in L RBCEVs compared to UL controls. (D) Representative histogram overlay for UL green fluorescent RBCEVs (grey histogram) and for L green fluorescent-FITC dextran (green histogram) RBCEVs evaluation. (E) Mean fluorescence intensity found in L RBCEVs compared to UL samples. (F) Analysis of loaded RBCEVs size distribution acquired in scattering and fluorescence mode, respectively. Unpaired T test by PRISM software was employed for statistical analyses (p-values *** < 0.001, **** < 0.0001).
Taken together, these data clearly prove that cargo loading could be retained at the end of the production of RBCEVs and that the loading was efficient for both low and high-molecular weight molecules.
Uptake of PKH26-labeled RBCEVs in HUVEC and PBMC
Afterward, we evaluated the ability of RBCEVs to be internalized by different kinds of cells (i.e., HUVEC, lymphocytes and monocytes isolated from PBMC). To this end, the produced UL RBCEVs were labeled with PKH26, a common cell membrane dye. After labeling, 1.5 × 10¹¹ RBCEVs were administered to the cells and let incubated for 4 and/or 24 h. After the incubation times of EVs with the specific cell lines employed for uptake evaluation, confocal analyses and flow cytometry quantitation were carried out.
Figure 6 displays data from HUVEC at 4 and 24 h. In panels A and B, flow cytometry histograms of PKH26 fluorescence in HUVEC cells showed an extremely high uptake of labeled RBCEVs. In (C), the frequencies of dead cells were revealed by means of 7-AAD positivity, and the relative statistical report is shown in (D). This preliminary analysis ensured that, at the used concentrations, RBCEVs were not toxic and did not cause cell death. The uptake was confirmed by the confocal images (E) that highlighted red dots (PKH26-labeled RBCEVs) internalized into HUVEC cells (stained by green fluorescent probes). Already at 4 h of incubation, the percentage of cells positive to PKH26 was abundant (F) and reached almost the 100% at 24 h. However, at a longer time, the amount of uptaken RBCEVs, measured by means of MFI, is even higher (G).
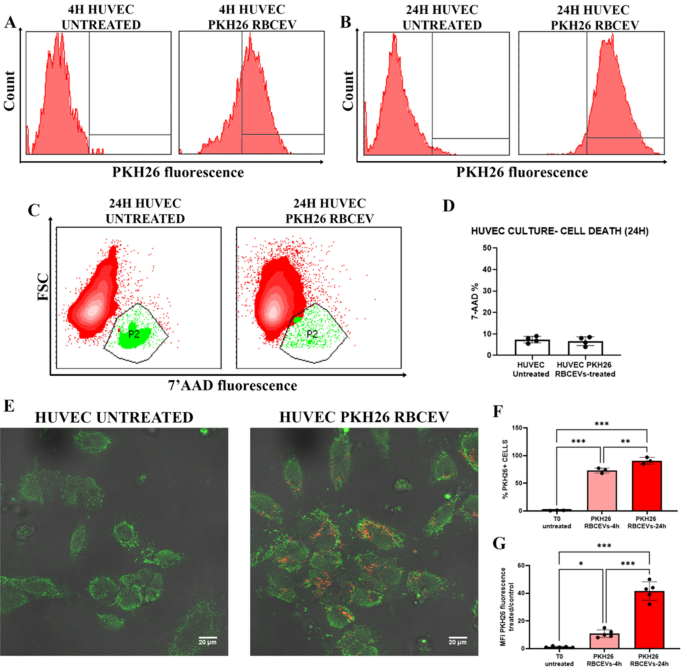
PKH26-labeled RBCEVs uptake in HUVEC. (A) Histograms of PKH26 positivity in HUVEC untreated labeled and treated by labeled RBCEVs after 4 h and (B) labeled after 24 h. (C) Dot plots for assessing 7′ AAD positivity in order to detect cell death eventually induced in HUVEC by RBCEVs. (D) Bar graphs of 7′ AAD percentage of positivity in HUVEC treated or not with RBCEVs. Unpaired T test by PRISM software was employed for this statistical analysis. (E) Confocal images of PKH26 labeled RBCEVs and relative untreated controls. In red, PKH26 fluorophore signal, and in green, phalloidin-FITC that co-localizes into HUVEC. (F) Bar graphs reporting percentages of PKH26 positivity in HUVEC treated with labeled RBCEVs compared to untreated ones at 4 and 24 h. (G) Bar graphs reporting PHK26 MFI values in HUVEC treated by PKH26 labeled RBCEVs compared to the untreated ones at 4 and 24 h. One Way ANOVA, with Tukey multiple Comparison Tests, by PRISM Software, was employed for this statistical analysis (p-values ** < 0.05, *** < 0.001).
In Fig. S5, data from 4 and 24 h incubation with PBMCs are reported. Physical characteristics from the flow cytometry parameters forward scatter (FSC) vs SSC are given, underlining the presence of both lymphocytes (blue-colored) and monocytes (magenta-colored). Flow cytometry histograms revealed a small but appreciable uptake in lymphocytes, while a strong internalization was revealed in monocytes. The relative quantitation is shown, demonstrating a highly significant uptake of labeled RBCEVs with respect to control. As for HUVEC cells, PBMCs did not reveal any necrotic/apoptotic process induced by RBCEVs, at least for the time investigated.
In both HUVEC and monocytes, the uptake of RBCEVs is already appreciable after 4-h incubation however it is markedly increased after 24 h. For this reason, these incubation conditions have been selected for the following experiments.
Production of miR-210-loaded RBCEVs and evaluation of the biological effects
After successfully having proven the procedure’s feasibility and having selected the best uptake conditions, we moved to the demonstration of RBCEV’s biological effect by loading a pharmacologically active cargo. To this end, we produced miR-210-loaded RBCEVs using the same procedure we had used before. MiR-210-3p mimic was first loaded into human RBCs and then preloaded RBCs were subjected to soft extrusion. The obtained miR-210-loaded RBCEVs were purified and used for the evaluations of the loading efficiency and the ability to release the miRNA into recipient cells and exert a biological effect. For the evaluation of the amount of loaded miRNA, RBCs and RBCEVs samples were subjected to totRNA extraction, cDNA synthesis, and absolute quantification via qPCR. In Fig. 7A, we report the mean concentration of miRNA achieved in the starting RBCs (1370.61 ± 336.09 pmol/ml) compared to the one obtained in the final RBCEVs (44.65 ± 2.12 pmol/ml). This corresponds to a concentration of about 10 pmol of miRNA per 1.0 × 10¹² EVs. UL samples were used as negative control and the respective concentrations represented the endogenous miR-210. For the calculation of the loading efficiency, the concentration of miR-210-3p into the produced RBCEVs has been relativized to the starting value loaded into the mother RBCs; the mean value is 3.26 ± 0.90%. Therefore, an efficient loading into RBCEVs was also demonstrated for this active pharmaceutical compound.
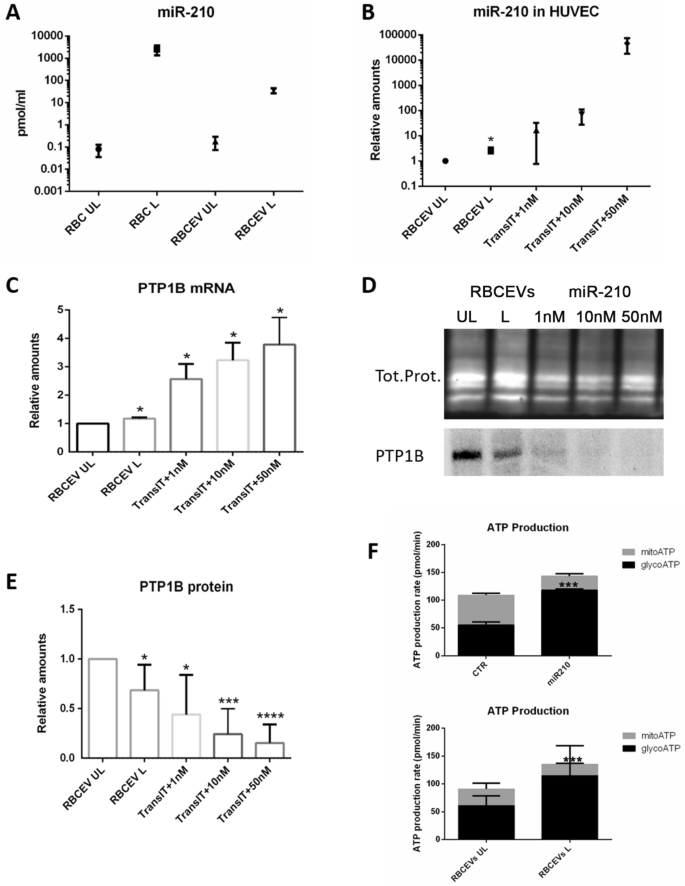
Production of miR-210-loaded RBCEVs and biological effect. (A) Absolute miR-210 concentrations have been calculated by a standard curve set up with synthetic RNA standards at 20–0.0002 nM. miR-210 concentration into loaded RBCEVs is compared to UL RBCEVs and to the starting concentration obtained into the mother RBCs (UL and L) before vesiculation. High loading efficiency can be appreciated. The amount of miR-210 found in UL RBCs and RBCEVs is due to the endogenous miRNA. Data are mean and SEM (n = 4). In (B), miR-210 relative quantification into HUVEC is reported. Relative quantification has been performed using U6 snRNA as a reference gene and UL sample as a control. miR-210 concentration found in HUVEC treated with L RBCEVs are compared to cells treated with UL RBCEVs and to cells transfected at different miRNA concentrations. Data are mean and SEM, n = 4 (Unpaired t-test; *two-tailed p-values < 0.05). In (C), the evaluation of the effect of miR210-loaded RBCEVs at the mRNA level is shown. Relative quantification of PTB1B mRNA has been performed using ATCB as reference gene and UL sample as control. PTP1B mRNA found in HUVEC treated with L RBCEVs is compared to cells treated with UL RBCEVs and to cells transfected at different miRNA concentrations. Data are mean and SEM, n = 4 (Unpaired t-test; *two-tailed p-values < 0.05). (D) Western blot of PTP1B in protein extracts from HUVEC treated with RBCEVs UL or L and transfected with different amounts of miR-210. Lanes 1–5: RBCEVs UL, RBCEVs L, miR-210 1 nM, 10 nM, and 50 nM plus Transit-2X. This figure has been cropped in order to report the most relevant results and the original blot is available in Supplementary Fig. S8. In (E), the evaluation of the effect of miR210-loaded RBCEVs at the protein level. Quantification of PTP1B band normalized to total proteins. Data are the mean and SEM, n = 4 (Unpaired t-test; p-values * < 0.05, *** < 0.001, **** < 0.0001). (F) Glycolytic and mitochondrial ATP production rates obtained in both miR210-transfected and RBCEVs-treated HUVEC (Unpaired t-test; p-values *** < 0.001).
MiR-210-loaded RBCEVs were then administered to HUVEC in order to assess the ability of the same to deliver the miRNA to recipient cells and to evaluate their biological effect. In parallel, we administered UL RBCEVs (as negative control) and transfected increasing concentrations of nude miRNA (as positive control). After 24 h of incubation, cells were collected and subjected to totRNA or protein extractions. The RNA samples were first used for miR-210 quantification into the recipient cells. Figure 7B shows the amount of miR-210 found in HUVEC in the different conditions. Relative amounts have been calculated by the ddCT method using cells treated with UL RBCEVs as control. As displayed, the amount of miRNA delivered to HUVEC can be comparable to the one obtained with the lower concentration used for transfection (1 nM). Indeed, considering the mean concentration of miR-210 per RBCEVs above reported (i.e., 10 pmol per 1.0 × 10¹² EVs), we can argue that we put about 2 pmol per well, which is the same amount given to cells in the 1 nM transfection.
RNA samples were finally used to evaluate the effect of the delivered miRNA on the mRNA of a known target of miR-210, which is PTP1B34 Fare clic o toccare qui per immettere il testo.. According to the literature, the effect of mR-210 is not exerted at the RNA level46. Actually, we have seen an increase in the mRNA levels both in the samples treated with the loaded RBCEVs and in the transfected samples (Fig. 7C). This can be a feedback effect due to the block of protein translation and was also observed by Hu et al.46.
Thus, we moved to evaluate the effect at the protein level. To do this, we used protein extracts from the same experiments and performed SDS-PAGE, western blotting, and immunoblotting. PTP1B antibody recognized a single band corresponding to the expected molecular weight, according to47. After that, we proceeded to band quantification and total protein normalization. Figure 7D shows a representative blot and the respective total proteins, while Fig. 7E the quantification. As can be seen, a significant downregulation in the cells treated with RBCEVs loaded with miR-210 (L) compared with UL has been detected. The effect was slightly lower than in the cells transfected with 1 nM of miRNA. Our data confirm that the effect of miR-210 occurs at the protein level, as reported by other authors48.
Lastly, since miR-210 is known to shift mitochondrial metabolism to cytosolic one35,49, the glycolytic and mitochondrial ATP production rates have been evaluated. Figure 7F shows that both transfected miR-210 and miR210-loaded RBCEVs significantly induced the glycolytic ATP production and contemporarily reduced the mitochondrial one into recipient cells. Not treated or HUVEC treated with UL RBCEVs were used as negative controls, respectively.
Thanks to these preliminary in vitro results, we proved that RBCEVs can be efficiently loaded with short RNA molecules and abundantly internalized into cell models. Once into the cells, the cargo can be effectively released by the RBCEVs and exert its biological effect. Hence, miR210-loaded RBCEVs can represent a potential option for the treatment of several diseases in which the miRNA is involved and also a proof-of-concept for further applications in RNA-based therapies.
- SEO Powered Content & PR Distribution. Get Amplified Today.
- PlatoData.Network Vertical Generative Ai. Empower Yourself. Access Here.
- PlatoAiStream. Web3 Intelligence. Knowledge Amplified. Access Here.
- PlatoESG. Carbon, CleanTech, Energy, Environment, Solar, Waste Management. Access Here.
- PlatoHealth. Biotech and Clinical Trials Intelligence. Access Here.
- Source: https://www.nature.com/articles/s41598-024-65623-y