The transcriptional co-factor VGLL1 is highly expressed during primate TE induction
We produced TELCs from human naïve H9 embryonic stem cells (ESCs) generated with our newly established 4CL medium33 using a previously reported TELC conversion protocol26 (Fig. 1a). Flattened epithelial-like cells with a TE-like morphology were observed at day 5 (Fig. 1b). Downregulation of classical (e.g., NANOG and OCT4) and naïve (e.g., KLF17 and DPPA3) pluripotency genes, expression of naïve/TE shared genes such as TEAD4 and TFAP2C, and upregulation of TE-enriched genes like GATA3 and ENPEP were validated by immunofluorescence microscopy and/or bulk RNA-sequencing (RNA-seq) (Fig. 1c, d and Supplementary Fig. 1a). To assess the fidelity with which TELCs derived from 4CL ESCs reflect preimplantation embryo TE cells, we performed droplet-based single-cell RNA sequencing (scRNA-seq)39 at day 5 of TELC induction (TELC-D5) from 4CL ESCs and integrated them with previously reported scRNA-seq datasets of 4CL naïve ESCs33, human preimplantation40,41 and postimplantation embryo cells42. Uniform manifold approximation and projection (UMAP) representation showed that TELC-D5 cells clustered closely with human preimplantation embryo TE cells and their gene expression pattern was comparable (Fig. 1e, f). Pearson correlation analysis among the subclusters within TELC-D5 cells showed that they are highly correlated (correlation score > 0.9) except for two subclusters (cluster 7 and 8, 2.08 % of total TELC-D5 cells); cluster 7 also expressed SCT related genes (Supplementary Fig. 1b-d). These results suggest that 4CL ESC-derived TELC-D5 cells are relatively homogenous and resemble the human preimplantation embryo TE. We then determined the differentially expressed genes (DEGs) between naïve ESCs and TELC-D5 cells, and found VGLL1 as the most significantly upregulated gene in TELCs (Fig. 1g). In contrast, YAP1 and TEAD4 were only moderately upregulated in TELC-D5 cells. We confirmed the exclusivity of VGLL1 expression in TELCs by immunofluorescence microscopy, real-time quantitative PCR (RT-qPCR) and Western blotting (Fig. 1c, h, i). Western blotting also validated the downregulation of the pluripotency genes NANOG, OCT4 and SOX2 (Fig. 1i). Likewise, it confirmed that YAP and TEAD4 are slightly upregulated in TELC-D5 cells compared with naïve ESCs.
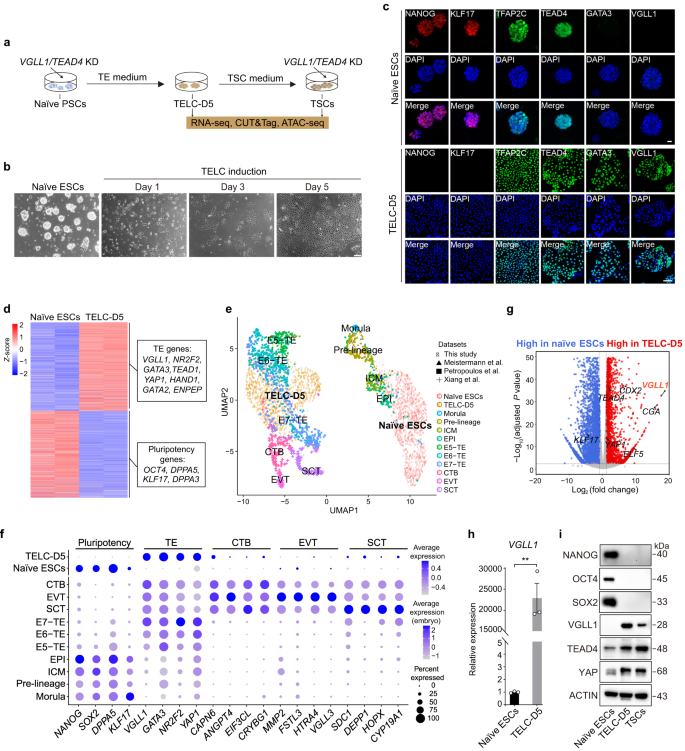
a Schematic depicting the generation of TELC-D5 from 4CL H9 ESCs with TE medium and the generation of TSCs from TELC-D5 cells with TSC medium. VGLL1/TEAD4 knockdown (KD) and multiple types of sequencing were performed as indicated. b Phase contrast images of 4CL H9 ESCs and TELCs at the indicated time points. Scale bar, 40 µm. Representative of three independent experiments. c Immunostaining images for pluripotency (NANOG and KLF17), naïve/TE shared (TFAP2C and TEAD4), and TE-enriched (GATA3 and VGLL1) genes in 4CL H9 ESCs (upper panels; scale bar, 50 µm) and TELC-D5 cells (lower panels; scale bar, 100 µm). Nuclei were counterstained with DAPI (blue). Representative of three independent experiments. d Heatmap showing the expression of pluripotency and TE genes in bulk RNA-seq for the indicated conditions. Example genes for each cluster are shown in the boxes. n = 2 biological replicates. e UMAP comparing the human embryonic day 4 (E4) to E14 stages with 4CL H9 ESCs and TELC-D5 cells. All reference datasets used in this study are summarized in Methods. f Bubble plot showing the frequency of expression and scaled average expression of representative genes in, 4CL H9 ESCs, TELC-D5 cells and human embryo E4-E14 datasets. TE, trophectoderm; CTB, cytotrophoblast; EVT, extravillous trophoblast; SCT, syncytiotrophoblast. g Volcano plot showing DEGs between 4CL H9 naïve ESCs and TELC-D5 cells. DEGs higher in TELC-D5 cells (log2(fold change) > 1) are shown in red. P value was calculated using the Wald test and adjusted for multiple testing using the Benjamini-Hochberg correction. h RT-qPCR showing the expression of VGLL1 in 4CL H9 ESCs and TELC-D5 cells. Data are presented as the mean ± standard error of the mean (SEM) of the fold-change compared to naive ESCs. n = 3 biological replicates. P value was calculated using a two-tailed unpaired Student’s t-test, ***P < 0.001. i Western blotting analysis for the indicated proteins in 4CL H9 ESCs, TELC-D5 cells, and TSCs derived from TELC-D5 cells. Representative of three independent experiments.
The high levels of VGLL1 in TELCs derived from naive ESCs prompted us to study its expression kinetics during early in vivo development. The human early blastocyst corresponding to embryonic day 5 (E5) is comprised of cells belonging to the earliest stage of TE and ICM lineage. We investigated the identities and gene expression patterns of human E5 cells from a previously reported scRNA-seq dataset40. UMAP segregated the TE and ICM cells in addition to pre-lineage cells in E5 cells (Fig. 2a). Classical and naive pluripotency genes were highly expressed in pre-lineage and ICM cells but downregulated in TE cells (Supplementary Fig. 1e). TE-related transcription factors like GATA3, GATA2 and CDX2 were upregulated in TE cells compared with pre-lineage or ICM cells (Fig. 2b, Supplementary Fig. 1e). VGLL1 was highly and specifically expressed in TE cells. This is relevant because context-dependent highly expressed genes often function as key regulators43. Unlike mouse, genes like ELF5 and EOMES were only marginally expressed at this stage (Supplementary Fig. 1e), which is consistent with previous report44. To better understand the dynamic changes of gene expression during the human TE and ICM lineage bifurcation, we performed pseudotime analysis of the scRNA-seq data using Monocle 245,46,47 (Fig. 2c). As expected, pluripotency genes such as OCT4 and SOX2 increased in the pre-lineage to ICM branch and were downregulated in the pre-lineage to TE branch (Supplementary Fig. 1f). In contrast, naive/TE shared genes like TEAD4, YAP1 and TFAP2C remained at similar expression levels along the pseudotime or were moderately upregulated, whereas TE-enriched genes like GATA3, GATA2 and CDX2 were progressively upregulated (Fig. 2d, Supplementary Fig. 1f). Further supporting a role in TE specification, VGLL1 showed a dramatic upregulation at the onset of the TE branch (Fig. 2d). The quick induction and highly selective expression of VGLL1 in TE were further confirmed by using another human early embryo scRNA-seq dataset41 (Supplementary Fig. 1g-j).
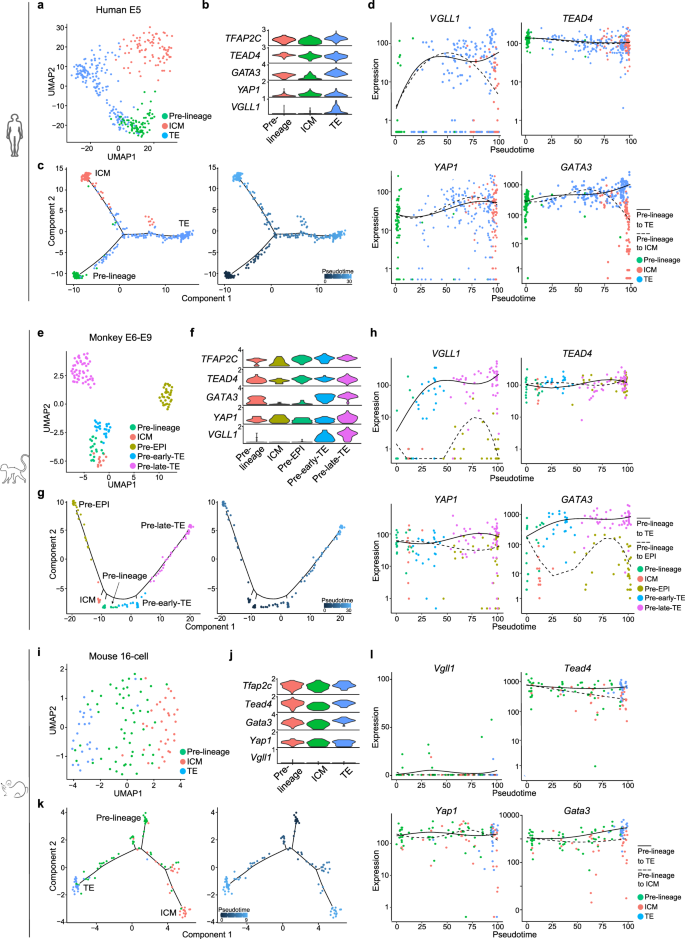
a UMAP visualization showing the different cell types in the human blastocyst at E540. Dots are colored by cell type. Cell types were annotated by cluster-specific gene expression patterns. b Violin plot showing the log-normalized expression of TE genes in different cell types of the human blastocyst at E5. c Left panel: the trajectory of the different cell types in the human blastocyst at E5 reveals two branches: pre-lineage to the TE branch and pre-lineage to the ICM branch. Right panel: colors from dark blue to light blue indicate progression through the pseudotime. d Expression patterns of TE genes along the pseudotime trajectory of cells in the human blastocyst at E5. e UMAP visualization showing the different cell types in the monkey blastocyst at E6-E948. Dots are colored by cell type. Cell types were annotated by cluster-specific gene expression patterns. f Violin plot showing the log-normalized expression of TE genes in different cell types of the monkey blastocyst at E6-E9. g Left panel: the trajectory of the different cell types in the monkey blastocyst (E6-E9) reveals two branches: pre-lineage to the TE branch and pre-lineage to the EPI branch. Right panel: colors from dark blue to light blue indicate progression through the pseudotime. h Expression patterns of TE genes along the pseudotime trajectory of cells in the monkey blastocyst at E6-E9. i UMAP visualization showing the different cell types at the mouse 16-cell stage49. Dots are colored by cell type. Cell types were annotated by cluster-specific gene expression patterns. j Violin plot showing the log-normalized expression of TE genes in different cell types at the mouse 16-cell stage. k Left panel: the trajectory of the different cell types at the mouse 16-cell stage reveals two branches: pre-lineage to the TE branch and pre-lineage to the ICM branch. Right panel: colors from dark blue to light blue indicate progression through the pseudotime. l Expression patterns of TE genes along the pseudotime trajectory of cells at the mouse 16-cell stage.
In addition, we investigated the cell types and gene expression pattern of early Macaca fascicularis monkey embryo using a reported scRNA-seq dataset48 and found that, similar to human, VGLL1 is highly expressed in a TE-specific manner (Fig. 2e, f). Pseudotime analysis also showed that VGLL1 is strongly induced since the beginning of TE lineage specification (Fig. 2g, h). In contrast, scRNA-seq of early mouse embryo development49 showed that Vgll1 is marginally expressed and minimally upregulated at the onset of mouse TE induction in the 16-cell stage (Fig. 2i-l), which is consistent with previous report that VGLL1 is not involved in mouse trophoblast specification34. These results indicate that VGLL1 may function as a TE induction regulator in primates.
VGLL1 regulates TELC generation from human naive PSCs
To explore whether VGLL1 has a functional role in human TE specification, we depleted it using short-hairpin RNAs (shRNAs; shVGLL1−2 and −4) during the 4CL naive PSC to TELC induction. Knockdown efficiency was confirmed by RT-qPCR and Western blotting (Fig. 3a, b). Notably, we observed that self-renewal (cell proliferation) during the conversion was severely compromised in shVGLL1 transduced cells compared to the shLuc control, and this was also accompanied by a lack of TE-like morphology (Fig. 3c, d). We then performed bulk RNA-seq for shLuc and shVGLL1 transduced TELC-D5 cells. Consistent with the reduced proliferation and lack of TE-like morphology, cell-cycle/self-renewal genes such as MKI67, CDK1/3/7 and CDC42, and TE genes like GATA3, ENPEP, NR2F2 and TEAD1, were substantially downregulated in shVGLL1 transduced cells compared to control shLuc (Fig. 3e). There was relatively less downregulation of pluripotency genes in shVGLL1 cells compared to shLuc control (Fig. 3e). These results were validated by RT-qPCR (Fig. 3f). In agreement, gene ontology (GO) analysis for the downregulated genes with shVGLL1 showed enrichment of terms related to cell cycle DNA replication, cell cycle checkpoint, in utero embryonic development and placenta development (Fig. 3g). Likewise, upregulated genes in shVGLL1 transduced cells compared to control shLuc were related to development and cell fate commitment (Fig. 3h). To further validate the function of VGLL1 in TELC induction, we generated VGLL1 knockout (KO) clones (C45 and C68) using CRISPR-Cas9 technology with H9 ESCs (Fig. 3i, j). Consistent with the shRNA-mediated VGLL1 knockdown, both VGLL1 KO clones, compared to wild-type (WT) clones, showed reduced TE gene expression determined by RNA-seq as well as compromised cell proliferation confirmed by phase contrast imaging and cell counting (Fig. 3k-m). The downregulated genes in VGLL1 KO cells were associated with in utero embryonic development, placenta development and positive regulation of cell cycle determined by GO enrichment analysis (Fig. 3n).
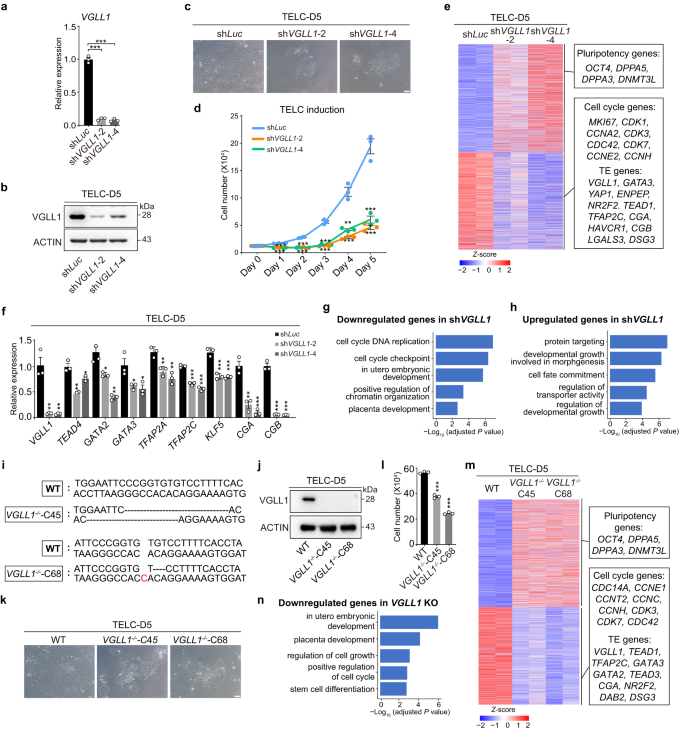
a RT-qPCR showing the VGLL1 knockdown efficiency for 4CL H9 ESCs transduced with shVGLL1−2 or shVGLL1−4 compared to the shLuc control at day 5 of TELC differentiation. Data are presented as the mean ± SEM, n = 3 biological replicates. P value was calculated using a two-tailed unpaired Student’s t-test, ***P < 0.001. b Western blotting analysis of the indicated proteins for 4CL H9 ESCs transduced with shVGLL1−2 or shVGLL1−4 compared to the shLuc control at day 5 of TELC differentiation. Representative of three independent experiments. c Representative phase contrast images of 4CL H9 ESCs transduced with shLuc (control) or shVGLL1 (2 and 4) at day 5 of TELC differentiation. Scale bar, 100 µm. Representative of three independent experiments. d Analysis of cell numbers for 4CL H9 ESCs transduced with shLuc, shVGLL1−2 or shVGLL1−4 throughout the TELC induction time course. Data are presented as the mean ± SEM. n = 3 biological replicates. P value was calculated using a two-tailed unpaired Student’s t-test, ***P < 0.001, **P < 0.01. e Heatmap showing the expression of pluripotency, cell cycle and TE genes in 4CL H9 ESC-derived cells from the indicated conditions. Example genes are shown for each cluster in the boxes. n = 2 biological replicates. f RT-qPCR showing the expression of TE-related genes for 4CL H9 ESCs transduced with shVGLL1−2 and shVGLL1−4 compared to the shLuc control at day 5 of TELC differentiation. Data are presented as the mean ± SEM. n = 3 biological replicates. P value was calculated using a two-tailed unpaired Student’s t-test, ***P < 0.001, **P < 0.01, *P < 0.05. g Enriched GO terms for downregulated genes in 4CL H9 ESCs transduced with shVGLL1 compared to shLuc control at day 5 of TELC differentiation. P value was calculated using a hypergeometric test (one-sided) and adjusted for multiple testing using the Benjamini-Hochberg correction. h Enriched GO terms for upregulated genes in 4CL H9 ESCs transduced with shVGLL1 compared to shLuc control at day 5 of TELC differentiation. P value was calculated using a hypergeometric test (one-sided) and adjusted for multiple testing using the Benjamini-Hochberg correction. i TA cloning followed by Sanger sequencing results showing homozygous deletion for VGLL1-knockout clones [clone 45 (C45) and clone 68 (C68)]. WT: wild-type. j Western blotting analysis of VGLL1 expression in H9 WT and VGLL1-knockout clones at day 5 of TELC induction. Representative of three independent experiments. k Representative phase contrast images of H9 WT and VGLL1-knockout clones at day 5 of TELC induction. Scale bar, 100 µm. Representative of three independent experiments. l Analysis of cell numbers for H9 WT and VGLL1-knockout clones at day 5 of TELC induction. Data are presented as the mean ± SEM. n = 3 biological replicates. P value was calculated using a two-tailed unpaired Student’s t-test, ***P < 0.001. m Heatmap showing the expression of pluripotency, cell cycle and TE genes in bulk RNA-seq of H9 VGLL1-knockout clones compared to WT at day 5 of TELC induction. Example genes are shown for each cluster in the boxes. n = 2 biological replicates. n Enriched GO terms for downregulated genes in H9 VGLL1-knockout clones compared to WT at day 5 of TELC induction. P value was calculated using a hypergeometric test (one-sided) and adjusted for multiple testing using the Benjamini-Hochberg correction.
Trophoblast lineage differentiation potential may vary with cell lines and starting naive PSC states17. We thus performed VGLL1 knockdown in another human induced pluripotent stem cell (iPSC) line, UH1050,51, and tested other well-established human naive PSC culture conditions: PXGL and HENSM52,53. Consistently, VGLL1 knockdown during TELC induction resulted in reduced TE gene expression and compromised cell proliferation in UH10 iPSCs in 4CL medium or H9 ESCs in PXGL and HENSM media (Supplementary Fig. 2a-i). These findings demonstrate that VGLL1 is required for the induction of human TELCs regardless of the cell line or starting naive PSC medium.
To exclude the possibility that the effect of VGLL1 depletion on TE gene expression is due to cell cycle arrest, we generated two effective shRNA lentiviruses targeting TP53 (shTP53−1 and shTP53−2) and then transduced them into WT and VGLL1 KO (C45 and C68) H9 ESCs, along with shLuc as control (Supplementary Fig. 2j). In all settings, we observed a 50-70% increase of cell number in TP53 knockdown cells relative to shLuc control cells, as expected (Supplementary Fig. 2k). Despite the increased cell number, we did not observe upregulation of TE genes like GATA2, GATA3, TFAP2C and YAP1 in TP53 knockdown cells compared with shLuc control cells, providing evidence that the regulatory function of VGLL1 on TE gene expression is independent of cell cycle arrest (Supplementary Fig. 2l).
Therefore, we have demonstrated that VGLL1 is a critical regulator of the human naive PSC to TELC transition, highlighting a major difference with mouse.
VGLL1 works in tandem with TEAD4 to regulate human TELC specification
To dissect the function of VGLL1, we performed Cleavage Under Targets and Tagmentation (CUT&Tag)54 for VGLL1 in TELC-D5 cells differentiated from 4CL H9 ESCs to determine its genomic occupancy. A total of 54,773 binding loci were captured (Supplementary Data 1). Peak distribution analysis revealed that VGLL1 primarily binds to promoter, distal intergenic and intronic regions (Fig. 4a). This occupancy pattern suggested that VGLL1 regulates target genes by controlling both promoter and enhancer activity. Consistently, cross-comparison with our bulk RNA-seq results showed that 78.2% of downregulated genes in shVGLL1 compared with shLuc are bound by VGLL1 (Fig. 4b), supporting a direct regulatory effect of VGLL1 on these genes. Genes bound by VGLL1 were enriched for GO terms such as placenta development, metaphase/anaphase transition of mitotic cell cycle, and cilium assembly (Fig. 4c), among others. This shows that VGLL1 regulates genes involved in multiple aspects of TE function.
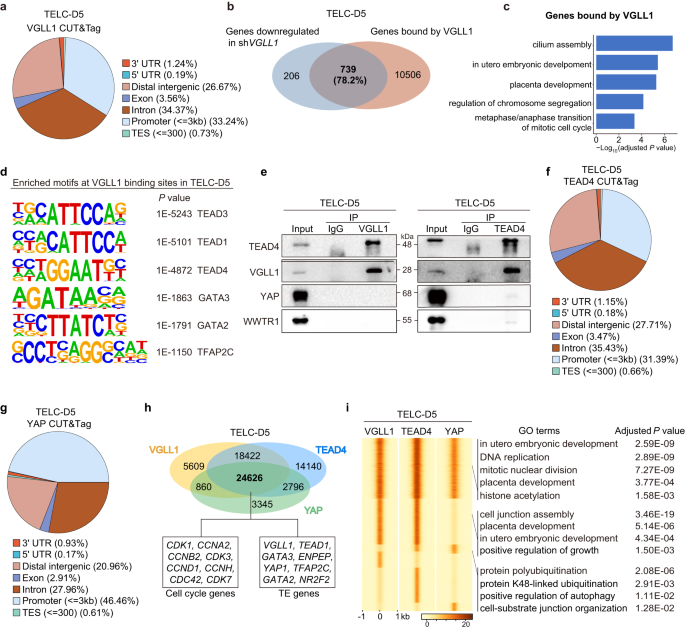
a Pie chart showing the distribution of VGLL1-binding sites throughout the annotated genomic locations in CUT&Tag of TELC-D5 cells differentiated from 4CL H9 ESCs. b Venn diagram showing the overlap between downregulated genes in shVGLL1 compared to shLuc control and genes bound by VGLL1 at promoter sites in TELC-D5 differentiated from 4CL H9 ESCs. c Enriched GO terms for genes bound by VGLL1 in TELC-D5 cells differentiated from 4CL H9 ESCs. P value was calculated using a hypergeometric test (one-sided) and adjusted for multiple testing using the Benjamini-Hochberg correction. d Motif analysis using HOMER showing the significantly enriched DNA-binding motifs at VGLL1-bound sites in TELC-D5 cells differentiated from 4CL H9 ESCs. P value was calculated using a hypergeometric test (one-sided). e Immunoprecipitation using lysates from TELC-D5 cells differentiated from 4CL H9 ESCs with anti-VGLL1 (left panel) or anti-TEAD4 (right panel) and subsequent Western blotting analysis with anti-TEAD4, anti-VGLL1, anti-YAP and anti-WWTR1. Representative of three independent experiments. f Pie chart showing the distribution of TEAD4-binding sites throughout the annotated genomic locations in TELC-D5 cells differentiated from 4CL H9 ESCs. g Pie chart showing the distribution of YAP-binding sites throughout the annotated genomic locations in TELC-D5 cells differentiated from 4CL H9 ESCs. h Venn diagram showing the overlap between VGLL1-, TEAD4- and YAP-bound sites in CUT&Tag of TELC-D5 cells differentiated from 4CL H9 ESCs. Representative cell cycle and TE genes corresponding to the overlapping regions are shown. i Co-occupancy analysis by signal density pileups of VGLL1, TEAD4 and YAP peaks in CUT&Tag of TELC-D5 differentiated from 4CL H9 ESCs. GO analysis for each group is shown. P value was calculated using a hypergeometric test (one-sided) and adjusted for multiple testing using the Benjamini-Hochberg correction.
VGLL1 is a transcriptional co-factor55 and is not predicted to bind DNA directly. Therefore, we performed motif discovery analysis to uncover its potential transcription factor partners. The DNA-binding motif for TEAD4, a well-known transcription factor necessary for TE specification in mouse5,7, was highly enriched in VGLL1-bound sites (Fig. 4d). We then asked whether VGLL1 physically interacts with TEAD4. We first did a reciprocal co-immunoprecipitation in two cell lines (H9 ESCs and UH10 iPSCs) at day 5 of TELC induction from 4CL PSCs and found that VGLL1 and TEAD4 strongly interact with each other (Fig. 4e and Supplementary Fig. 3a). Moreover, in line with previous reports32, there was reduced cell proliferation and compromised TELC identity when we knocked down or knocked out TEAD4 during the TELC conversion, irrespective of the cell lines or naive culture conditions (Supplementary Fig. 3b–r). We also confirmed that the effect of TEAD4 suppression on TE gene expression is not due to cell cycle arrest using 4CL H9 ESCs (Supplementary Fig. 4a–c). These results demonstrate that VGLL1 forms a complex with TEAD4 to regulate human TELC induction.
TEAD4 controls mouse and human trophoblast lineage specification by interacting with nuclear YAP and WWTR1 to regulate target gene expression11,56. To explore the potential functional relationship of different co-factors with TEAD4, we examined the interaction of TEAD4 with YAP and WWTR1 through co-immunoprecipitation in 4CL H9 ESCs and UH10 iPSCs. We observed that TEAD4 also interacts with them, but to a much lesser extent than with VGLL1 (Fig. 4e, Supplementary Fig. 3a). Notably, VGLL1 did not interact with YAP or WWTR1. Consistently, the knockdown of both YAP1 or WWTR1 hindered TELC induction (Supplementary Fig. 4d–k), indicating that TEAD4 recruits all three co-factors to regulate human TELC induction.
To further illuminate how VGLL1 works in tandem with TEAD4 along with other co-factors like YAP, we performed CUT&Tag for TEAD4 and YAP in TELC-D5 cells differentiated from 4CL H9 ESCs. Genome-wide binding analysis revealed that regions bound by TEAD4 and YAP were also largely located at the promoter, distal intergenic and intronic regions (Fig. 4f, g). Co-occupancy analysis between VGLL1, YAP and TEAD4 showed that VGLL1 and TEAD4 share a large number (43,048) of binding sites, among which 57 % were also co-bound by YAP (24,626) (Fig. 4h). This data correlates with the co-immunoprecipitation results indicating that TEAD4 interacts more strongly with VGLL1 than with YAP (Fig. 4e, Supplementary Fig. 3a). Genes co-bound by VGLL1, TEAD4 and YAP included cell cycle/self-renewal genes and TE-related genes (Fig. 4h). We then performed GO analysis for genes co-bound by all these three factors, and those bound by either two of them in TELC-D5 cells. VGLL1-TEAD4 only or VGLL1-TEAD4-YAP co-bound genes were enriched in terms related to placenta development, cell cycle regulation and, interestingly, histone acetylation, while YAP-TEAD4 only co-bound genes were enriched for other biological processes such as protein polyubiquitination and positive regulation of autophagy (Fig. 4i). The distribution of these three factors across the genome indicates that VGLL1 and YAP have both shared and unique functions. We also tested the subcellular localization of VGLL1, TEAD4 and YAP in TELC-D5 cells derived from 4CL H9 ESCs. Subcellular fractionation followed by Western blotting showed that VGLL1 and TEAD4 mainly localized in the nucleus (Supplementary Fig. 4l), while YAP was more restricted to the cytoplasm. The distinct subcellular distribution further supports that TEAD4 interact less with YAP compared to VGLL1.
These results demonstrate that VGLL1 functions as a strong co-factor for TEAD4 in addition to YAP and WWTR1, potentially adding more flexibility to safeguard TE development in human.
VGLL1 controls human TELC induction by promoting chromatin remodeling at target loci
We next aimed to elucidate the underlying mechanism by which VGLL1 and TEAD4 regulate the expression of TE genes. Gene expression is highly dependent on the enrichment of active histone marks at target loci and in recent years histone acetylation has emerged as a major regulator of cell (including PSC) fate transitions57. We thus tested whether VGLL1 knockdown affects histone acetylation in TELCs derived from 4CL H9 ESCs and UH10 iPSCs. Western blotting showed that total histone H3 acetylation (H3ac) and histone H4 acetylation (H4ac) levels were decreased upon VGLL1 depletion in TELC-D5 cells compared to the shLuc control (Fig. 5a and Supplementary Fig. 5a). Importantly, histone H3 lysine 27 acetylation (H3K27ac), which often marks promoters and enhancers of active genes, was also reduced upon VGLL1 knockdown. This finding suggested that VGLL1 is involved in H3K27ac deposition. Inspection of the sites co-occupied by VGLL1 and TEAD4 and H3K27ac showed a high degree of overlap, with 73.3% percent of VGLL1-TEAD4 co-bound sites displaying enriched H3K27ac (Fig. 5b). These loci included genes related to self-renewal and TE specification/function genes. Enriched GO terms corresponding to these shared loci belonged to categories related to placenta development and cell cycle (Fig. 5c).
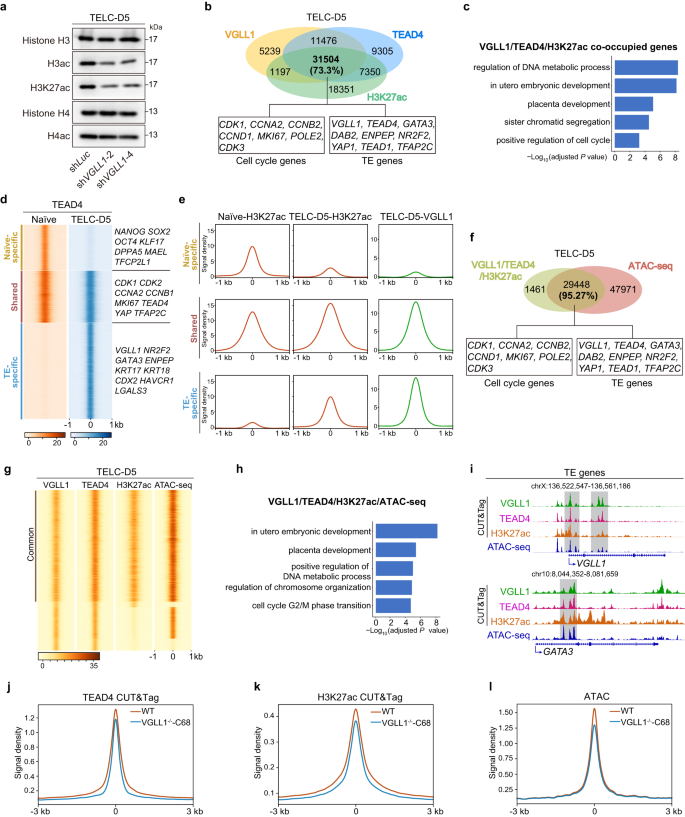
a Western blotting analysis for the indicated histone marks in 4CL H9 ESCs transduced with shLuc, shVGLL1−2 or shVGLL1−4 at day 5 of TELC differentiation. Representative of three independent experiments. b Venn diagram showing the overlap between VGLL1- and TEAD4-bound sites and H3K27ac-enriched sites in CUT&Tag of TELC-D5 cells differentiated from 4CL H9 ESCs. Representative cell cycle and TE genes corresponding to the overlapping regions are shown in the boxes. c Enriched GO terms for VGLL1, TEAD4 and H3K27ac co-occupied genes in CUT&Tag of TELC-D5 differentiated from 4CL H9 ESCs. P value was calculated using a hypergeometric test (one-sided) and adjusted for multiple testing using the Benjamini-Hochberg correction. d Co-occupancy analysis by signal density pileups of TEAD4 CUT&Tag peaks in 4CL H9 ESCs and TEAD4 CUT&Tag peaks in TELC-D5 cells differentiated from them. Peaks were divided into three categories: naïve-specific, shared and TE-specific. Example genes are shown for each category. e Signal intensity of H3K27ac in 4CL H9 ESCs (Naïve-H3K27ac) and TELC-D5 cells (TELC-D5-H3K27ac), and VGLL1 in TELC-D5 cells (TELC-D5-VGLL1) from the three categories defined in d. f Venn diagram showing the overlap between VGLL1- and TEAD4-binding at H3K27ac-enriched sites in CUT&Tag with chromatin accessibility peaks (ATAC-seq) in TELC-D5 cells differentiated from H9 4CL naïve ESCs. Representative cell cycle and TE genes corresponding to the overlapping regions are shown in the boxes. g Co-occupancy analysis by signal density pileups of VGLL1, TEAD4, H3K27ac CUT&Tag peaks and chromatin accessibility (ATAC-seq) peaks in TELC-D5 cells differentiated from 4CL H9 ESCs. h Enriched GO terms for open chromatin genes (ATAC-seq) co-occupied by VGLL1, TEAD4 and H3K27ac (CUT&Tag) of TELC-D5 cells differentiated from 4CL H9 ESCs. P value was calculated using a hypergeometric test (one-sided) and adjusted for multiple testing using the Benjamini-Hochberg correction. i Genome browser tracks showing VGLL1, TEAD4, H3K27ac genomic enrichment peaks (CUT&Tag) and chromatin accessibility peaks (ATAC-seq) for representative TE gene loci of TELC-D5 cells differentiated from 4CL H9 ESCs. j Signal intensity of TEAD4 at VGLL1-bound sites in WT and VGLL1-KO clone 68 (VGLL1-/--C68) at day 5 of TELC induction from 4CL H9 ESCs. k Signal intensity of H3K27ac at VGLL1-binding sites in WT and VGLL1-KO clone 68 (VGLL1-/--C68) at day 5 of TELC induction from 4CL H9 ESCs. l Signal intensity of chromatin openness at VGLL1-binding sites in WT and VGLL1-KO clone 68 (VGLL1-/--C68) at day 5 of TELC induction from 4CL H9 ESCs.
To better understand the relationship between TEAD4 and VGLL1 co-binding with H3K27ac enrichment, we also performed CUT&Tag for TEAD4 and H3K27ac in naïie PSCs. We first compared the TEAD4 binding pattern between 4CL H9 ESCs and TELC-D5 cells and identified three categories (naïve-specific-, shared- and TE-specific loci) of TEAD4-binding peaks (Fig. 5d). Naïve ESC-specific TEAD4-bound genes included pluripotency transcription factors such as OCT4, SOX2, KLF17 and DPPA5, consistent with the observation that TEAD4 buffers pluripotency genes in human PSCs58. Shared TEAD4-bound genes included many cell-cycle regulators and naïve/TE-shared genes such as CDK1, MKI67, TEAD4 and TFAP2C. As expected, the largest number of genes corresponded to TE-specific TEAD4-bound genes, which included many TE-enriched genes like VGLL1, GATA3, CDX2 and NR2F2. Next, we performed a signal density pile-up analysis for H3K27ac (naïve ESCs and TELC-D5 cells) and VGLL1 (TELC-D5 cells) occupancy based on the categories of the identified TEAD4-binding peaks (Fig. 5e). Notably, we observed that H3K27ac levels in naïve-specific TEAD4-bound genes were high in naïve ESCs but low in TELC-D5 cells. In contrast, H3K27ac levels in shared and TE-specific TEAD4-bound genes were increased in TELC-D5 cells, being more obviously in the latter case.
Because high H3K27ac levels influence target gene expression at least in part by increasing local chromatin accessibility59, we also did an assay for transposase-accessible chromatin using sequencing (ATAC-seq) for TELC-D5 cells differentiated from 4CL H9 ESCs. This showed that 95.27% of the loci co-bound by VGLL1-TEAD4 and enriched with H3K27ac display accessible chromatin (Fig. 5f, g). The regions with overlapping peaks included genes involved in placenta development and cell cycle regulation (Fig. 5h, i and Supplementary Fig. 5b, c). On the contrary, open chromatin regions only bound by VGLL1 or TEAD4 were mostly related with other lineages (Supplementary Fig. 5d-f). Of note, VGLL1 and TEAD4 were also bound by themselves and enriched for H3K27ac, indicating a positive feedback regulation (Fig. 5i and Supplementary Fig. 5c). To provide more evidence of the functional cooperation between VGLL1 and TEAD4 and the role of VGLL1 in histone acetylation, we measured TEAD4 binding and H3K27ac enrichment using CUT&Tag and chromatin accessibility using ATAC-seq in VGLL1 KO cells at day 5 of TELC induction from 4CL H9 ESCs. In VGLL1 KO cells, the average genome binding intensity of TEAD4 and the enrichment of H3K27ac at VGLL1-binding sites declined compared to WT cells (Fig. 5j, k). Along with the decrease of H3K27ac marks, the chromatin accessibility at these regions was also reduced in VGLL1 KO cells (Fig. 5l).
Overall, we have demonstrated that TEAD4 becomes redistributed in TELCs compared to naïve PSCs and highlighted a link between VGLL1 recruitment by TEAD4 at target loci and chromatin opening through increased histone acetylation.
VGLL1 is necessary to sustain the expandable human TSC identity
Upon implantation, the TE develops into the mononucleated cytotrophoblast. Cytotrophoblast cells self-renew while simultaneously produce the multinucleated syncytiotrophoblast (SCT) cells and the highly invasive extravillous trophoblast (EVT) cells, both of which are critical for forming the placenta. To further enhance our understanding about the role of VGLL1 in early human placenta development, we tested whether it also functions in maintaining TSC identity. We performed TSC derivation from 4CL H9 ESCs using a previously described medium15. TELC-D5 cells were cultured in this medium for another 5-7 days to convert them into stable and expandable TSCs, which expressed VGLL1, TEAD4, YAP and showed loss of pluripotency genes like NANOG, OCT4 and SOX2 at the protein level (Fig. 1a, Fig. 1i and Supplementary Fig. 6a). Consistent with the findings in TELCs, VGLL1 was among the highest expressed genes in TSCs compared to naïve ESCs, as assessed by bulk RNA-seq and validated with RT-qPCR (Supplementary Fig. 6b-d). Likewise, VGLL1 knockdown compromised TSC self-renewal as detected by a change in cell morphology and reduced proliferation compared to the shLuc control (Fig. 6a, b and Supplementary Fig. 6e, f). Bulk RNA-seq analysis also showed that cell cycle- and TSC-related (e.g., GATA3, CAPN6, GCM1) genes were downregulated in VGLL1 depleted cells (Fig. 6c). GO analysis for downregulated genes in VGLL1 knockdown cells included biological processes such as cell cycle regulation and placenta development (Fig. 6d). The need for VGLL1 was further validated by performing shRNA knockdown in UH10 iPSCs and embryo blastocyst-derived TSCs (TSCBT)15 (Supplementary Fig. 6g-l). To assess the functional role of VGLL1 during SCT and EVT differentiation, expandable TSCs derived from TELCs differentiated from 4CL H9 ESCs were transduced with two effective shRNAs for VGLL1 along with shLuc as control. Subsequently, SCT and EVT differentiation were carried out at the time of shRNA transduction as previously described60. VGLL1 knockdown resulted in reduced cell proliferation, widespread cell death and failure to differentiate into SCT or EVT cells, while the control (shLuc) cells successfully differentiated and they expressed specific markers, SDC1 for SCT and HLA-G for EVT (Supplementary Fig. 6m, n). This demonstrates the importance of VGLL1 in maintaining the functional potential of TSCs.
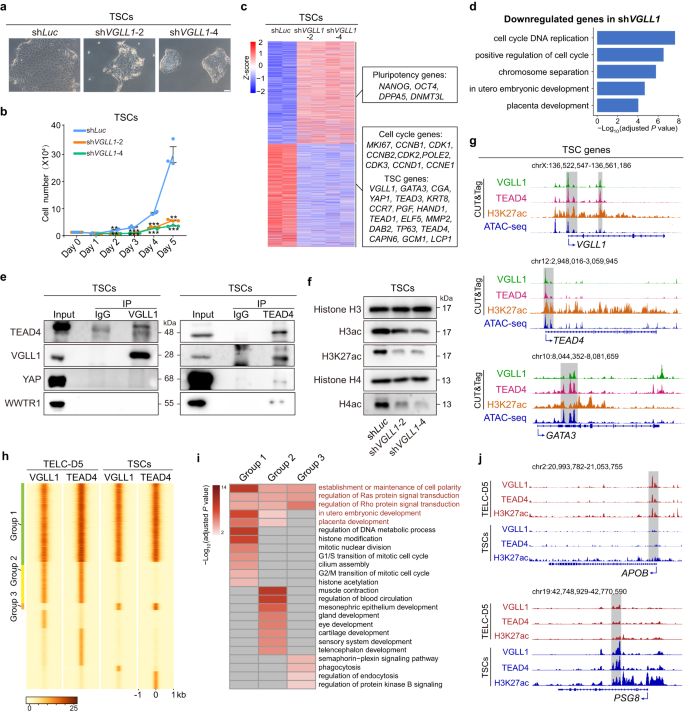
a Phase contrast images of 4CL H9 ESC-derived TSCs transduced with shLuc, shVGLL1-2 or shVGLL1-4. Scale bar, 100 µm. Representative of three independent experiments. b Analysis of cell numbers for 4CL H9 ESC-derived TSCs transduced with shLuc, shVGLL1-2 or shVGLL1-4. Data are presented as the mean ± SEM, n = 3 biological replicates. P value was calculated using a two-tailed unpaired Student’s t-test, ***P < 0.001, **P < 0.01, *P < 0.05. c Heatmap showing the expression of pluripotency, cell cycle and TSC genes for the indicated conditions. Example genes are shown for each cluster in the boxes. n = 2 biological replicates. d Enriched GO terms for downregulated genes in shVGLL1 compared to shLuc control in 4CL H9 ESC-derived TSCs. P value was calculated using a hypergeometric test (one-sided) and adjusted for multiple testing using the Benjamini-Hochberg correction. e Immunoprecipitation using 4CL H9 ESC-derived TSC lysates with anti-VGLL1 (left panel) or anti-TEAD4 (right panel) and subsequent Western blotting with anti-TEAD4, anti-VGLL1, anti-YAP and anti-WWTR1. Representative of three independent experiments. f Western blotting for the indicated histone marks for shVGLL1-2 and shVGLL1-4 compared to the shLuc control in 4CL H9 ESC-derived TSCs. Representative of three independent experiments. g Genome browser tracks showing VGLL1, TEAD4, H3K27ac genomic enrichment peaks (CUT&Tag) and chromatin accessibility peaks (ATAC-seq) for representative TSC genes loci in 4CL H9 ESC-derived TSCs. h Co-occupancy analysis by signal density pileups of VGLL1, TEAD4 binding in 4CL H9 ESC-derived TELC-D5 cells and TSCs. The three major groups are: group 1 (common between TELC-D5 and TSC), group 2 (TELC-specific) and group 3 (TSC-specific). For clarity, other groups are not labelled. i Enriched GO terms for groups 1, 2 and 3 of panel h. P value was calculated using a hypergeometric test (one-sided) and adjusted for multiple testing using the Benjamini-Hochberg correction. j Genome browser tracks showing VGLL1, TEAD4 and H3K27ac genomic enrichment peaks (CUT&Tag) in 4CL H9 ESC-derived TELC-D5 cells and TSCs for representative gene loci from group 2 (upper panel) and group 3 (lower panel).
To study the regulatory mechanism of VGLL1 in maintaining TSC identity, we first confirmed the interaction between VGLL1 and TEAD4 in TSCs derived from H9 ESCs and UH10 iPSCs by performing reciprocal co-immunoprecipitation (Fig. 6e and Supplementary Fig. 7a). Consistent with TELC-D5 cells, TEAD4 showed stronger interaction with VGLL1 compared with YAP and WWTR1, even though their knockdown also compromised TSC identity (Supplementary Fig. 7b–i). In addition, we studied whether the subcellular localization of VGLL1 and TEAD4 is similar to TELC-D5 cells. Unlike TELCs, VGLL1 was evenly distributed between the nucleus and cytoplasm in TSCs, while TEAD4 tended to localize more in the nucleus (Supplementary Fig. 7j). Additionally, we demonstrated that TEAD4 is important for preserving TSC identity by performing shRNA knockdown in TSCs derived from different PSC lines and TSCBT (Supplementary Fig. 7k–u). These results indicate that TEAD4 is also required to safeguard TSC differentiation potential (Supplementary Fig. 7v, w).
We then performed CUT&Tag for VGLL1 and TEAD4 in H9 TSCs and noticed that as in TELC-D5 cells, they share a large proportion (~80%) of genomic binding sites (Supplementary Fig. 8a). Similarly, TEAD4 was one of the most enriched motifs at VGLL1-bound sites (Supplementary Fig. 8b). We also noticed a decrease in the global levels of H3ac, H3K27ac and H4ac levels upon VGLL1 knockdown in H9 ESCs and UH10 iPSCs (Fig. 6f and Supplementary Fig. 8c). A large proportion of VGLL1- and TEAD4-shared regions corresponded to H3K27ac CUT&Tag peaks (80.7%) and chromatin accessible regions detected by ATAC-seq (93.17% of VGLL1, TEAD4 and H3K27ac shared sites), and these genes were related to placenta development and cell cycle (Fig. 6g and Supplementary Fig. 8d–i).
To explore a potential functional difference of the VGLL1-TEAD4 complex in TELCs and TSCs, we compared the binding pattern of VGLL1 and TEAD4, which showed different groups. Group 1 peaks, which take up a substantial proportion of VGLL1 and TEAD4 co-bound loci, were shared between TELCs and TSCs (Fig. 6h). Group 2 peaks were co-bound by VGLL1 and TEAD4 only in TELCs, while group 3 were co-bound by VGLL1 and TEAD4 only in TSCs. Group 1 peaks included genes with functions mostly related to placenta development, cell cycle regulation, histone modification and especially histone acetylation (Fig. 6i), consistent with our functional study in TELCs and TSCs. Group 2 peaks corresponded to genes involved not only in placenta development but also in various other developmental processes such as mesonephric epithelium development and sensory system development. We speculate that binding of VGLL1 and TEAD4 at these genes correlates with an unstable preliminary extraembryonic cell fate, in which the chromatin regions of different lineage genes are still accessible for binding. In this regard, TE cells isolated from human blastocysts have the capacity to develop into ICM cells and express NANOG, suggesting that their identity is not yet fully committed61. Group 3 peaks comprised genes participating in signaling pathways and functional terms like phagocytosis and endocytosis. Consistent with the notion that VGLL1-TEAD4 co-bound sites are enriched with H3K27ac, we found that this active histone mark was also positively correlated with VGLL1-TEAD4 binding sites for group 2 and group 3. For example, genes like APOB and GREM2 are bound by the VGLL1-TEAD4 complex only in TELCs (group 2) and their promoter and enhancer regions were also enriched for H3K27ac (Fig. 6j and Supplementary Fig. 8j). On the contrary, genes like PSG8 and PSG1 were co-bound by VGLL1 and TEAD4 in TSCs (group 3), with higher adjacent H3K27ac levels.
We have demonstrated that the function of the tandem VGLL1-TEAD4 in controlling self-renewal and cell identity is conserved in both TELCs and TSCs derived from human naïve PSCs, although there are differences between both cell types.
VGLL1-TEAD4 cooperate with GATA3 and TFAP2C to control the human TELC gene regulatory network
Cellular states are maintained by master gene regulatory networks (GRNs) consisting of key transcription factors and co-regulators62. It is known that the transcription factors GATA3 and TFAP2C are essential regulators of mouse and human TE specification63,64. TEAD4, GATA3 and TFAP2C are required for activating CDX2 expression and inducing TE lineage specification in mouse preimplantation embryos and GATA3 binds to the VGLL1 promoter to promote its expression in human trophoblast progenitors65. The regulatory network of TEAD4, GATA3 and TFAP2C in human models has not been studied in detail yet. To elucidate whether the VGLL1-TEAD4 complex acts synergistically with these two transcription factors, we performed CUT&Tag for GATA3 and TFAP2C in human TELC-D5 cells differentiated from 4CL H9 ESCs and compared it with the genome-wide binding of VGLL1 and TEAD4. Pairwise comparison showed that VGLL1 and TEAD4 shared 79.47% and 69.62%, respectively, of their binding sites with GATA3, and less than 50% with TFAP2C (49.12% and 45.52%, respectively), suggesting a stronger functional correlation between VGLL1, TEAD4 and GATA3 (Fig. 7a). In line with this, TE gene induction was impaired when GATA3 was knocked down during the TELC induction (Supplementary Fig. 8k, l). Besides, we noticed a relatively lower co-binding between GATA3 and TFAP2C (37.98%), indicating that they bind to the VGLL1-TEAD4 complex both independently and in combination (Fig. 7a). A four-way Venn diagram comparison of the binding pattern of these four transcription factors showed the largest overlaps among VGLL1-TEAD4-GATA3-TFAP2C and VGLL1-TEAD4-GATA3 bound loci, whereas VGLL1-TEAD4-TFAP2C had a smaller overlap (Fig. 7b). Further investigation revealed that genes co-bound by all four factors were related to placenta development, cell growth regulation and histone modification (Fig. 7c), whereas genes co-bound by VGLL1-TEAD4-GATA3 were associated with multiple lineage development (Fig. 7d). These results suggest that the VGLL1-TEAD4 complex may function as an interacting hub for other human TE regulators including GATA3 and TFAP2C. Supporting these observations, co-immunoprecipitation showed interaction between these four factors in TELC-D5 cells (Supplementary Fig. 8m). Besides, the binding motifs of TEAD4, GATA3 and TFAP2C were all enriched in VGLL1-bound sites, TEAD4 and TFAP2C motifs were enriched in GATA3-bound sites, and TEAD4 and GATA3 motifs were enriched in TFAP2C-bound sites (Fig. 4d and Fig. 7e, f). We also identified that VGLL1, TEAD4, GATA3 and/or TFAP2C co-bound genes were related to TE/TSC identity (Fig. 7g). Additionally, we observed binding of these factors at their own regulatory regions, pointing at positive feedback mechanisms. These results provide additional insights on the role of VGLL1 as a master regulator of human early placenta formation.
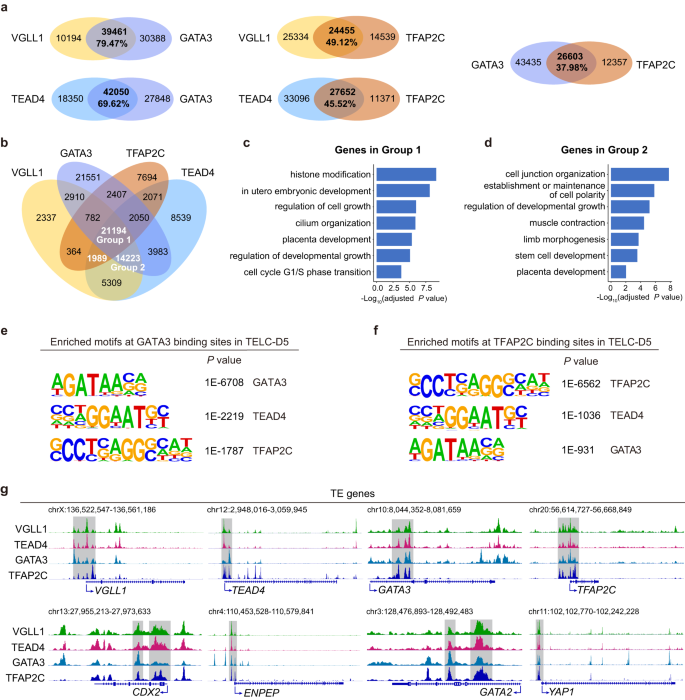
a Venn diagram showing the pairwise overlap between VGLL1-, TEAD4-, GATA3- and TFAP2C-bound sites in 4CL H9 ESC-derived TELC-D5 cells. b Four-way venn diagram showing the overlap between VGLL1-, TEAD4-, GATA3-, and TFAP2C- bound sites in 4CL H9 ESC-derived TELC-D5 cells. c Enriched GO terms for genes in Group 1 of panel b. P value was calculated using a hypergeometric test (one-sided) and adjusted for multiple testing using the Benjamini-Hochberg correction. d Enriched GO terms for genes in group 2 of panel b. P value was calculated using a hypergeometric test (one-sided) and adjusted for multiple testing using the Benjamini-Hochberg correction. e Motif analysis using HOMER showing the significantly enriched DNA-binding motifs at GATA3-binding sites in 4CL H9 ESC-derived TELC-D5 cells. P value was calculated using a hypergeometric test (one-sided). f Motif analysis using HOMER showing the significantly enriched DNA-binding motifs at TFAP2C-binding sites in 4CL H9 ESC-derived TELC-D5 cells. P value was calculated using a hypergeometric test (one-sided). g Genome browser tracks showing VGLL1, TEAD4, GATA3 and TFAP2C binding in 4CL H9 ESC-derived TELC-D5 cells for representative TE loci.
- SEO Powered Content & PR Distribution. Get Amplified Today.
- PlatoData.Network Vertical Generative Ai. Empower Yourself. Access Here.
- PlatoAiStream. Web3 Intelligence. Knowledge Amplified. Access Here.
- PlatoESG. Carbon, CleanTech, Energy, Environment, Solar, Waste Management. Access Here.
- PlatoHealth. Biotech and Clinical Trials Intelligence. Access Here.
- Source: https://www.nature.com/articles/s41467-024-44780-8