Animals and treatments
2 ~ 24-week-old C57BL/6N male mice, 10-week-old C57BL/6N female mice, and 10-week-old BALB/c (000651, The Jackson Laboratory) male mice were purchased from JA BIO Incorporation (Suwon-si, Gyeonggi-do, Republic of Korea). CD1d KO78 and Jα18 KO40 mice were gifted by Doo Hyun Chung (Seoul National University College of Medicine, Seoul, Republic of Korea). CD45.1 (002014, The Jackson Laboratory) and 4Get mice (004190, The Jackson Laboratory) were gifted by Ro Hyun Seong (Seoul National University, Seoul, Republic of Korea). 8 ~ 14-week-old adipocyte lineage-tracing mice (adiponectinrtTA (033448, The Jackson Laboratory); TRE-Cre (006234, The Jackson Laboratory); rosa26-loxp-stop-loxp-YFP (006148, The Jackson Laboratory)) (CL57BL/6J) were obtained from the UNIST. The mice were housed in a specific pathogen-free, temperature- (22 °C) and humidity- (50%) controlled animal facility under a 12-h/12-h light/dark cycle. High-fat diet (HFD) feeding experiments were performed using mice older than 8 weeks of age and fed a diet consisting of 60% calories from fat (D12492, Research Diets). Adipocyte lineage tracing mice were fed a doxycycline (600 mg/kg)-containing NCD for 2 weeks from 8 weeks of age. To expand adipose iNKT cells in vivo, mice were intraperitoneally injected with α-galactosylceramide (α-GC) (1 μg/mouse, AG-CN2-0013, AdipoGen) and sacrificed after 1 week. Amphiregulin (1 μg/mouse, 989-AR, R&D Systems) or Gefitinib (20 mg/kg, S1025, Selleckchem) was intraperitoneally injected once a day for three consecutive days and mice were sacrificed on the next day. The animal studies were approved by the Institutional Animal Care and Use Committee of the Seoul National University.
Human participants
Human omental adipose tissue samples were obtained during weight reduction laparoscopic bypass surgery at the Metabolic Surgery Center in Seoul National University Bundang Hospital (SNUBH). This study was conducted in accordance with the Declaration of Helsinki and was approved by the Ethics Committee of the SNUBH (IRB No. B-1801445301 & B-1812513302). All participants provided their written informed consent. All participants were female, aged 30-50 years, and BMI between 35-50 kg/m2. Tissue samples consisted of 25-mg tissue blocks. The processing of the tissues was initiated within 3 hours after removal from the patients without snap-frozen or cryo-preservation.
scRNA-seq library preparation
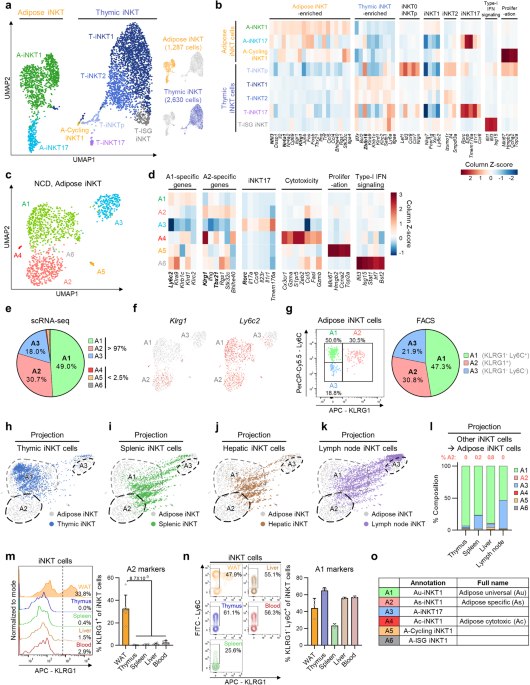
iNKT cells (TCRβint/CD1d.PBS57 tetramer+) were sorted from stromal vascular fraction (SVF) of epididymal white adipose tissue and cell suspension from thymus by flow cytometry (Supplementary Fig. 1a). Tissue processing procedures are described below in adipose tissue fractionation and lymphocyte preparation sections. The sequencing library was generated using Chromium Single Cell 5’ Library & Gel Bead Kit (PN-1000014, 10X Genomics), Chromium Single Cell A Chip kit (PN-1000009, 10X Genomics), and Chromium i7 Multiplex Kit (PN-120262, 10X Genomics). Single-cell suspension was loaded on the Single Cell A Chip (10X Genomics) and run in the Chromium Controller to generate gel bead-in-emulsions (GEMs) aiming to capture 4000 cells per channel. Following reverse transcription was performed using C1000 thermocycler (Bio-Rad). Subsequent cDNA purification and library generation were performed according to the manufacturer’s instructions provided. To generate single-cell TCR sequencing library, 1/22.5 of total cDNA was used for V(D)J target enrichment PCR with mouse T cell specific primer set (PN-1000071, 10X Genomics). The quality of libraries was confirmed using a Bioanalyzer High Sensitivity DNA kit (5067-4626, Agilent). Libraries were sequenced on an Illumina HiSeqX10 (paired-end 100 bp reads) aiming at an average of 50,000 read pairs (transcriptome libraries) or 5000 read pairs (TCR libraries) per cell.
scRNA-seq data analysis
Raw reads of sorted iNKT cells were mapped to a mouse reference genome (GRCm38) using the Cell Ranger software (v3.1.0) and the GRCm38.99 GTF file. A gene-by-cell count matrix for each sample was generated with default parameters, except for expected cells = 4000, 3000 (Adipose 1wHFD), or 2500 (Adipose 8wHFD). Empty droplets were excluded using the emptyDrops function of the DropletUtils (v1.6.1) R package79 with a false discovery rate (FDR) < 0.05. To filter out poor quality cells, cells with less than 1000 unique molecular identifiers (UMIs) and higher than 10% of UMIs mapped to mitochondrial genes were excluded using the calculateQCMetrics function of the scater (v1.14.0) R package80. To remove cell-specific biases, cell-specific size factors were calculated using the computeSumFactors function of the scran (v1.14.6) R package81. The aggregated UMI count matrix were divided by cell-specific size factors and log2 transformed by adding a pseudocount of highly variable genes (HVGs) which were defined as genes with FDR < 0.05 for biological variability using the modelGeneVar function of the scran package. All cells across the samples were clustered into 21 clusters using the FindClusters function of the Seurat (v3.1.5) R package82 on the first 15 principal components (PCs) of HVGs with resolution = 0.8. Clusters annotated as non-T and CD8+ T cell clusters were removed. After removing non-iNKT cell clusters, cells were grouped into 15 clusters using the same method described above with the first 20 PCs. Cells annotated as non-T, gamma delta T, innate lymphoid cell, CD8+ T cell clusters were excluded. Cells were regrouped into 13 clusters using the same method as described above with the first 15 PCs. Cells in the normal chow diet (NCD) and only adipose iNKT cells of NCD were grouped into 10 and 8 clusters, respectively, and visualized in the UMAP plot using the same method, with the first 15 PCs of 1000 HVGs. Cells in adipose iNKT cells across diet conditions were clustered into 9 clusters and visualized in the UMAP plot using same method except for the first 15 PCs of HVGs with FDR < 0.05 for biological variability.
To identify cell type-specific marker genes, the FindAllMarkers function of the Seurat package was used. Cell type signature score was calculated by the AddModuleScore function of the Seurat package. For gene ontology analysis, a database for annotation, visualization and integrated discovery (DAVID)83,84 was used. To project thymic, splenic, hepatic, and lymph node iNKT cells onto NCD adipose iNKT cells, for every non-adipose iNKT cell, k-Nearest Neighbors (k-NNs, k = 5) were inferred from NCD adipose iNKT cells with respect to the Pearson correlation coefficients of normalized expression data of HVGs for NCD adipose iNKT cells by using the knn.index.dist function of the KernelKnn (v1.0.8) R package85. To obtain the projection coordinate of non-adipose iNKT cells in UMAP plot, two-dimensional coordinates of 5-NNs in the UMAP plot of NCD adipose iNKT cells were averaged. Pseudotime analysis was performed for adipose iNKT cells using the slingshot (v1.4.0) R package86 based on the UMAP coordinates. To obtain a differentiation trajectory, the getLineages function of the slingshot R package was used with setting a start cluster as Au-iNKT1, and an ending cluster as Ac-iNKT1.
TCR repertoire analysis
Raw reads from paired V(D)J sequencing were processed using the cellranger vdj function of the Cell Ranger software (v3.1.0). To construct V(D)J segment-based reference, cellranger mkvdjref function of the Cell Ranger was used with mouse V(D)J segment sequences from international ImMunoGeneTics information system (IMGT). For further analysis, we used contigs assigned as productive and high-confidence. Cells sharing the same V/J composition and identical CDR3 sequences both in heavy and light chains are regarded as the same clonotype. To calculate normalized diversity index, the ComputeShannonIndex function of the Stcr R package87 was processed. CDR3 logo sequences were visualized by using WebLogo (v3.7.4).
Adipose tissue fractionation
Epididymal white adipose tissue (WAT) were obtained from age-matched NCD-fed and 1- or 8-week HFD-fed mice. Adipose tissues were fractionated as described previously88, with minor modifications. Briefly, adipose tissues were minced and digested with collagenase buffer [0.1 M HEPES (Sigma-Aldrich), 0.125 M NaCl, 5 mM KCl, 1.3 mM CaCl2, 5 mM glucose, 1.5% (w/v) bovine serum albumin (BSA) (A0100-010, GenDEPOT), and 0.1% (w/v) collagenase I (49A18993, Worthington)] in a shaking incubator at 37 °C for 30 min. After centrifugation at 450 × g, 4°C for 3 min, the pelleted SVF was collected. The SVF was incubated in red blood cell (RBC) lysis buffer (17 mM Tris, pH 7.65, and 0.16 M NH4Cl) for 3 min. Then, the SVFs were washed with phosphate-buffered saline (PBS) several times, passed through a 100-μm filter (93100, SPL), and collected by centrifugation at 450 × g for 3 min.
Isolation of SVFs from human adipose tissue
Human adipose tissues were rinsed in PBS twice, manually minced, and digested with collagenase buffer [0.1 M HEPES, 0.125 M NaCl, 5 mM KCl, 1.3 mM CaCl2, 5 mM glucose, 1.5% (w/v) BSA, and 0.1% (w/v) collagenase I] in a shaking water bath at 37 °C for 30–60 min. The subsequent steps were the same as those for preparing mouse adipose tissue fractionation.
Lymphocyte preparation from liver, spleen, thymus, and blood
Liver mononuclear cells (MNCs) were isolated using Percoll gradient as previously described89. Briefly, liver was gently passed through a nylon mesh and suspended in PBS. The cell suspension was centrifuged at 450 × g, 4°C for 3 min. The obtained cell pellet was resuspended in 40% Percoll (17-0891-01, Cytiva). Resuspended cell solution was carefully layered onto 70% Percoll and centrifuged at 800 × g, room temperature (RT) for 20 min with no break. MNCs were isolated from the middle layer. Then, the MNCs were washed with PBS several times, passed through a 100-μm filter (93100, SPL), and collected by centrifugation at 450 × g for 3 min.
To isolate thymic or splenic lymphocytes, the thymus or spleen was mechanically disrupted in between two glass slides. Obtained cell suspension was centrifuged at 450 × g, 4°C for 3 min. The cell pellet was incubated in RBC lysis buffer for 3 min, washed with PBS several times, passed through a 100-μm filter, and collected by centrifugation at 450 × g for 3 min.
To isolate blood MNCs, blood samples were collected in a Greiner Leucosep tube (GN163290, Sigma Aldrich) pre-equilibrated with 3 mL of NycoPrep 1.077 (1114550, Axis-Shield PoC AS). After centrifugation at 450 × g, RT for 10 min, the middle layer was carefully isolated, washed with PBS several times, passed through a 100-μm filter, and collected by centrifugation at 450 × g for 3 min.
Fluorescence-activated cell sorting (FACS)
FACS was carried out as previously described88, with minor modifications. Single-cell suspensions were incubated in Fc-receptor blocking antibody (1:300, 101302, BioLegend) at RT for 15 min prior to surface antigen staining. Then, the cells were stained with anti-TCR β chain (1:300, 109220, BioLegend), CD1d.PBS57 tetramer (1:300, NIH Tetramer Core Facility), anti-KLRG1 (1:300, 138412 or 138418, BioLegend), anti-Ly6C (1:300, 128006 or 128012, BioLegend), anti-CX3CR1 (1:300, 149020 or 149016, BioLegend), anti-CD45.1 (1:300, 110722, BioLegend), anti-human CD3 (1:300, 300317, BioLegend), or anti-human TCR Vα24-Jα18 (1:300, 342903, BioLegend) at 4°C for 30 min. To detect intracellular proteins, the SVFs were fixed, permeabilized with Foxp3 / Transcription Factor Staining Buffer Set (00-5523-00, Thermo Fisher), and stained with anti-T-bet (1:100, 644810, BioLegend), anti-PLZF (1:100, 53-9320-80, Thermo Fisher), anti-RORγt (1:100, 25-6981-82, Thermo Fisher), or anti-Ki-67 (1:300, 151212, BioLegend) for 30 min. To detect cytokines, fixed and permeabilized cells were stained with anti-IFNγ (1:100, 557649, BD), anti-TNFα (1:100, 506324, BioLegend), or anti-IL-17A (1:100, 506922, BioLegend) for 30 min. Adipose stem cells were identified by anti-CD45 (1:300, 103132, BioLegend), anti-CD31 (1:300, 102410, BioLegend), and anti-PDGFRα (1:300, 562776, BD) among SVFs and their proliferation was assessed by anti-Ki-67 (1:200, 151212, BioLegend). The cells were analyzed or sorted using a FACS Canto II instrument (BD Biosciences) or FACS Aria II instrument (BD Biosciences), respectively. Analysis of the flow cytometry data was done by FlowJo software (FlowJo v10). Gating strategies are provided in Supplementary Fig. 7a, b.
Intracellular cytokine staining
To investigate cytokine production of adipose iNKT cells, WAT was digested as described above, and SVF was activated as described previously32, with minor modifications. Briefly, SVF was cultured for 4–6 hours in the presence of phorbol 12-myristate 13-acetate (50 ng/ml, P8139, Thermo Fisher), Ionomycin (1 μg/ml, I0634, Thermo Fisher), and Brefeldin A (5 μg/ml, 420601, BioLegend). Cultures were in complete RPMI media [10% fetal bovine serum (FBS) (Young In Frontier), 1% penicillin/streptomycin (Welgene), 10 mM HEPES, 1% non-essential amino acid (Welgene), 1 mM sodium pyruvate, 50 μM β-mercaptoethanol, and 2 mM L-glutamine]. The cells were washed with PBS, stained and analyzed by FACS Canto II instrument as described above.
Generation of primary iNKT cells
Primary iNKT cells were prepared as reported previously90. Briefly, the sorted TCRβint/CD1d.PBS57 tetramer+ iNKT cells from spleen were stimulated with anti-CD3e (3 μg/mL, 14-0031-82, Thermo Fisher) and anti-CD28 antibodies (1 μg/mL, 10312-20, Biogems) for three days and then expanded with mouse recombinant IL-2 (10 ng/mL, 212-12, Peprotech) and IL-7 (10 ng/mL, 217-17, Peprotech) for 10 days in complete RPMI media described above. The culture media of primary iNKT cells were changed every two day.
iNKT cell adoptive transfer
Primary iNKT cells (~5 × 10⁵ cells/mouse), prepared as indicated above, were intravenously injected into 3- or 8-week-old male mice and analyzed after 8 weeks. In vivo-expanded Adipose iNKT cell subpopulations (donor cells) were purified by FACS from WAT of WT or CD45.1 male mice 1 week after α-GC injection. Each adipose iNKT cell subpopulation was concentrated to ~1000 cells/μl by centrifugation. Donor cells (20 μl) were injected into the fat pads of WT C57BL/6 adult male mice. Donor CD45.1+ cells were harvested from the recipient animals 3 weeks after transplantation and subjected to FACS analysis.
Coculture
3T3-L1 pre-adipocytes were grown to confluence and then differentiated in 96- or 48-well culture plates. During differentiation, the cells were incubated in adipogenic medium [Dulbecco’s modified Eagle’s medium (DMEM) containing 10% FBS, 1 μM dexamethasone, 520 μM Isobutylmethylxanthine, and 850 nM insulin]. Two days after adipogenic induction, the cells were treated with FI medium [DMEM containing 10% FBS and 850 nM insulin] for two days. Differentiated 3T3-L1 adipocytes were treated with FFA (500 μM) as previously described41. Briefly, FFAs (palmitic acid or oleic acid) were dissolved in ethanol and diluted in DMEM low glucose media containing 1% FBS and 2% BSA at 55 °C for 10 min. BSA-conjugated FFA-containing media were used for challenging differentiated 3T3-L1 adipocytes for 2 weeks and media were changed every two days. For 3T3-L1 adipocyte and iNKT cell coculture experiment, iNKT cell subpopulations were sorted after in vivo iNKT cell expansion as indicated above and stained with CellTracker™ Green CMFDA Dye (C2925, Thermo Fisher) at 37°C for 30 min. 104 of stained iNKT cells were cocultured with FFA-challenged 3T3-L1 adipocytes with or without anti-CD1d antibody (20 μg/ml, BE0000, Bio X Cell) in 48 well plate. After 3 days of coculture, the cells were incubated with Hoechst 33342 (1:1000, H3570, Thermo Fisher) and propidium iodide (PI) (1:200, 51-66211E, Thermo Fisher) at 37°C for 20 min in the dark. The cells were imaged and quantified using a CQ1 microscope (Yokogawa). Diameters of lipid droplets were calculated by Image J software.
Immunohistochemistry
Whole-mount imaging was carried out as previously described with minor modifications18. Whole epididymal WAT was fixed in 4% paraformaldehyde for overnight and blocked with PBS containing 5% horse serum and 0.3% Triton X-100 for 1 hour. The fixed tissues were incubated with primary antibodies against GFP (1:1000, NB100-62622, Novus Biologicals) and perilipin (1:1000, 20R-PP004, Fitzgerald) at 4°C overnight. The tissues were then washed three times for 10 min each, incubated with secondary antibodies (1:1000, A-21099, Thermo Fisher and 1:1000, ab6904, Abcam) and Hoechst 33342 at RT for 4 hours, washed three times for 10 min each, and mounted on slides in 8-well plates (155409, Nunc Lab-Tek II). Tissues were observed and imaged using a CQ1 microscope. Diameters of lipid droplets were calculated by Image J software.
For immunohistochemistry, small fractions of fat tissues were isolated from mice, fixed in 4% paraformaldehyde, and embedded in paraffin. The paraffin blocks were cut into 5-μm sections and stained with hematoxylin and eosin. Tissues were imaged using a digital slide scanner (Axio Scan Z1, Carl Zeiss).
THP-1 monocyte migration assay
Synthetic CCL5 peptides (500 ng/ml, 250-07, Peprotech) were dissolved in serum-free RPMI1640 media and placed in 24-well culture plate. THP-1 cells were pre-stained with CellTracker™ Deep Red Dye (C34565, Thermo Fisher) for 30 min and 5 × 10⁴ (per well) THP-1 cells were loaded on the surface of the upper layer of Trans-well insert (8 μm pore, 3422, Corning). 6 hours after incubation, the upper layer and Trans-well insert were carefully removed. Migrated THP-1 cells were imaged and quantified using the CQ1 confocal microscope and cell counter (NanoEntek), respectively.
Primary cell conditioned media (CM) preparation
Primary adipocytes were obtained from the floating fraction of fractionated epididymal WAT as described above and primary hepatocytes were isolated by collagenase perfusion method as described previously91 from 12-to-16-week-old male mice. Primary cells were cultured in complete RPMI media for 2 days. CM was collected and frozen at −80°C until use.
DN32.D3 cell culture
DN32.D3 iNKT hybridoma cell line was cultured in complete RPMI media. Adipocyte conditioned media (AD CM) and primary hepatocyte conditioned media (Hep CM), made as described above, were mixed in a 1:1 ratio with fresh complete RPMI media and treated to 2 × 10⁴ DN32.D3 cells in a 12-well plate. DN32.D3 cells were incubated for 2 days in CM and harvested.
RNA isolation and RT-qPCR
For primary adipocytes, 3T3-L1 adipocytes, or DN32.D3 iNKT hybridoma, total RNA was isolated as previously described18. For sorted iNKT cells and in vivo-expanded adipose iNKT cell subpopulations, total RNA was isolated by using Direct-zol™ RNA MiniPrep (R2062, Zymo Research) following the manufacturer’s protocol. The isolated RNA was reverse-transcribed using the ReverTra Ace qPCR RT Kit (Toyobo). RT-qPCRs were run using SYBR Green master mix (DQ384-40h, BioFact). Target gene expression levels were normalized to Rplp0 (36B4) expression. Primer sequences are listed in Supplementary Table 2.
Statistical analysis
Data are presented as the mean ± standard deviation (SD). n-Values indicated in the figures refer to biological replicates. The means of the two groups were compared using a two-tailed Student’s t-test. Means of multiple groups were compared using one-way ANOVA followed by Tukey’s post-hoc test. Two independent variables were compared using two-way ANOVA followed by Sidak’s multiple comparisons test. Statistical analyses were performed using GraphPad Prism (GraphPad Software v9).
- SEO Powered Content & PR Distribution. Get Amplified Today.
- PlatoData.Network Vertical Generative Ai. Empower Yourself. Access Here.
- PlatoAiStream. Web3 Intelligence. Knowledge Amplified. Access Here.
- PlatoESG. Carbon, CleanTech, Energy, Environment, Solar, Waste Management. Access Here.
- PlatoHealth. Biotech and Clinical Trials Intelligence. Access Here.
- Source: https://www.nature.com/articles/s41467-023-44181-3