Schematic of experiment design
As illustrated in Fig. 1, COL1 and Fmod were used to modify PLCL nanoyarn scaffolds to generate PLCL/COL1+Fmod scaffolds, since hASCs expressed higher levels of tenogenic genes on petri-dish coated with COL1 and Fmod. The nanoyarn scaffolds seeded with hASCs were cultured under general condition for inducing tenogenic phenotype. Cytocompatibility and alteration at the transcriptomic level were examined at the 7th day after cell seeding. Subsequently, the cell-scaffold construct was cultivated in vitro in a customized bioreactor at both static and mechanical loading conditions, or implanted subcutaneously in nude mouse to form neo-tendon tissues in vivo after 7 days of in vitro culture.
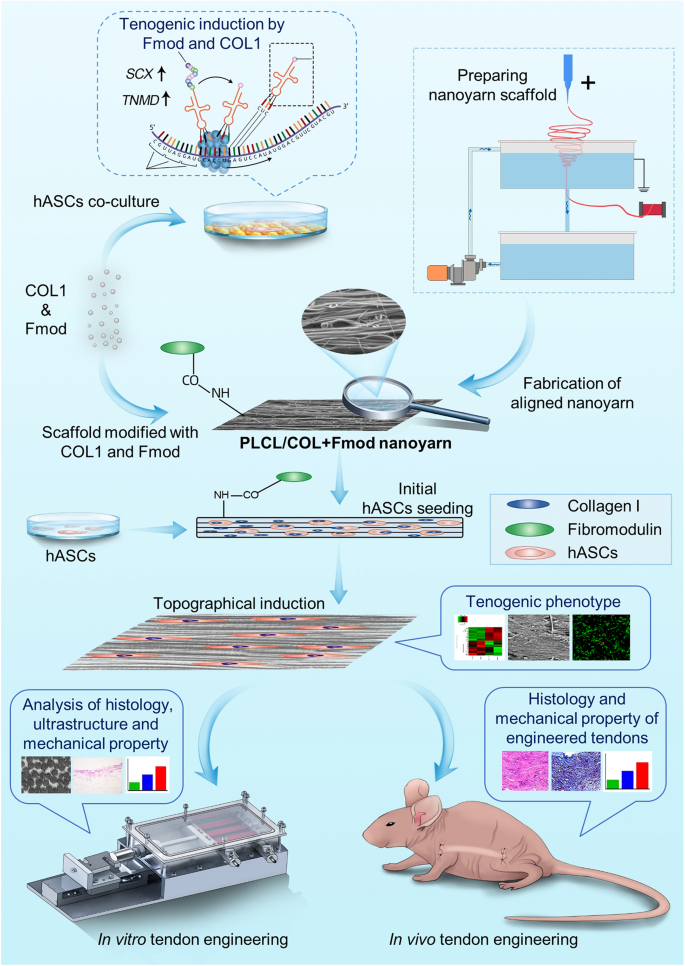
The schematic illustration of the experimental design.
Enhanced tenogenic gene expression of hASCs on the surface coated with COL1 and Fmod
To identify the effective ECM molecules that are capable of providing a reliable tenogenic niche for hASCs, five candidate components of tendon ECM, including COL1, BGN, DCN, Fmod and fibronectin (FN), were coated on the culture dish alone or in various combinations. As shown in Fig. 2a, the fold change levels of scleraxis (SCX) and tenomodulin (TNMD) in COL1 group and COL1+Fmod group were significantly higher than those of other groups (p < 0.05). The hASCs cultured with non-collagenous components expressed high levels of DCN (p < 0.05), whereas the expression levels of SCX, TNMD and COL1 were not well enhanced in these groups. On the other hand, the expression level of osteogenic and adipogenic lineage markers, such as Runt-related transcription factor 2 (RUNX2), Osteocalcin (OCN), CCAAT enhancer binding protein alpha (C/EBPα), Adiponectin and peroxisome proliferator-activated receptor gamma (PPAR-γ), did not increase, except for alkaline phosphatase (ALPL), which significantly increased upon dual induction (Supplementary Fig. 1). Taken together, the screen test results suggested that the COL1 or COL1 plus Fmod may serve as the candidate components for the tenogenic induction of hASCs.
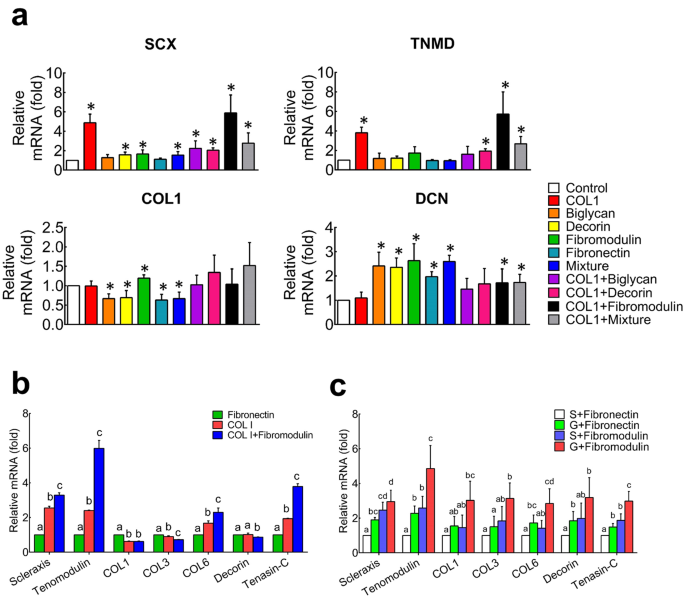
a Screening of teno-inductive ECM components via gene expression of tenogenic markers of SCX, TNMD, COL1 and DCN. *p < 0.05 comparing to control. b hASCs expressed higher levels of tenogenic genes on smooth polydimethylsiloxane membranes coated with both collagen I and fibromodulin using fibronectin coating as a control. c Fibromodulin coated microgroove substrate promoted tenogenic differentiation of hASCs synergistically. Significant differences existed between two groups labeled with different letters. SCX scleraxis, TNMD tenomodulin, Col1 collagen I, DNC decorin, S smooth surface, G microgroove surface. All error bars indicate standard deviation.
To further test the induction effect of ECM molecules on surfaces with different topography, the tenogenic differentiation of hASCs was observed on (polydimethylsiloxane) PDMS membrane, which has reduced stiffness than Petri dish and can be tailored with parallel microgrooved surface. As revealed in Fig. 2b, expression levels of SCX, TNMD, Collagen VI (COL6) and Tenascin-C were significantly enhanced in COL1 and Fmod groups when hASCs were cultured on the flat PDMS (p < 0.05). Moreover, the highest expression levels of these genes in COL1 + Fmod group proved the synergetic effect between COL1 and Fmod (Fig. 2b, c). On the other hand, the induction effect of Fmod could be enhanced on the aligned microgrooved surface, as the expression levels of SCX, TNMD, Collagen III and Tenascin-C were significantly increased compared with the flat FN group and the microgrooved FN group (Fig. 2c, p < 0.05).
Preparation and characterization of nanoyarn scaffold
The working principle of fabrication system was illustrated in Fig. 3a. SEM images showed that the fiber bundles in PLCL scaffold, PLCL/COL scaffold, and PLCL/COL+Fmod scaffold were basically aligned in principle with the angles mainly ranging from 0° to 20° (Fig. 3b, c). Higher-magnification images revealed that these nanofibers within one yarn were regionally aligned and closely attached with each other. Quantitatively, the average diameters of individual fibers were about 1.1 ± 0.3 μm for each group (Fig. 3b, c). No significant difference in yarn diameters was detected (p > 0.05).
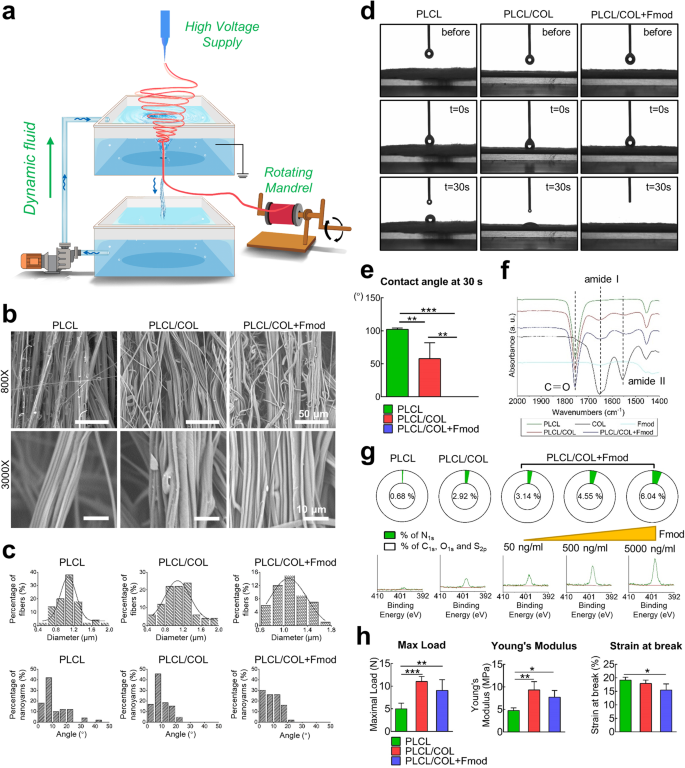
a Illustrated working principle for generating electrospun nanoyarns; b SEM images of nanoyarn scaffold with similar surface morphology among different groups; c Frequency distribution chart of individual fiber diameters and the angles between adjacent yarns; d Processes of water droplet spreading on scaffold surface recorded before, 0 s and 30 s after water-material contact; e Quantitative measurement of water contact angles at 30 s; f FTIR spectra of different scaffolds, and COL1 and Fmod revealed overlapped characteristic absorption peaks of C = O bond, amid I group and amid II group; g XPS assay to show the dose-dependent increasing proportion of nitrogen on the surface of nanoyarns; h Histogram illustration of mechanical properties of different nanoyarn scaffolds. All error bars indicate standard deviation. *p < 0.05, **p < 0.01, ***p < 0.001.
Water droplets spread faster on the scaffolds modified with COL1 and Fmod. As recorded in Fig. 3d, the water droplets spread completely on the PLCL/COL + Fmod scaffold and partially spreads on the PLCL/COL scaffold at 30 s, while the droplets remained nearly spherical on the PLCL scaffold at the same time point. The measurement data showed the contact angle at 30 s of PLCL, PLCL/COL and PLCL/COL+Fmod scaffold were 102 ± 2°, 58 ± 24° and 0 ± 0°, respectively, indicating the best hydrophilicity of these nanoyarns when modified with COL1 and Fmod (Fig. 3e, p < 0.05).
The chemical composition of the modified nanoyarns was examined by ATR-FTIR and XPS. The ATR-FTIR analysis revealed the characteristic peak of C = O bond at 1755 cm−1, which was shared by all three types of scaffolds. The modified scaffolds (PLCL/COL and PLCL/COL+Fmod scaffold) shared the characteristic peaks of amide I and II group with COL1 at 1650 cm−1 and 1550 cm−1, respectively (Fig. 3f). However, the absorption peak of amide II was not so obvious as that of COL1 as illustrated in Fig. 3f. Since nitrogen was widely considered as a symbolic element of proteins when compared to aliphatic polyester, the XPS analysis showed the proportion variation of nitrogen on the surface of PLCL, PLCL/COL and PLCL/COL+Fmod scaffolds, which was revealed by the amplitude of the binding energy peak at 398 eV. As shown in Fig. 3g, the nitrogen content in PLCL/COL scaffolds was much higher than that in PLCL scaffolds. After further modification with Fmod, the nitrogen content in the PLCL/COL+Fmod scaffolds were obviously higher than those in the PLCL/COL scaffolds, and increased in a dose-dependent manner as the concentration of Fmod was elevated from 50 ng/mL to 5000 ng/mL. In contrast, the proportion of other elements, including C, O, and S, were reduced on the surface of PLCL/COL+Fmod scaffolds in a dose-dependent manner, suggesting that nitrogen was introduced into the scaffolds after crosslinking with Fmod.
Changes in mechanical properties revealed higher load bearing capacity and stiffness but lower malleability after modification. As revealed in Fig. 3h and Supplementary Fig. 2, the maximal load of the PLCL, PLCL/COL, and PLCL/COL+Fmod scaffolds was 5.0 ± 1.3 N, 11.0 ± 1.1 N and 9.1 ± 2.4 N, respectively (p < 0.05). The Young’s modulus of the PLCL, PLCL/COL, and PLCL/COL+Fmod scaffolds was 4.7 ± 0.6 MPa, 9.3 ± 1.8 MPa and 7.7 ± 1.5 MPa, respectively (p < 0.05). The strain at break of the PLCL, PLCL/COL, and PLCL/COL+Fmod scaffolds was 19.1 ± 1.1%, 17.9 ± 1.3% and 15.5 ± 2.3%, respectively (p < 0.05).
Phenotypic identification of hASCs
The flow cytometry assay showed that these adipose-derived cells expressed characteristic surface markers of mesenchymal stem cells including CD13, CD44, CD73, CD90 and CD105. Meanwhile, the negative markers of mesenchymal stem cells including CD31, CD45, and HLA-DR were not detected (Supplementary Fig. 3).
Elongated cellular morphology and enhanced collagen deposition of hASCs on dual-modified yarns
As revealed in Fig. 4a, hASCs stably adhered to the yarns and gradually exhibit their elongated morphology after 7 days of culture on three types of nanoyarn scaffolds. However, the hASCs on the modified nanoyarn scaffold showed higher cell aspect ratios. The averaged cell aspect ratios of the cells on PLCL, PLCL/COL, and PLCL/COL + Fmod scaffolds were respectively 7.1 ± 2.3, 10.5 ± 3.4, 13.7 ± 4.6 on the 1st day (p < 0.05), 8.8 ± 3.2, 9.1 ± 4.1, 16.9 ± 6.2 on the 3rd day (p < 0.05), 11.0 ± 5.3, 13.8 ± 4.6, 17.0 ± 7.6 on the 5th day (p < 0.05), and 9.2 ± 3.1, 11.7 ± 6.1, 17.2 ± 6.2 on the 7th day (p < 0.05). The frequency distribution diagram also revealed the highest cell aspect ratio of hASCs on PLCL/COL+Fmod scaffolds (Fig. 4a).
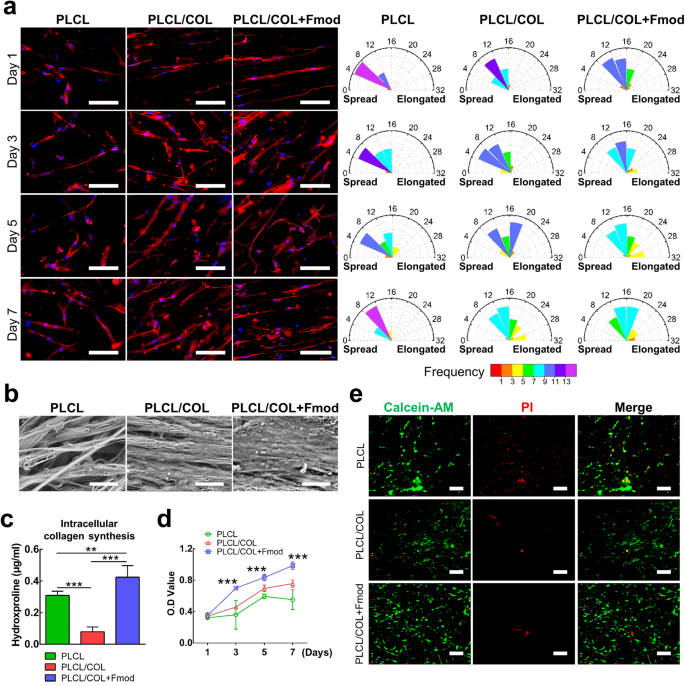
a Cytoskeleton staining revealed the accelerated spreading process of hASCs along the PLCL/COL+Fmod nanoyarns. The highest cell aspect ratio was also observed in PLCL/COL+Fmod group. Magnification, 200×; Bar 100 μm. b SEM images visually presented the most abundant matrix deposition on PLCL/COL+Fmod scaffold. Magnification, 800×; Bar = 50 μm. c Quantitation of intracellular hydroxyproline indicated alteration of biosynthesis level of collagen. d Cell proliferation curve was generated by CCK-8 assay. e Live/dead staining revealed enhanced cell viability on two types of modified scaffolds. All error bars indicate standard deviation. **p < 0.01, ***p < 0.001.
The SEM images showed enhanced collagen deposition of hASCs on the 7th day of cell culture on modified scaffolds (Fig. 4b). In detail, little extracellular matrix deposition was observed around the cells on PLCL scaffold where the outline of cell morphology was clearly visible. On the contrary, collagen sheet formed on PLCL/COL scaffold and the outline of cell morphology became ambiguous when compared to those in PLCL group. A thick collagen layer was observed on PLCL/COL+Fmod scaffolds where cells were already embedded in the collagen layer. Nonetheless, the intracellular collagen synthesis, which was detected by hydroxyproline quantification assay, showed a different pattern from the results visually observed in SEM images. Collagen synthesis decreased in the PLCL/COL group but increased significantly in the PLCL/COL+Fmod group when compared to that in the PLCL group (Fig. 4c, p < 0.05).
Cell proliferation and viability on yarns
The hASCs proliferated at the fastest rate in the PLCL/COL+Fmod group and at a slower rate in the PLCL/COL group as shown by CCK-8 assay, in which significant differences were detected on days 3, 5, and 7 (Fig. 4d, p < 0.05). Live/dead double staining also revealed fewer dead cells on the modified yarn scaffold (Fig. 4e).
COL1 and Fmod accelerated tissue maturation of hASCs-yarns constructs in vitro
The engineered neo-tendon tissues were cultured under both static and dynamic conditions. As shown in Fig. 5a, after 4 weeks of in vitro culture, no obvious difference in gross appearance was found among all groups after static culture or dynamic culture with mechanical loading. However, further histological analysis suggested that relatively mature tissues were formed in the PLCL/COL+Fmod group, especially under dynamic culture condition. In the static conditions, although cells in all three groups were able to infiltrate into the core area of the scaffold and secrete ECM components, there was still no substantial progress in tissue maturation. TEM images showed relatively mature collagen fibrils in PLCL/COL and PLCL/COL+Fmod groups with more obvious periodic cross-striations and larger fibril diameters (Fig. 5a, b, p < 0.05).
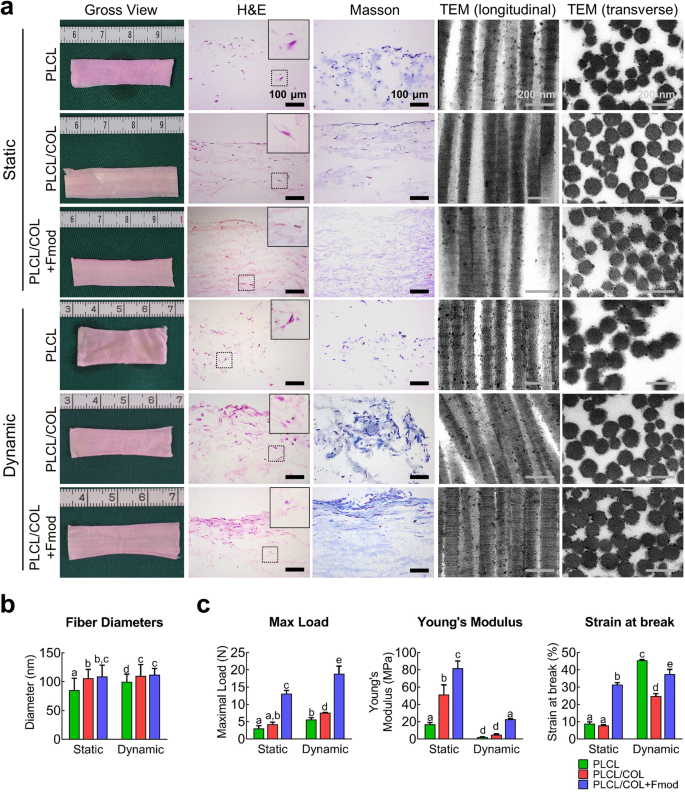
a The gross view, H&E staining, Masson trichrome staining and TEM images were observed after the 4-week culture of cell-scaffold complex under static or dynamic condition. The contents of the dotted box were enlarged and presented in the top right corner. For H&E and Masson trichrome staining, Magnification, 200×; Bar = 100 μm. For TEM images, Bar = 200 nm. b Collagen fibrils diameters were measured according to TEM images. c Maximum load, Young’s Modulus, and strain at break of in vitro engineered cell-matrix complex were tested. Significant differences existed between two groups labeled with different letters. All error bars indicate standard deviation.
Substantial changes in histology were initiated after 4 weeks of dynamic culture under mechanical loading in a bioreactor. The primitive tissue formed in the superficial layer of the PLCL/COL+Fmod scaffold with 3 to 4 layers of stacked cells. However, there was no obvious histologic structure in PLCL and PLCL/COL groups, indicating the important role of Fmod in inducing tenogenic differentiation of hASCs (Fig. 5a). In general, fibril diameters were significantly increased by dynamic traction of cell scaffold constructs except for the PLCL/COL+Fmod group, suggesting other limiting factors for collagen assembly in vitro (Fig. 5b).
Enhanced mechanical properties of in vitro engineered constructs with COL1 and Fmod modification
As shown in Fig. 5c and Supplementary Fig. 4, the maximal load in PLCL, PLCL/COL, and PLCL/COL+Fmod groups were respectively 3.1 ± 0.8 N, 4.3 ± 0.6 N, 13.2 ± 0.9 N under static condition (p < 0.05), and respectively 5.6 ± 0.5 N, 7.6 ± 0.1 N, 18.9 ± 2.2 N under dynamic loading with significant differences among three groups (p < 0.05). Significance of difference in the maximal load could be observed between each group (p < 0.05), except for the difference between PLCL and PLCL/COL group under static condition. The maximal load in each group under dynamic stretching was significantly higher than that of the corresponding group under static condition (p < 0.05).
The Young’s modulus of PLCL, PLCL/COL, and PLCL/COL+Fmod groups were 17.1 ± 2.1 MPa, 51.6 ± 11.0 MPa, 81.9 ± 8.4 MPa, respectively, under static condition, and 2.3 ± 0.2 MPa, 5.1 ± 0.8 MPa, 22.8 ± 0.8 MPa, respectively, under dynamic loading among three groups (p < 0.05). Significant difference in Young’s modulus could be observed between each group (p < 0.05), except for the difference between PLCL and PLCL/COL group under dynamic stretching. However, the Young’s modulus in each group under static condition was significantly higher than that of the corresponding group under dynamic stretch (p < 0.05).
The strain at break of PLCL, PLCL/COL, and PLCL/COL+Fmod groups were 8.9 ± 1.0%, 7.9 ± 0.4%, 31.5 ± 1.1%, respectively, under static condition, and 45.6 ± 0.4%, 24.8 ± 1.4%, 37.5 ± 2.7%, respectively, under dynamic loading among three groups (p < 0.05). Significant difference in the strain at break was observed between each group (p < 0.05), except for the difference between PLCL and PLCL/COL group under static condition. The strain at break of each group under static condition was significantly lower than that of the corresponding group under dynamic stretch (p < 0.05). Taken together, the best mechanical performance of the engineered tendons was demonstrated in the PLCL/COL+Fmod group was proved in this assay.
COL1 and Fmod accelerate tenogenic remodeling of in vivo implanted hASCs-yarns constructs
As a combination of ECM molecules with a stronger ability to induce tenogenic differentiation of hASCs, COL1 and Fmod also promoted the tissue maturation of hASCs-nanoyarns constructs upon in vivo implantation. As shown in Fig. 6a, after 6 weeks of in vivo implantation, a much thicker tendon tissue with higher tissue volume was observed grossly in both PLCL/COL and PLCL/COL + Fmod groups grossly, whereas the tissue was poorly developed in the PLCL group.
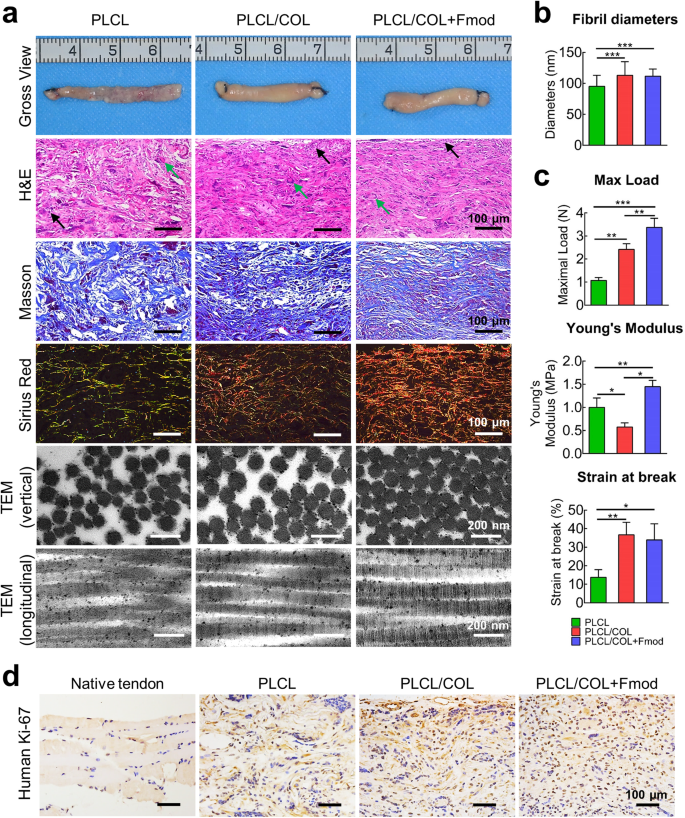
a Gross view, histological examination and ultrastructure of in vivo engineered tendon at the 6th week after implantation of cell-scaffold complex. The inflammatory cells and foreign body giant cells are indicated by solid arrows in black and green, respectively. For histochemical staining, Magnification, 200×; Bar = 100 μm. For TEM observation, Bar = 200 nm. b Collagen fibrils diameters were measured according to TEM images. c Maximum load, Young’s Modulus, and strain at break of in vivo engineered neo-tendon tissues at the 6th weeks post-implantation. *p < 0.05, **p < 0.01, ***p < 0.001. d Immunohistochemical staining of human Ki-67 revealed the highest viability of hASCs in PLCL/COL+Fmod group. Magnification, 200×; Bar = 100 μm. All error bars indicate standard deviation.
Histologically, parallel collagen fibers with a relatively organized tissue pattern were observed in both PLCL/COL and PLCL/COL+Fmod groups. In particular, elongated cells similar to those in native tendon were observed in the PLCL/COL+Fmod groups. In contrast, a random tissue pattern was observed in the PLCL group, where randomly distributed cells were observed. In addition, foreign body giant cells and inflammatory cells were observed along with undegraded material fragments, indicating adverse cell-material interaction and poor compatibility of the unmodified PLCL fibers.
Relatively, much denser collagen matrices were observed in H&E and Masson’s staining in the PLCL/COL groups compared to other two groups. Interestingly, a much higher level of tissue maturation was observed only in the PLCL/COL+Fmod group, as predominant type I collagen was found exclusively in this group (yellow-colored fibers in polarized photomicrographs), indicating the potent tenogenic effect of these two specific ECM molecules.
COL1 and Fmod improved collagen fibril ultrastructure of neotendons in vivo
The TEM examination revealed the densest collagen fibrils in PLCL/COL+Fmod group, which was consistent with the histologic results (Fig. 6a). Although D-band periodicity was obviously observed in all groups, collagen fibril assembly of neotendons in vertical section was significantly improved in PLCL/COL group and PLCL/COL+Fmod group as revealed by fibril diameter (Fig. 6a, b, p < 0.05). Quantitatively, the average fibril diameters of neotendons in PLCL, PLCL/COL and PLCL/COL+Fmod groups were 95.2 ± 18.0 nm, 113.0 ± 21.9 nm, and 111.5 ± 11.6 nm, respectively with significant difference among three groups (Fig. 6c, p < 0.05), but no significant difference was found between collagen fibrils in PLCL/COL group and PLCL/COL+Fmod group. Unfortunately, the polarization of collagen fiber diameter distribution, which is usually considered as another ultrastructural feature of tendon21, was not found in all three groups.
COL1 and Fmod enhanced biomechanical performance of neotendons in vivo
The maximal load, Young’s modulus and Strain at break were significantly increased in the in vivo formed tendons by COL1 and Fmod. Quantitatively, as shown in Fig. 6c, the maximal load of neotendons in PLCL, PLCL/COL and PLCL/COL+Fmod groups was 1.1 ± 0.1 N, 2.4 ± 0.3 N and 3.4 ± 0.4 N, respectively with significant difference among three groups (p < 0.05). The Young’s Modulus of neotendons in PLCL, PLCL/COL and PLCL/COL+Fmod groups was 1.0 ± 0.2 MPa, 0.6 ± 0.1 MPa and 1.5 ± 0.1 MPa, respectively with significant difference among three groups (p < 0.05). The Strain at break of neotendons in PLCL, PLCL/COL and PLCL/COL+Fmod groups was 13.7 ± 4.2%, 36.7 ± 6.7% and 33.9 ± 8.8%, respectively, with significant difference among three groups (p < 0.05). However, no significant difference in Strain at break was detected between PLCL/COL and PLCL/COL+Fmod groups.
COL1 and Fmod facilitated hASCs survival in cell-scaffold complex
Further immunohistochemical examination of human Ki-67 showed the highest survival rate of hASCs in the PLCL/COL+Fmod group after 6 weeks of in vivo implantation (Fig. 6d). As shown by human Ki-67 immunohistochemical staining, a negative result was observed in the native Achilles tendon of nude mice, as the positive rate was less than 5%. However, the most abundant Ki-67-positive cells were observed in the PLCL/COL+Fmod group, while there were significantly fewer cells in the PLCL and PLCL/COL groups.
COL1 and Fmod enhanced tenogenic-specific differentiation of hASCs on nanoyarn scaffolds
After culturing on nanoyarn scaffolds for 7 days, the expression levels of tenogenic genes, including TNMD, COL1, COL6, Fmod, TNC, BGN, and DCN, were significantly increased on the dual-modified scaffold compared to those in the control group (Fig. 7a, p < 0.05). In contrast, modification of solo COL1 was only able to increase the expression levels of BGN and DCN (Fig. 7a, p < 0.05). In addition, there is no significant difference in the expression level of SCX among all groups, although an increasing trend was observed in the PLCL/COL+Fmod group (p > 0.05).
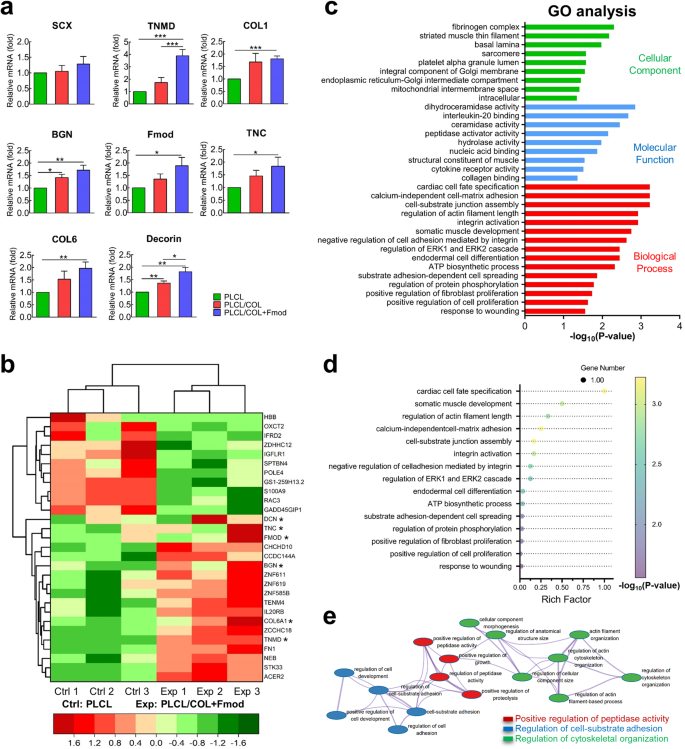
a hASCs that were seeded on PLCL/COL+Fmod scaffold expressed significantly higher levels of tenogenic genes. *p < 0.05, **p < 0.01, ***p < 0.001. b Differentially expressed mRNAs and representative tenogenic mRNAs were displayed in a clustered heat map. *p < 0.05 but FDR ≥ 0.05. c Representative GO terms enriched by differentially expressed mRNAs regarding Cellular Component, Molecular Function and Biological Process. d Bubble chart showed the degree of enrichment of 15 representative Biological Process terms. e All the Biological Process terms enriched by differentially expressed mRNAs were integrated into an interaction network as shown. All error bars indicate standard deviation.
On the other hand, no obvious enhancement for differentiation trend towards other lineages was observed on dual-modified scaffold, such as chondrogenic (Supplementary Fig. 5a), osteogenic (Supplementary Fig. 5b) and adipogenic (Supplementary Fig. 5c) lineages. Only the expression levels of aggrecan and ALPL were higher in the PLCL/COL+Fmod group than in the PLCL group (p < 0.05). These results indicated the predominant tenogenic phenotype of hASCs on the PLCL/COL+Fmod scaffold.
GO analysis of differentially expressed mRNAs indicated their functionality in tenogenic phenotype establishment
Considering the differentially expressed tenogenic genes between PLCL group and PLCL/COL+Fmod group, RNA-seq analysis was used to evaluate the whole mRNA profile of hASCs. As shown in Fig. 7b, a total of 23 differentially expressed mRNAs, including 11 downregulated and 12 upregulated mRNAs, were identified strictly by fold change and FDR value to avoid false positive results. These differentially expressed genes, together with several tenogenic genes already identified by qPCR (marked with * in Fig. 7b), were further categorized by a cluster heat map.
These identified differentially expressed mRNAs were then classified into biological process, molecular function, and cellular component for GO analysis. Representative GO terms are listed in Fig. 7c. Regarding biological process, COL1 and Fmod mainly led to differential enrichment in cell-ECM adhesion, cytoskeleton organization, cell fate decision, protein biosynthesis and cell proliferation (Fig. 7c, d), which also supports the results observed in Figs. 4, 5 and 6. In terms of molecular function, COL1 and Fmod mainly regulated protease activity and membrane receptor binding activity. For cellular components, COL1 and Fmod mainly induced changes in intracellular membrane components and cytoskeletal filaments.
The interaction network of all enriched Biological Process terms was then auto-generated after labeling with different titles such as positive regulation of peptidase activity, regulation of cell-substrate adhesion, and regulation of cytoskeletal organization (Fig. 7e), which primitively elucidated the different biological behaviors underlying the induction of the tenogenic phenotype.
ceRNA regulation axis was constituted based on differentially expressed lncRNAs, miRNAs and mRNAs
The same filtering criteria (log2(fold change) >0.585 or < −0.585; FDR < 0.05) were also used to identify differentially expressed lncRNAs and miRNAs. In total, 15 differentially expressed lncRNAs were selected, of which 14 were upregulated and 1 was downregulated (Fig. 8a). Similarly, 18 differentially expressed miRNAs, including 1 upregulated and 17 downregulated, were identified as shown in Fig. 8b. Potential target miRNAs of these differentially expressed lncRNAs and mRNAs were predicted and double-checked using miRanda and RNAhybrid tools. Finally, a total of 9 lncRNAs, 10 miRNAs and 2 mRNAs were found to be involved in the lncRNA-miRNA-mRNA triple regulatory network and then visualized by Cytoscape software (Fig. 8c). Among them, the LOC101929398-has-miR-197-3p-TENM4 axis formed a complete ceRNA regulatory axis. The subcellular location of this regulatory axis, where LOC101929398 may act as a ceRNA to stabilize TENM4, was predicted to be the cytoplasm (90.04% probability) according to the base sequence of LOC101929398, suggesting that LOC101929398 is likely to exert regulatory effect by sponging has-miR-197-3p in the cytoplasm ((Fig. 8d). Furthermore, the target RNA binding sequences between has-miR-197-3p and LOC101929398 or has-miR-197-3p and the 3′-untranslated region of TENM4 were predicted as shown in Fig. 8e.
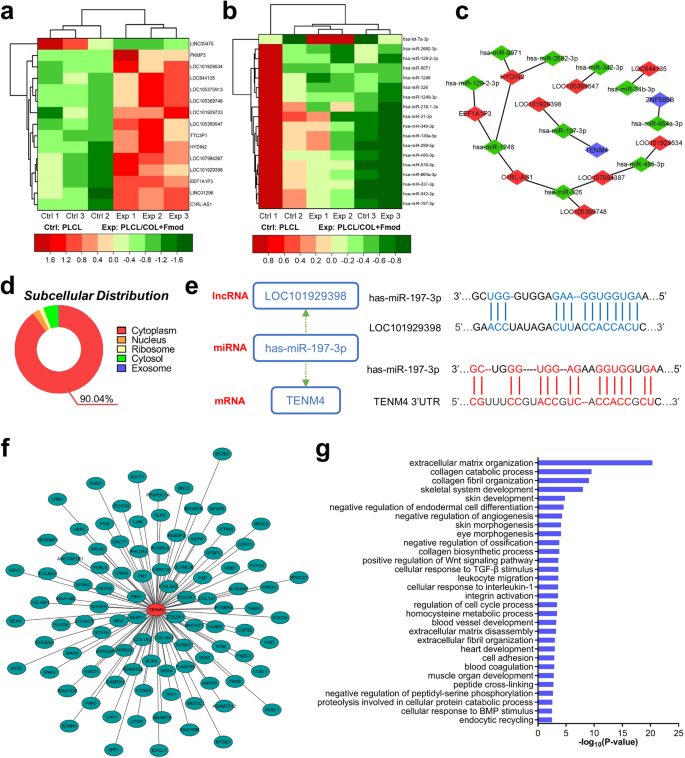
a Differentially expressed lncRNAs were displayed in a clustered heat map. b Differentially expressed miRNAs were displayed in a clustered heat map. c The triple regulation network showed the interaction relationship among differentially expressed mRNAs, lncRNAs and miRNAs. Blue hub indicates mRNA. Red hub indicates lncRNA. Green hub indicates miRNA. d Subcellular distribution of LOC101929398 was exhibited as a pie chart. e Possible binding sequences between LOC101929398 and has-miR-197-3p, TENM4 and has-miR-197-3p were predicted. 3′UTR, 3′-untranslated region. f Genes co-expressed with TENM4 were identified. Longer distance from central hub indicates lower correlation score. g Top 30 of GO Biological Process terms enriched by these co-expressed genes were illustrated in a histogram.
Genes co-expressed with TENM4 were closely correlated with organ development
To further elucidate the biological process that might be affected by TENM4, genes correlated with TENM4 were identified through co-expression analysis. As revealed in Fig. 8f, a total of 97 correlated genes were identified and arranged by correlation score. The longer distance indicated less relevance, and vice versa. These genes were principally enriched in 178 GO biological processes regarding tissue development and morphogenesis, extracellular matrix organization and cell proliferation. The top 30 representative GO biological process terms were unraveled in Fig. 8g. Briefly, most of these terms support trauma healing as well as regeneration of various types of mesenchymal tissues from the cellular level to the organ level, especially of the skeletal-muscle motor system, while facilitating the reduction of calcification formation of soft tissue.
Based on the above findings, the possible mechanism by which COL-FOMD dually modified nanoyarns induced the tenogenic phenotype of hASCs was deduced and illustrated in Fig. 9.
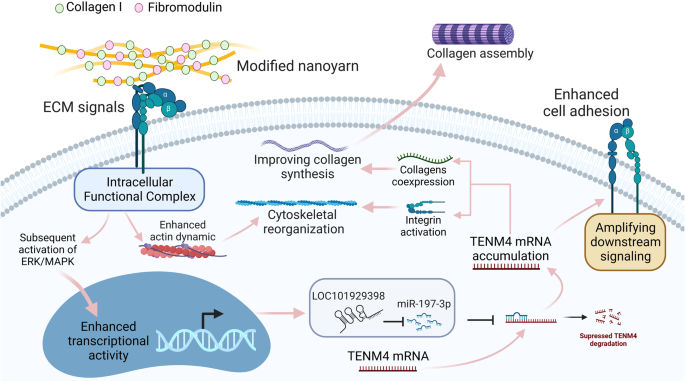
The ECM signals provided by COL1 and Fmod are considered as the vital niche signals that increases expression levels of LOC101929398 and TENM4, and then trigger ceRNA regulation mechanism as shown. Intracellular accumulation of TENM4 mRNA was predicted to serve as the core event during the establishment of tenogenic phenotype in hASCs. By co-expression of collagens and integrin activation, accumulated TENM4 mRNA enhances collagen secretion, cytoskeletal reorganization and cell adhesion, thus confers tenogenic traits on hASCs.
- SEO Powered Content & PR Distribution. Get Amplified Today.
- PlatoData.Network Vertical Generative Ai. Empower Yourself. Access Here.
- PlatoAiStream. Web3 Intelligence. Knowledge Amplified. Access Here.
- PlatoESG. Carbon, CleanTech, Energy, Environment, Solar, Waste Management. Access Here.
- PlatoHealth. Biotech and Clinical Trials Intelligence. Access Here.
- Source: https://www.nature.com/articles/s41536-023-00341-z