Reagents and instrumentation
Micro computed tomography (Micro-CT, ScancoMedical, Switzerland); Medical Slow DC Drill (Erbrigh-instrumente, Germany); Titanium rod implants (Huatrau, 1.5 × 10.0 mm, China); TSA (APExBIO, USA); Microcomputer-controlled electronic universal testing machine (Reger, China); Hematoxylin–eosin (HE) Stain Kit (Boster, China); Masson’s Trichrome Stain Kit (Ribo, China); Immunohistochemistry kits (for Rabbit Primary Antibody) (Bioss ANTIBODIES, China); Digital pathology Slide Scanner (Motic Easy Scan, China); fetal bovine serum (Gibco, USA); penicillin–streptomycin solution (Beyotime, China); α-MEM medium (Gibco, USA); β-glycerophosphate (Solarbio, China); ascorbic acid (Solarbio, China); dexamethasone (Solarbio, China); Alkaline phosphatase (ALP) Assay Kit (Beyotime, China); inverted fluorescence microscope (Nikon; Japan); ALP activity Assay Kit (Solarbio, China); Bicinchonininc acid (BCA) protein Assay Kit (Beyotime, China); Alizarin red S (ARS) Solution (Solarbio, China); cetylpyridinium chloride (Solarbio, China); Microplate Reader (Bio Tek Instruments, USA); carbonyl cyanide 3-chlorophenylhydrazone (CCCP) (Solarbio, China); LY294002 (MCE, USA); Cell Counting Kit-8 (CCK8) (Beyotime, China); Enhanced Mitochondrial Membrane Potential Assay Kit with JC-1 (Beyotime, China); Antifade Mounting Medium with DAPI (Beyotime, China); Malondialdehyde (MDA) Assay Kit (Nanjing Jiancheng Bioengineering Institute, China); Superoxide Dismutase (SOD) Activity Assay Kit (Nanjing Jiancheng Bioengineering Institute, China); ROS Assay Kit (Beyotime, China); flow cytometry (Beckman Coulter, USA); Annexin V-FITC Apoptosis Detection Kit (Beyotime, China); Nuclear and Cytoplasmic Protein Extraction Kit (Beyotime, China); nanoscale titanium powder (99.8%, 60 nm) (Macklin, China); titanium sheet (0.1 mm thick, 34 mm in diameter) (baoti, China); electron microscope (hitachi, Japan).
Cell culture and treatment
The MC3T3-E1 Subclone 14 mouse calvarial preosteocyte cell line, sourced from CELLCOOK, Guangzhou, China, was used in this study. Cells were cultured in base medium (10% fetal bovine serum, 1% penicillin–streptomycin, α-MEM). An oxidative stress model was established by treating cells with carbonyl cyanide 3-chlorophenylhydrazone (CCCP; 10 μM) for 10 min. In total, 6 treatment groups were established: NC group (untreated normal control cells); CCCP group (10 μM CCCP treatment for 10 min); TSA group (8 μM TSA treatment for 24 h); CCCP + TSA group (10 μM CCCP treatment for 10 min, 8 μM TSA treatment for 24 h); TSA + LY294002 group (8 μM TSA treatment for 24 h, 50 μM LY294002 treatment for 24 h); CCCP + TSA + LY294002 group (10 μM CCCP treatment for 10 min, 8 μM TSA treatment for 24 h, 50 μM LY294002 treatment for 24 h).
CCK-8 assay
CCK-8 was used for rapid and sensitive detection of cell proliferation and cytotoxicity. MC3T3-E1 cells in 96-well plates were treated with varying TSA concentrations (0, 1, 3, 5, 8, 10, 20, 50, 100 μM) over time intervals (6, 12, 24, 48, and 72 h), followed by the addition of 10 μL CCK-8 reagent per well. After an additional 2 h incubation, absorbance was analyzed at 450 nm using a microplate reader, with absorbance values being used to establish cell survival rates.
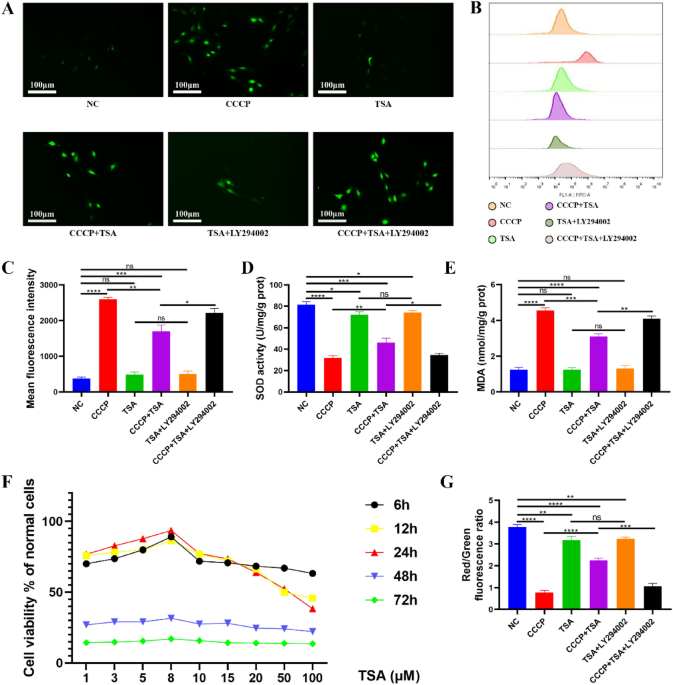
Analysis of oxidative stress-related biomarkers
Superoxide dismutase (SOD) is vital for antioxidant defense, and malondialdehyde (MDA), a lipid peroxidation byproduct, is a marker for oxidative stress levels in cells. Detecting SOD and MDA concentrations can reflect the degree of oxidative stress from different perspectives. MC3T3-E1 cells were cultured in 24-well plates and treated as above, following adherence to the plate. Following a 6-day incubation period, cells were harvested, and MDA and SOD analyses were performed to gauge oxidative stress levels using MDA Assay and SOD Assay kits based on provided directions. A BCA protein assay kit was used to measure protein levels in each sample.
In another experiment, post a 6-day treatment regimen as previously described, a ROS Assay Kit utilizing 2′,7′-dichlorodihydro-fluorescein diacetate (DCFH-DA) was employed to evaluate ROS levels according to the manufacturer’s instructions. ROS converts DCFH-DA that enters cells into green fluorescent substances. Therefore, when observing the cells from a fluorescence microscope, the stronger the green fluorescence, the higher the ROS content.
In addition, flow cytometry was utilized to quantify mean fluorescence intensity values as a measure of ROS production in these cells.
Analyses of MMP
The JC-1 probe, emitting red or green fluorescence to indicate low or high MMP levels, was employed to detect MMP. MC3T3-E1 cells were cultured in 24-well plates and treated as above, following adherence to the plate. After treatment, cells were rinsed thrice with PBS, fixed for 10 min using a neutral tissue fixator, and stained with JC-1 based on the provided kit instructions. Nuclei were subsequently stained with 100 μl of a prepared DAPI solution, and cells were imaged with a fluorescence microscope, followed by analysis using ImageJ software (version 1.52v, NIH, USA).
Apoptosis analyses
Following the abovementioned treatment, cells were stained with Annexin V-FITC and PI using an Apoptosis Detection Kit and analyzed through flow cytometry. Early and late apoptotic cells were defined as FITC+/PI− and FITC+/PI+ cells, respectively, and the sum of these two cell types was determined to establish the overall apoptosis rate.
Western blot
Cells were washed with chilled PBS and lysed using RIPA buffer for 15 min following the abovementioned treatment. Lysates were then transferred to 1.5 mL Eppendorf tubes and centrifuged for 30 min at 15,000 rpm at 4 °C. Lysates were combined with 5× protein loading buffer at a 4:1 ratio and boiled for 12 min to facilitate protein denaturation. Samples were then separated via SDS-PAGE and transferred to PVDF membranes, and these blots were blocked using 5% BSA for 2 h. Blots were then probed overnight using antibodies specific for Nrf2, AKT, HO-1, NQO1, OPN, Runx2, BMP2, OCN, Caspase3, Bcl2, Bax, cleaved caspase-3, and β-actin, at 4 °C with constant shaking. The following day, blots were rinsed with TBST and probed for 2 h with appropriate secondary antibodies. After an additional wash with TBST, protein bands were detected with a luminescent ECL solution, and densitometric analyses were conducted using ImageJ. Blots were sectioned before antibody hybridization, precluding the acquisition of full-length blot images. However, images of all blots, inclusive of visible membrane edges and replicates, are available in the Supplementary material.
Nuclear and cytoplasmic protein fractionation assays
For nuclear and cytoplasmic protein fractionation assays, three MC3T3-E1 cell groups were delineated: CCCP group, CCCP + TSA group, and CCCP + TSA + LY294002 group. Post-treatment, a Nuclear and Cytoplasmic Protein Extraction Kit facilitated the isolation of cytosolic and nuclear proteins, which were then subjected to Western blot analysis for total, nuclear, and cytosolic Nrf2.
Analyses of MC3T3-E1 cell nanoscale titanium powder absorption, fusion, and osteogenic ability
MC3T3-E1 cells, post adherence to 24-well plates, underwent various treatments with nanoscale titanium powder. The groups included: CCCP group (10 μM CCCP for 10 min); CCCP + TI group (10 μM CCCP for 10 min, 0.1 mg/ml nanoscale titanium powder); CCCP + TI + TSA group (10 μM CCCP for 10 min, 0.1 mg/ml nanoscale titanium powder, 8 μM TSA for 24 h); CCCP + TI + TSA + LY294002 group (10 μM CCCP for 10 min, 0.1 mg/ml nanoscale titanium powder, 8 μM TSA for 24 h, 50 μM LY294002 for 24 h).
After treatment, Western blotting was performed. Following 7 days post-osteogenesis induction, ALP staining was conducted to assess differentiation.
Analyses of MC3T3-E1 cell attachment to a titanium sheet
Sterile titanium sheets (0.1 mm thick, 24 mm diameter) were placed in the wells of a 6-well plate, serving as a substrate for seeding MC3T3-E1 cells under various treatment conditions. Treatment conditions for the cells included: TS + CCCP group (10 μM CCCP for 10 min); TS + CCCP + TSA group (10 μM CCCP for 10 min, 8 μM TSA for 24 h); TS + CCCP + TSA + LY294002 group (10 μM CCCP for 10 min, 8 μM TSA for 24 h, 50 μM LY294002 for 24 h). After treatment, electron microscopy was used to assess MC3T3-E1 cell adhesion to the titanium surface.
Experimental animals
The Ethical Committee of Yijishan Hospital approved all studies. Female Sprague–Dawley rats, aged 12 weeks and weighing 220–240 g, were housed in Yijishan Hospital’s Central Laboratory. They were maintained under standard environmental conditions (22 ± 2 °C, 50% humidity, and a 12-h light/dark cycle) with unrestricted access to food and water. The rats were euthanized under isoflurane anesthesia.
Ethics statement
All animal experiments were approved by the Scientific Research and New Technology Ethics Committee of Yijishan Hospital, Wannan Medical College ((2021) Ethical Review Approval No. 071) and conducted in accordance with the relevant guidelines. The study was carried out in compliance with the ARRIVE guidelines.
Surgery and treatment
Sixty rats were divided into two groups: a sham surgery group (n = 15) and a bilateral OVX group (n = 45). The surgical procedure involved making a 1.5 cm skin incision 2 cm below the costal arch and 1.5 cm from the spine. The subcutaneous tissue, muscle, and fascia were bluntly separated, exposing the white fat tissue. Upon manipulating this fat tissue, the mulberry-like ovary, approximately 0.5 cm in diameter, became visible. The junction between the oviduct and the ovary was resected with suitable suturing, followed by the removal of the ovary. This process was repeated for both ovaries, after which the incisions were closed using sutures. Postoperatively, rats were administered intramuscular penicillin (200,000 IU/mL, 1 mL/kg) for three days. Identical operative procedures were performed on the sham control group, except that only para-ovarian fatty tissue was removed. At 3 months post-surgery, 5 rats from each group underwent random selection and euthanasia to confirm successful OP model establishment. Subsequently, the remaining 50 rats were utilized for distal femur bone defect modeling. Briefly, the skin on the medial side of the knee joint was incised, followed by the femur medial condyle exposure following the blunt separation of the subcutaneous, muscle, and fascial tissue. A 1 mm circular bone defect was created using a medical DC drill, penetrating the femur lateral condyle. Next, 20 total rats were randomly selected to undergo the implantation of a titanium rod (diameter: 1.5 mm) at the site of this bone defect. The 5 groups of rats after these surgical procedures are: CON group (n = 10, sham surgery, bone defect surgery, and normal saline treatment); BD group (n = 10, OVX, bone defect surgery, and normal saline treatment); TSA group (n = 10, OVX, bone defect surgery, and 500 μg/kg/day TSA treatment); TI group (n = 10, OVX, bone defect surgery, titanium implants, and normal saline treatment); TSA + TI group (n = 10, OVX, bone defect surgery, titanium implants, and 500 μg/kg/day TSA treatment). Daily intraperitoneal injections of drugs or equivalent volumes of normal saline were administered for 8 weeks. Rats underwent daily weighing, and injected volumes were adjusted based on each rat’s weight.
Micro-CT analyses
Micro-CT analysis of the rats’ left femur focused on the area around the titanium rod implantation site. The region of interest (ROI) was defined as a 2 mm diameter cylinder. After 3D reconstruction of the ROI, software analysis measured parameters such as BMD, bone volume fraction (BV/TV), trabecular number (Tb.N), trabecular thickness (Tb.Th), and trabecular separation (Tb.Sp).
Axial pull-out force analyses
Post-euthanasia, femurs from the TI and TSA + TI groups were collected for analysis. Surrounding soft tissue was removed to reveal the heads of the implanted screws. Subsequently, a paste consisting of 20 g of dental powder and 4 mL of PBS was prepared, and a retention frame was used to stabilize the femur. Following the dental paste’s 40-min solidification, the retention frame’s clamping blade secured the head of the titanium rod. The fixing mechanism was connected to an electronic universal testing machine, with its long axis being aligned to the titanium rod. It was then pulled at 2.0 mm/min, and GraphPad Prism was used to analyze the resultant data.
Histological and immunohistochemical analysis
The right femur of each rat was decalcified, sectioned, and embedded in paraffin, after which H&E, Masson’s trichrome staining, and immunohistochemical analysis were performed based on the instructions provided with appropriate kits. Masson’s trichrome staining resulted in muscle fibers staining red, whereas blue staining highlighted collagen fibers and new bone tissue. Immunohistochemistry was employed to detect the expression levels of pathway-related protein AKT and osteogenesis-associated protein OCN in the femur. AKT and OCN served as primary antibodies, while Goat-anti-Rabbit-IgG was applied as the secondary antibody. Antigen-expressing positive cells were stained brown. Photographs were obtained under a light microscope. The average optical density (AOD) of AKT and OCN was assessed using ImageJ software. A digital pathological section scanner was used to scan the resultant sections.
Histological and immunohistochemical analyses were conducted after two months of drug treatment. After fixation, decalcification, and paraffin embedding, the femur was incised into 5 μm slices and stained with HE and Masson’s trichrome stains for morphologic assessment. New bone formation after bone injuries was examined using a light microscope (Nikon Eclipse Ti-U; USA). After Masson’s trichrome staining, new bone tissue and collagen fibers were stained blue, and mature bone and muscle fibers were stained red. The new bone formation in the defect area was quantified using ImageJ software.
Osteocalcin (OCN) and type 1 collagen (COL1) expression levels in the femur were detected using immunohistochemistry. Briefly, slices were deparaffinized with xylene, immersed in 3% H2O2 to remove endogenous catalase, blocked against non-specific antibodies, and then incubated with specific primary antibodies (OCN, 1:200, DF12303, Affinity; COL1, 1:100, AF7001, Affinity) overnight at 4 °C. The next day, the slices were incubated with the secondary antibody, subjected to DAB staining, then counterstained with hematoxylin, dehydrated, and mounted. Antigen-expressing positive cells were stained brown. Photographs were obtained under a light microscope. The average optical density of OCN and COL1 were measured by ImageJ software.
Evaluation of BMSCs’ osteogenic ability
Post-euthanasia, rat bodies from each treatment group were sterilized with 75% ethanol for BMSCs extraction. The skin and muscle were swiftly removed from the animals’ hind limbs to expose the femurs. These were then placed in PBS within centrifuge tubes. The tubes had been sterilized with a 30-min ultraviolet light treatment. Femurs were then transferred to an ultraclean table, after which they were washed thrice with PBS supplemented with 1% penicillin–streptomycin. The epiphyses at both ends of the femur were removed, exposing the inner bone marrow cavity, which was then repeatedly flushed with base medium using a 5 mL syringe. The resultant cell-containing medium was transferred to 100 mm cell culture dishes. After 48 h, non-adherent cells were removed. Cells were then cultured to 80% confluence for subsequent use.
The osteogenic induction medium, composed of 50 mL of the base medium supplemented with 10 mM β-glycerophosphate, 50 μM ascorbic acid, and 100 nM dexamethasone, was used for culturing BMSCs. Briefly, BMSCs from the third passage were seeded in 24-well plates, and the prepared osteogenic medium was added to each well. Medium was replaced every 3 days.
At 1 week after osteogenic induction, ALP staining was performed. Briefly, the osteogenic medium was removed from all wells, and cells were rinsed thrice with PBS, followed by fixation for 15 min using paraformaldehyde. After three additional washes with PBS, the BCIP/NBT staining solution was prepared based on the instructions provided with an ALP assay kit and added to each well. Cells were incubated in the dark at room temperature for 30 min, after which the staining solution was removed, and cells were washed thrice with PBS prior to imaging with an inverted microscope. ALP Activity Detection and BCA Protein Assay kits were then used based on the provided direction for quantifying ALP activity levels.
At 3 weeks after the start of osteogenic induction, ARS staining was initiated. Briefly, the osteogenic medium was removed from all wells, and cells were rinsed thrice with PBS, followed by fixation for 15 min using paraformaldehyde. After three additional washes with PBS, prepared ARS solution was added in each well, and plates were incubated at room temperature for 30 min, after which the staining solution was removed, and cells were washed thrice with PBS prior to imaging with an inverted microscope. Lastly, calcium nodules were dissolved using 10% cetylpyridinium chloride, and absorbance at 570 nm was analyzed via a microplate reader.
Statistical analyses
Data expressed as mean ± standard deviation (SD) were analyzed with GraphPad Prism (USA) using independent samples t-tests and one-way ANOVAs; P < 0.05 was set as the significance threshold.
- SEO Powered Content & PR Distribution. Get Amplified Today.
- PlatoData.Network Vertical Generative Ai. Empower Yourself. Access Here.
- PlatoAiStream. Web3 Intelligence. Knowledge Amplified. Access Here.
- PlatoESG. Carbon, CleanTech, Energy, Environment, Solar, Waste Management. Access Here.
- PlatoHealth. Biotech and Clinical Trials Intelligence. Access Here.
- Source: https://www.nature.com/articles/s41598-023-50108-1