Study approval
All patient samples were obtained from individuals enrolled in a retrospective natural history study [Myelin Disorders Bioregistry at Children’s Hospital of Philadelphia (IRB#14-011236)]. Informed consent was obtained from all subjects.
Cohort identification
Inclusion criteria were known AGS-related genotypes and availability of cholesterol measurements. Individuals without a known genotype or with absence of medical records were excluded.
Lipid laboratory value collection and classifications
The following variables were collected for all samples as available: age at sample collection, genotype, and cholesterol panel results. Laboratory values were extracted from electronic medical records. Upper and lower limits of normal were collected as well. When patients were enrolled in a Janus kinase inhibitor study, only baseline values were collected. When multiple values were available, the first available level was provided.
Maintenance of PSC cultures
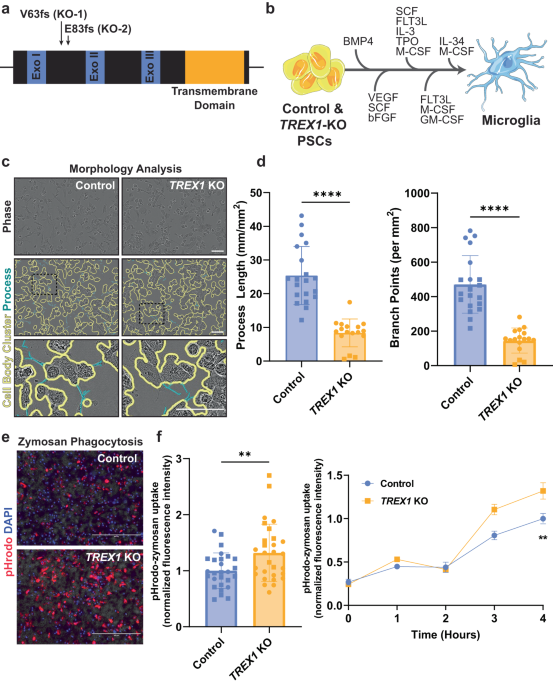
Isogenic mutagenized H9 ESCs have been characterized previously [15]. Pluripotent stem cell colonies were cultured and passaged manually as small colonies on Matrigel-coated dishes (BD Biosciences, San Jose, CA, USA) with mTeSR™ Plus medium (StemCell Technologies, Vancouver, Canada).
Mycoplasma testing
All cellular and tissue cultures were routinely tested for mycoplasma. Antibiotic-free media supernatants were collected, centrifuged, and resuspended in saline buffer. Ten microliters of each sample were assayed in a PCR with the following primers:
Forward: GGCGAATGGGTGAGTAAC;
Reverse: CGGATAACGCTTGCGACCT.
Mycoplasma-positive samples were immediately discarded and not used in the study.
Differentiation of PSCs to microglia
A protocol previously developed [39] and adapted from [83] and [84] was used to differentiate PSCs to microglia. Prior to initiating differentiation, PSC colonies were gently dissociated using a 1:1 solution of AccutaseⓇ (Innovative Cell Technologies, San Diego, CA, USA) and PBS for 20 min at 37 °C and seeded at a concentration of about 800,000 cells per 10 cm matrigel-coated dish. Colonies were maintained in mTeSR™ Plus medium for about three days until the dish was about 70% confluent. The differentiation protocol consists of four sequential steps: primitive streak cell induction, hemangioblast-like hematopoietic precursors, myeloid differentiation, and monocyte generation. In the first step, primitive streak cells were induced by the addition of Bone Morphogenetic Protein – 4 (BMP-4, 80 ng/mL, Peprotech) to the mTeSR™ Plus medium with daily media changes for three days. In the second step (Day 4), cells were pushed to differentiate into hemangioblast-like hematopoietic precursors with the addition of a cocktail of three factors [Vascular Endothelial Growth Factor 121 (VEGF, 80 ng/mL, Peprotech), Stem Cell Factor (SCF, 100 ng/mL, Gemini Bio), and Fibroblast Growth Factor basic (bFGF, 25 ng/mL, Life Technologies)] in Microglial Precursor Differentiation Media (MPDM) which consists of StemPro-34 serum-free medium (SFM) (Thermo Fisher Scientific) supplemented with GlutaMax (2 mM, Thermo Fisher Scientific). In the third step (Day 6), the hematopoietic precursor cells were pushed towards myeloid differentiation with a different cocktail of factors [Fms-Like Tyrosine Kinase-3 ligand (FLT-3 ligand, 50 ng/mL, Gemini Bio), Interleukin-3 (IL-3, 50 ng/mL, Gemini Bio), Stem Cell Factor (SCF, 50 ng/mL, Gemini Bio), Thrombopoietin (TPO, 5 ng/mL, Peprotech), and Macrophage Colony-Stimulating Factor (M-CSF, 50 ng/mL, Gemini Bio)] in the MPDM for twelve days with media changes on days 6 and 10. In step four (Day 13), cells were fated into the monocytic lineage with supplementation of a cocktail of factors [FLT-3 ligand (50 ng/mL, Gemini Bio), M-CSF (50 ng/mL, Gemini Bio), and Granulocyte Macrophage Colony-Stimulating Factor (GM-CSF, 25 ng/mL, Peprotech)] in the MPDM with media changed twice a week. Cells produced in suspension in step 4 were recovered by centrifugation, resuspended in brain organoid media supplemented with M-CSF (50 ng/mL, Gemini Bio) and Interleukin-34 (IL-34, 50 ng/mL, BioLegend), replated and allowed to mature for one week prior to use in experiments.
RT-qPCR analysis
Total RNA was obtained from microglia using the RNeasy Plus Micro Kit (QIAGEN, Hilden, Germany). RNA was then used to generate cDNA using the QuantiTectⓇ Reverse Transcription Kit (QIAGEN, Hilden, Germany), and 10 ng of cDNA was assayed in each 20 µL qPCR reaction in triplicate using individual primers (Integrated DNA Technologies, Coralville, IA, USA) and iQ™ SYBRⓇ Green Supermix (Bio-Rad Laboratories, Hercules, CA, USA). Thermal cycling and plate readings were performed on a Bio-Rad CFX Connect™ Real-Time System. Relative gene expressions were calculated using the ΔΔCT method and GAPDH as a reference gene. For the detection of L1 ORFs, 10 ng of microglia cDNA was assayed in 12 µL qPCR reactions using TaqMan™ probes and the TaqMan™ Fast Advanced Master Mix (Life Technologies). The L1 probes were described previously [15].
ORF1:ATGGGGAAAAAACAGAACAGAAAAACTGGAAACTCTAAAACGCAGAGCGCCTCTCCTCCTCCAAAGGAACGCAGTTCCTC
ORF2:GCTCATGGGTAGGAAGAATCAATATCGTGAAAATGGCCATACTGCCCAAGGTAATTTACAGATTCAATGCCATCCCCATC
ORF2-3′UTR:TGGAAACCATCATTCTCAGTAAACTATCGCAAGAACAAAAAACCAAACACCGCATATTCTCACTCATAGGTGGGAATTGA
List of Primers:
|
Target |
Forward sequence |
Reverse sequence |
|---|---|---|
|
GAPDH |
GTCTCCTCTGACTTCAACAGCG |
ACCACCCTGTTGCTGTAGCCAA |
|
ABCA1 |
CAGGCTACTACCTGACCTTGGT |
CTGCTCTGAGAAACACTGTCCTC |
|
ACAT1 |
CCAGCCACTAAGCTTGGTTCCA |
GTAGGAGCTTGTCCTTCACCTC |
|
ACAT2 |
TGGTGCCTTAGCTGCTGTTCCT |
GGCTTGTCTAACAGGATTCTGCC |
|
DHCR7 |
TCCACAGCCATGTGACCAATGC |
CGAAGTGGTCATGGCAGATGTC |
|
DHCR24 |
CAGGAGAACCACTTCGTGGAAG |
CACATGCTTAAAGAACCACGGC |
|
HMGCR |
GACGTGAACCTATGCTGGTCAG |
GGTATCTGTTTCAGCCACTAAGG |
Cytokine assay
For type I IFN cytokine measurements in culture supernatants, 50,000 cells were seeded into individual wells of a 96-well plate, allowed to mature for 4–7 days, then treated and cultured for 48 h prior to collecting supernatant. Concentrations of cytokines and chemokines were quantified using the U-PLEX Interferon Combo (hu) kit (Meso Scale Discovery) according to the manufacturer’s instruction. Measurements were performed on the MSD Imager MESO QuickPlex SQ 120.
Microglia zymosan phagocytosis assay
For phagocytosis assays, microglial precursor cells were seeded onto 96-well black-wall clear-bottom plates (Greiner) at a concentration of 35,000 cells in 200 μL of media per well. Cells were allowed one week to mature prior to addition of treatments. About 18–24 h after treatment, 5 µg of pHrodo Red Zymosan Bioparticles (Thermo Fisher Scientific) and Hoechst 33342, a cell-permeant live-cell nuclear stain, in 100 μL of media was added per well. Two phase contrast and red fluorescent images were acquired every hour for 4 h using an Incucyte S3 live-cell analysis system (Essen Bioscience) and fluorescence was measured at excitation wavelengths of 560 nm for pHrodo and 350 nm for Hoechst 33342 every hour for 4 h using an Infinite 200Pro microplate reader (Tecan). After 4 h, brightfield, red fluorescent, and DAPI images were taken and merged using an EVOS imaging system (Thermo Fisher Scientific). Uptake of pHrodo-zymosan particles was calculated by normalizing its fluorescence to the fluorescence of the nuclear stain each hour. Images were used for visual confirmation and representation.
Microglia morphology analysis
To determine differences in morphology of PSC-derived microglia, we utilized the automated imaging and analysis software of the Incucyte S3 live-cell analysis system (Essen Bioscience). Immediately prior to the addition of pHrodo Red Zymosan Bioparticles (Thermo Fisher Scientific) to measure phagocytosis and after cells were treated for at least 18 h, three brightfield images were taken per well at 20X magnification. For analysis, the NeuroTrack module was modified to accommodate our PSC-derived microglia with a minimum cell width of 15 µm and a minimum cell-body cluster of 100 µm2. Process length and number of branch points were normalized to the cell-body cluster area.
Microglia immunocytochemistry
Microglial precursor cells were seeded onto 8-chamber glass slides at a density of 50,000 cells per chamber. After one week of maturation, cells were fixed with 4% paraformaldehyde for 15 min at room temperature and washed with phosphate-buffered saline (PBS). Cells were blocked for 1 h in blocking solution [10% Bovine Serum Albumin (BSA)/1% Triton X-100/1(times) PBS]. Incubation with primary antibodies was performed in the same blocking solution overnight at 4 °C. Primary antibodies used were rabbit anti-IBA1 (Wako; 019-19741; 1:500), goat anti-TREM2 (R&D Systems; AF1828SP; 1:500), rabbit anti-CX3CR1 (Bio-Rad; AHP1589; 1:500), and rabbit anti-P2Y12R (Alomone; APR-020; 1:500). After 3 washes in 1(times) PBS, cells were labeled with fluorescently labeled secondary antibodies for 2 h, and nuclei were counterstained with 1 µg/mL DAPI (Thermo Fisher Scientific) for 10 min. Slides were mounted with ProLong Gold anti-fading solution (Thermo Fisher Scientific). Images were taken using a Zeiss fluorescence microscope equipped with Apotome (Axio Observer Apotome, Zeiss).
Microglia flow cytometry
Microglia were harvested, counted, then washed twice with 1(times) PBS/1% FBS at 300 (times) g for 5 min. Conjugated antibodies were added in the cell mixture and incubated at room temperature in the dark for 20–30 min. Antibodies used include the following: CD45 BV786 and CD11b APC, both from BD Biosciences. Cells were then washed twice in the same buffer as previously and resuspended in 500 µL buffer with the viability dye, 7-AAD (BD Biosciences). Cells were analyzed using a FACSCanto II (BD Biosciences) flow cytometer and FlowJo software.
Bulk RNA sequencing
Total RNA was obtained from microglia using the RNeasy Plus Micro Kit (QIAGEN, Hilden, Germany). Total RNA was assessed for quality using an Agilent Tapestation 4200, and samples with an RNA Integrity Number (RIN) greater than 8.0 were used to generate RNA sequencing libraries using the Illumina® Stranded mRNA Prep (Illumina, San Diego, CA). Samples were processed following manufacturer’s instructions. Resulting libraries were multiplexed and sequenced with 100 basepair (bp) Paired End reads (PE100) to a depth of approximately 25 million reads per sample on an Illumina NovaSeq 6000. Samples were demultiplexed using bcl2fastq Conversion Software (Illumina, San Diego, CA).
Quality of fastq files was assessed using FASTQC (version 0.11.8). Adapters were trimmed using cutadapt (version 1.16). Reads were mapped to the reference human genome (hg38) using STAR (version 2.7.8a). Gene counts were generated using featureCounts (version 2.0.1). Differential expression analysis was performed using DESeq2 (version 1.22.1) [85] with a two-factor design comparing control versus TREX1-KO microglia and accounting for the cell line (design formula: ~Line + Genotype). To aggregate transcript abundances into gene-level counts, we used tximport (version 1.10.0) [86]. Genes with an effect size (Log2FC) > |1.5| were filtered, and DE genes were determined based on their p-adj values (<0.05) calculated using the Benjamini–Hochberg multiple test correction.
To visualize DE genes between control and TREX1-KO microglia, a volcano plot was generated using ggplot2 (version 3.1.0) with a significance threshold of 0.05. A heatmap was also generated using gplots (version 3.0.1) where data was log2-transformed and rows were clustered using the Euclidean distance method. Gene ontology (GO) analysis was performed using goseq (version 1.44.0) [87] with parameters set for the Wallenius method and Benjamini–Hochberg multiple test correction.
Total sterol/oxysterol analysis
Lipid analysis was performed at the UCSD Lipidomics core [88]. Microglial cell pellets consisting of 2 million cells each were homogenized into 250uL of 10% methanol in water. An internal standard mix of 25-Hydroxycholesterol-d6, Desmosterol-d6, and Campesterol-d6 (Avanti Polar Lipids) was added to 100uL of the homogenate. Samples were saponified for 1.5 h at 37 °C with a final concentration of 0.2 N KOH. Samples were extracted with 500uL of butanol/methanol (3:1, v/v), heptane/ethyl acetate (3:1, v/v), and 1% acetic acid In water [89]. Extracts were brought to dryness and taken up in 90% methanol in water and run on a Waters Acquity UPLC interfaced with an AB Sciex 6500 QTrap mass spectrometer equipped with an APCI probe. Source settings were: Curtain Gas = 20, Collision Gas = Medium, Ion Spray Voltage = 5500, Temperature = 400, GS1 = 25, NC = 1. A Phenomenex Kinetex C18 1.7 μM 2.1 mm × 150 mm column was used for chromatographic separation. A 30 min step gradient was employed using 70/30 acetonitrile/water with 5 mM ammonium acetate as Buffer A and 50/50 acetonitrile/water with 5 mM ammonium acetate as Buffer B with a flow of 0.5 mL/min. The gradient started at 0%B for 2 min, ramped to 10%B over 4 min, 15%B over 9 min, 50%B over 11 min, 100%B over 2 min, then held at 100%B for 2 min. Sterol species were identified by mass spectrometry using 30 MRMs (Multiple Reaction Monitoring) in positive mode. Standard curves were obtained in parallel using identical conditions. Data analysis was performed with Analyst and Mulitquant software packages.
Lipid-droplet assay
To measure lipid droplets, microglial precursor cells were plated onto 8-chamber glass slides at a density of 50,000 cells per chamber. Cells were allowed to mature for 4 days prior to the addition of treatments. About 18–24 h after treatment, cells were incubated with fresh media supplemented with BODIPY™ 493/503 (Thermo Fisher Scientific) and Hoechst 33342 for 30 min. Cells were then washed with PBS and fixed in 4% Paraformaldehyde for 15 min at room temperature. Slides were then mounted using Prolong Gold and allowed to dry overnight prior to imaging.
Lipid droplets were imaged at 63× magnification using a Zeiss fluorescence microscope equipped with Apotome (Axio Observer Apotome, Zeiss). Lipid droplets were counted and their area was measured using the Fiji image processing package equipped with ImageJ2 [90].
Microglia drug treatment
Control cells were treated with either DMSO or polyinosinic–polycytidylic acid sodium salt [poly (I:C), 50 μg/mL, Sigma–Aldrich], and TREX1-KO cells were treated with either DMSO, Atorvastatin (1 µM, Sigma–Aldrich), or RTis [3TC (10 µM, Sigma–Aldrich) and D4T (1 µM, Sigma–Aldrich)].
Differentiation of PSCs to oligodendrocyte-containing brain organoids and assembloid generation
For the generation of oligodendrocyte-containing organoids (hOLS or organoids), we used a previously published protocol [37] with some modifications. Briefly, PSC colonies were dissociated using Accutase (Thermo Fisher Scientific; diluted with an equal volume of 1(times) PBS) for 20 min at 37 °C. After centrifugation for 3 min at 150 (times) g, the individualized cells were resuspended in mTeSR1 Plus medium (Stem Cell Technologies) supplemented with 10 µM Rho kinase inhibitor (Y-27632; Calbiochem, Sigma–Aldrich), and 3 (times) 106 cells were added per AggreWell-800 (Stem Cell Technologies) well and centrifuged to capture cells in microwells. Spheroids consisting of about 10,000 cells were collected from the microwells after 24 h by pipetting up and down with a cut pipet tip and transferred to an ultra-low attachment 6-well plate. Neural differentiation was induced by supplementation with 2.5 µM dorsomorphin (R&D Systems) and 10 µM SB431542 (Stemgent) in mTeSR1 Plus medium for 5 days. Organoids were maintained on an orbital shaker inside a CO2 incubator at 95 rpm. On day 4, 5 µM of the Wnt inhibitor IWP-2 (Selleck Chemical) was supplemented until day 24. On day 6, mTeSR1 Plus medium was replaced with differentiation and maintenance medium (DMM) consisting of DMEM/F12 (Thermo Fisher Scientific) containing B27 without Vitamin A (Thermo Fisher Scientific), N2 NeuroPlex supplement (Gemini Bio-Products), non-essential amino acids (Thermo Fisher Scientific), penicillin/streptomycin (Thermo Fisher Scientific), GlutaMAX (Thermo Fisher Scientific), and 0.1 mM β-mercaptoethanol (Thermo Fisher Scientific). Media was supplemented with the following growth factors until day 24: 20 ng/mL EGF (Peprotech) and 20 ng/mL bFGF (Thermo Fisher Scientific). On day 12 until day 24, 1 µM smoothened agonist SAG (Sigma–Aldrich) was added to the media. On day 25 until day 36, DMM was supplemented with the following cocktail of factors: 25 µg/mL insulin (Sigma–Aldrich), 60 ng/mL T3 (Sigma–Aldrich), 100 ng/mL biotin (Sigma–Aldrich), 20 ng/mL NT-3 (Peprotech), 20 ng/mL BDNF (Peprotech), 1 µM cAMP (Thermo Fisher Scientific), 5 ng/mL hepatocyte growth factor (Peprotech), 10 ng/mL IGF-1 (Peprotech), and 10 ng/mL PDGF-AA (R&D Systems). On day 37 until endpoint, DMM was supplemented with the following cocktail of factors: 25 µg/mL insulin (Sigma–Aldrich), 60 ng/mL T3 (Sigma–Aldrich), 100 ng/mL biotin (Sigma–Aldrich), 1 µM cAMP (Thermo Fisher Scientific), and 20 µg/mL ascorbic acid (Sigma–Aldrich).
On Day 37, organoids were prepared for co-culture with microglia for assembloid generation. Individual organoids were placed into wells of ultra-low attachment u-bottom 96-well plates. Microglia precursor cells were resuspended in DMM supplemented with the day 37 organoid cocktail of supplements plus 50 ng/mL M-CSF (Gemini) and 50 ng/mL IL-34 (Biolegend) and 100,000 cells were added per well of the 96-well plate on top of the organoid to a total volume of 200 µL of media. Organoids and microglia were kept in the 96-well plate for 1 week prior to transferring to a 6-well plate and continuing to culture under orbital rotation.
Assembloid dissociation for single-cell RNA sequencing
Single-cell RNA-seq was performed on dissociated assembloids composed of control organoids and control or TREX1-KO microglia at 3 months in vitro, totaling 5 libraries consisting of 3 replicate libraries of assembloids composed of control organoids and control microglia, and 2 replicate libraries of assembloids composed of control organoids and TREX1-KO microglia. For each library, a total of 4–5 assembloids were used.
Assembloids were dissociated to a single-cell suspension via a combination of mechanical dissociation and enzymatic digestion. First, assembloids were mechanically broken apart using pipette tips in a 6-well plate. Immediately after, a combination of Accutase (Thermo Fisher Scientific) and Papain supplemented with DNase (Worthington) were added to the plate and incubated under orbital rotation. Clumps were dissociated every 10 min by pipetting up and down for a total of 30 min. Dissociated cells were pelleted (3 min, 100 (times) g) and resuspended in PBS. Cells were counted and viability was checked using an automated cell counter (Bio-Rad).
AmpliDrop 3′ scRNA-seq analysis
Single-cell suspensions were processed to generate single-cell libraries using AmpliDropTM technology according to the manufacturer’s instructions (preprint in preparation) and services provided by UST (Universal Sequencing Technology Corp., Carlsbad, CA). Approximately 9000 to 14,000 live cells were processed per sample. Fixed cells were permeabilized, reverse transcribed, and tagmented. Treated cells were encapsulated individually in water-in-oil droplets generated by controlled pipetting with an electronic pipette in a PCR tube. Tagged cDNA in a cell was subsequently amplified in the droplet along with unique barcode tags in a MiniAmp Thermal Cycler (Thermo Fisher), resulting in amplified 3′ end of cDNA fragments attached with a cell-specific barcode. Illumina sequencing adapters were added to barcoded cDNA to generate final single-cell libraries. Cleanup and size selection was performed using HighPrep PCR Clean-up MagBio magnetic beads (MagBio Genomics). Library quantification and sizing were made using High Sensitivity D1000 Screen Tape and the 4150 TapeStation system (Agilent Technologies). Samples were sequenced on the NextSeq instrument (Illumina) as single-end reads (10,500–17,500 mean reads per cell).
AmpliDrop 3′ scRNA-seq data processing, exploration, and visualization
Fastq files generated from AmpliDropTM libraries were processed using AmpliDropTM Analysis Pipeline v1.0 (UST). Processed fastq files were then used as input for Cell Ranger v5.0.1 (10x Genomics). Single Cell 3′ v3 (–chemistry threeprime) was the selected chemistry with introns (–include-introns) in Cell Ranger. Sequencing reads were aligned with STAR (v2.7.6) using the GRCh38 human reference genome. The R packages Seurat (v4.1.1) and Harmony (v0.1.0) were used for data filtering, normalization, scaling, dimensionality reduction, clustering, expression analysis, exploration, and visualization (DotPlot). Loupe Browser (v6.1.0) was used for data exploration and visualization (UMAP plots using Seurat-generated projections). Microsoft Excel (v16.65) was used for visualization (staggered and proportional plots).
Seurat objects were individually created from each sample using the CreateSeuratObject() function (min.cells = 3 and min.features = 200). Cells that had fewer or greater than 200 and 3000 features, respectively, and contained greater than 5% of reads from mitochondrial genes were considered low quality and removed from further analysis. No software (such as DoubletFinder) was used to infer and remove doublets owing to the risk of accidentally removing transitioning cell substates. Instead, we manually examined the data for unexpected co-localization of well-known cell-type-specific gene markers.
Data were normalized and scaled using the NormalizeData() and ScaleData() functions, respectively (scale factor = 10,000). Data were integrated based on 2000 highly variable genes using the FindVariableFeatures() function (selection.method = vst). Anchors between individual datasets were identified based on the subset of highly variable genes using the FindIntegrationAnchors() function (dims = 1:20). Anchors were then inputted into the IntegrateData() function (dims = 1:20) to create a batch-corrected expression matrix of all cells. Principal component analysis and UMAP dimension reduction were performed using the RunPCA() and RunUMAP() functions (npcs = 30; dims = 1:20). A nearest-neighbor graph was then calculated using the FindNeighbors() function (dims = 1:20), followed by clustering using the FindClusters() function (resolution = 0.5).
Cellular identity was determined by finding differentially expressed genes for each cluster using the FindMarkers() function and comparing the identified markers to known cell-type-specific genes, listed in Fig. 4c. Seurat-defined clusters were re-named based on these gene markers. Due to the relatively small fraction of microglial cells, microglia were identified in the context of a larger single-cell dataset characterized by C1QA, CX3CR1, CCL3, CD74, and C1QB co-expression.
The DotPlot() function was used to visualize the expression of selected genes in the oligodendrocyte subpopulations. Gene expression on UMAP plots was generated with Loupe Browser and Seurat/Harmony-corrected projections (Fig. S4A). Gene expression on UMAP plots visualized as densities was generated with the Nebulosa (v.1.8.0) package (Fig. 4b, f). Seurat/Harmony projections were exported using the cbind() function and uploaded directly into the Loupe Browser. Cell proportions were calculated with Excel from Seurat object labeling.
Pseudotime analysis was performed by sub-setting the Pre-OPC, T-OPC, OPC, Dividing OPC, and Astroglia populations from the Seurat object and creating a CellDataSet object compatible with the Monocle3 (v.1.3.4) package. Cell identities were transferred from Seurat object to a CellDataSet object using the AddMetaData() function. After multi-dimensional reduction using the reduce_dimention() function, we manually determined the start of the pseudotime (time zero) on the Pre-OPC population prompted by the order_cells() function.
Immunohistochemistry of assembloids
After 3 months of culture, assembloids were fixed with 4% paraformaldehyde overnight at 4 °C and cryoprotected in 30% sucrose for at least 24 h. Assmebloids were then embedded in TissueTek (Leica Microsystems) and sectioned on a Leica CM1850 cryostat to produce 20 µm sections. For staining, slides were air-dried for 10 min, blocked with 0.1% Triton X-100/3% BSA/1(times) PBS for 1 h at room temperature, and incubated with primary antibodies in the blocking solution overnight at 4 °C. For myelin visualization, the primary antibody used was rat anti-MBP (Millipore Sigma; MAB386; 1:500). After incubation in a solution containing the primary antibody, slides were washed three times in 1(times) PBS and incubated with fluorescently labeled secondary antibodies (Alexa Fluor 488- or 555-conjugates antibodies; 1:1000; Thermo Fisher Scientific) in blocking solution for 2 h at room temperature. After further washes in 1(times) PBS, slides were counterstained with DAPI solution (1 µg/mL) for 10 min and mounted with ProLong Gold anti-fading solution (Thermo Fisher Scientific). All images were taken using a Zeiss fluorescence microscope equipped with Apotome (Axio Observer Apotome, Zeiss).
Electron microscopy
Electron microscopy was performed at the CMM Electron Microscopy Facility at the University of California San Diego. 150-day-old assembloids were fixed with 2%glut. in 0.10 M cacodylate buffer. and further postfixed in 1% OsO4 in 0.1 M cacodylate buffer for 1 h on ice. The cells were stained all at once with 2% uranyl acetate for 1 hr on ice, following which they were dehydrated in graded series of ethanol (50–100%) while remaining on ice. The cells were then subjected to 1 wash with 100% ethanol and 2 washes with acetone (10 min each) and embedded with Durcupan. Sections were cut at 60 nm on a Leica UCT ultramicrotome, and picked up on 300 mesh copper grids. Sections were post-stained with 2% uranyl acetate for 5 min and Sato’s lead stain for 1 min. Grids were analyzed using a JEOL 1400 plus (JEOL, Peabody, MA, USA) transmission electron microscope equipped with a bottom-mount Gatan OneView (4k × 4k) camera (Gatan, Pleasanton, CA, USA).
Statistical analysis
Statistical analyses were performed using GraphPad Prism. The reported values are means ± SD or SEM, noted in the figure legend for each panel. Unless otherwise noted in the figure legend, n = 2 cell lines for genotypes CTRL (WT63, WT83) and TREX1-KO (V63fs, E83fs). Statistical significance was determined using Student’s t tests when comparing two groups or ordinary one-way ANOVA when comparing three or more groups. Variance within datasets for each experiment were similar between the CTRL and TREX1-KO groups being compared.
- SEO Powered Content & PR Distribution. Get Amplified Today.
- PlatoData.Network Vertical Generative Ai. Empower Yourself. Access Here.
- PlatoAiStream. Web3 Intelligence. Knowledge Amplified. Access Here.
- PlatoESG. Carbon, CleanTech, Energy, Environment, Solar, Waste Management. Access Here.
- PlatoHealth. Biotech and Clinical Trials Intelligence. Access Here.
- Source: https://www.nature.com/articles/s41380-023-02348-w