iISC-BOs exhibit a CpG methylation signature that closely resembles ISC-BOs
Genomic DNA was extracted from MEFs, iISC-BOs, and ISC-BOs, and high-resolution methylome analysis was performed using the PBAT method (Fig. 1A). The genome-wide methylation states of cytosine-containing sequences such as CpG, CHH, and CHG were compared among the samples. The data showed that CpG methylation signatures were similar among replicates and between iISC-BOs and ISC-BOs (Pearson’s correlation coefficient [R] = 0.76–0.84), whereas substantial differences were found between iISC-BOs and MEFs, and between ISC-BOs and MEFs (R = 0.45–0.65; Fig. 1B,C, and Supplementary Fig. 1). The methylation states of CHH and CHG were highly correlated in comparison to iISC-BOs with their replicates and with ISC-BOs, and MEFs (R = 0.97–1.00; Fig. 1C and Supplementary Fig. 1).
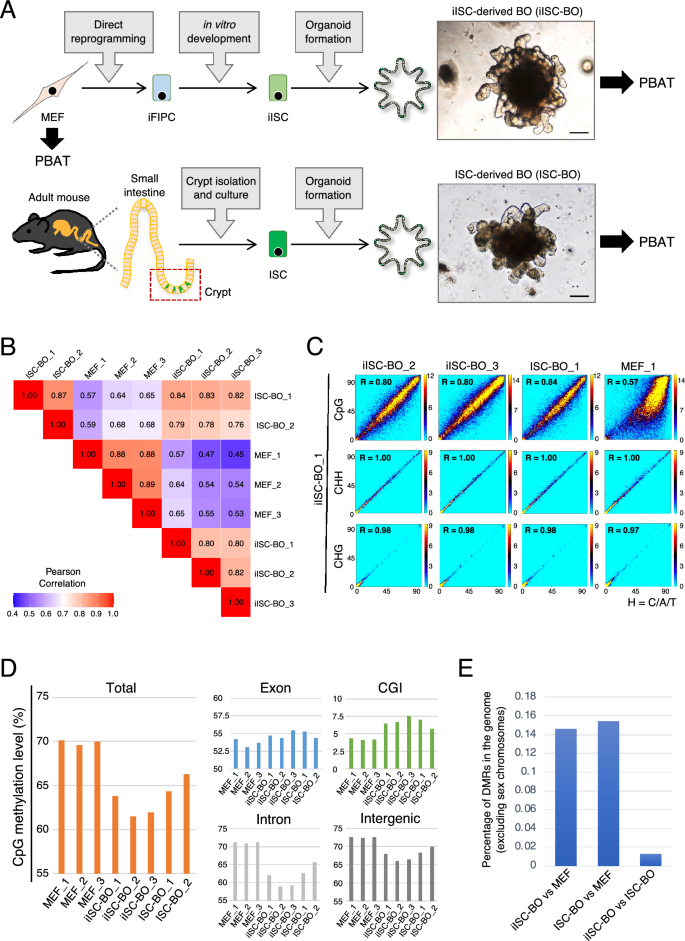
Genome-wide DNA methylation analysis of MEFs, iISC-BOs, and ISC-BOs. (A) Scheme of the overall experiment. Photos show bright filed images of BOs. Scale bars, 100 μm. (B) Pearson’s correlation analysis of genome-wide CpG methylation between samples. (C) Density plots comparing genome-wide CpG, CHH, and CHG methylation status between samples. The window and step sizes were set to be 1 kbp and 500 bp, respectively. R scores indicate Pearson’s correlation coefficient. (D) Averaged CpG methylation levels in each region, which was calculated when the number of reads mapped within a given region was five or more and there were five or more cytosines. (E) Genomic occupancy of the DMRs between cells. As a pretreatment of the methylation data analysis, only cytosines assigned with 10 or more reads and located on autosomes were selected.
In a genome-wide view, the total CpG methylation levels of MEFs were 69.6–70.1%, whereas those of ISC-BOs and iISC-BOs were 64.3–66.3% and 61.5–63.8%, respectively (Fig. 1D, the left panel). The CpG methylation levels of the introns and intergenic regions that occupy most of the genome showed the same tendencies as those of the total regions (Fig. 1D, right bottom panels). In contrast, the exons and CpG islands (CGIs) that may have an impact on transcriptional regulation exhibited slightly higher and higher levels of CpG methylation, respectively, in both iISC-BOs and ISC-BOs in comparison to that of MEFs (Fig. 1D, right upper panels). Moreover, the percentage of DMRs between iISC-BOs and ISC-BOs was one-tenth that between MEFs and iISC-BOs or ISC-BOs (Fig. 1E). Taken together, our data demonstrate that direct reprogramming from MEFs to iISCs is associated with variations in genome-wide CpG methylation and allows the generation of iISC-BOs that have a CpG methylation state similar to ISC-BOs. Additionally, we confirmed the gene expression of writers, readers, and erasers of the DNA methylation from previous microarray data26. The expression of some of the genes was changed during the direct reprogramming from MEFs to iISC-BOs, however, no genes showed significant difference of expression between ISC-BOs and iISC-BOs (Supplementary Fig. 2).
Genome-wide similar distribution patterns of DMRs between MEFs and iISC-BOs or ISC-BOs result in a similar gene expression pattern of iISC-BOs and ISC-BOs
We sought to identify the genomic loci of DMRs between MEFs and iISC-BOs or ISC-BOs to investigate the transition of the CpG methylation state from MEFs to iISCs in more detail. The numbers of DMRs with hypermethylation in iISC-BOs (iISC-high DMRs) or ISC-BOs (ISC-high DMRs) and those with hypomethylation in iISC-BOs (iISC-low DMRs) or ISC-BOs (ISC-low DMRs) were not significantly different, whereas the numbers of iISC/ISC-low DMRs were slightly higher than those of iISC/ISC-high DMRs (Fig. 2A). Genome-wide distribution analysis revealed that the genomic loci of iISC-low and ISC-low DMRs and those of iISC-high and ISC-high DMRs were similarly distributed in the intergenic regions and regions of introns and exons, respectively (Fig. 2B). To examine how similar distribution patterns of iISC/ISC-low and iISC/ISC-high DMRs affected gene expression, we investigated the expression of DMR-associated genes by reanalyzing our previous transcriptome data obtained from MEFs, iISC-BOs, and ISC-BOs26. To identify DMR-associated genes, we focused on iISC/ISC-low DMRs and iISC/ISC-high DMRs located within 10 kbp upstream and downstream of the TSS (Fig. 2C) because CpG methylation near the TSS affects transcription30. We found that genes associated with iISC-low DMRs and ISC-low DMRs and those associated with iISC-high DMRs and ISC-high DMRs were similarly expressed between iISCs and ISCs compared with MEF (Fig. 2D and Supplementary Table 1). Thus, the similarity in the genome-wide distribution patterns of iISC-low and ISC-low DMRs and those of iISC-high and ISC-high DMRs may contribute to the similar gene expression patterns of iISC-BOs and ISC-BOs.
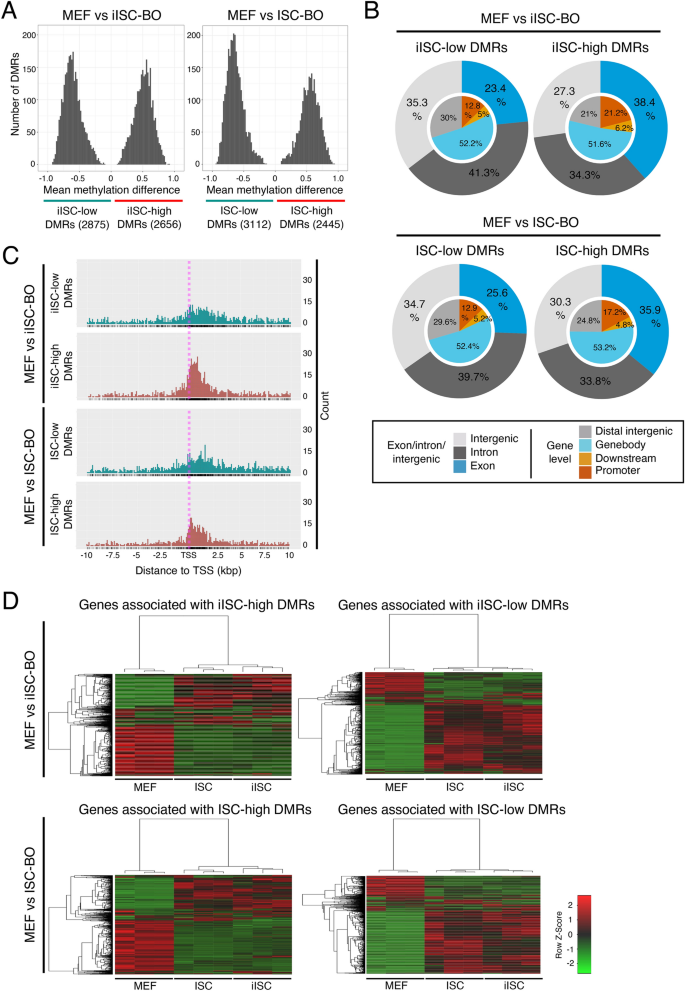
Analysis of DMRs between MEFs and iISC-BOs or ISC-BOs. (A) Histograms showing mean methylation difference of DMRs between MEFs and iISC-BOs or ISC-BOs. (B) Pie charts showing genomic position of detected DMRs. Outer and inner circles indicate genomic position with different definitions. (C) Dot plots showing distribution of DMRs around TSS of DMR-associated genes. (D) Heatmaps showing expression level of the DMR-associated genes. As a pretreatment of the methylation data analysis, only cytosines assigned with 10 or more reads and located on autosomes were selected.
iISC-BOs have hyper- and hypo-methylated DNA, compared with ISC-BOs
As shown above, the CpG methylation state and the resulting gene expression pattern in iISC-BOs were similar to those in ISC-BOs. However, they were not the same. Thus, we examined the genomic loci of DMRs between iISC-BOs and ISC-BOs to explore the differences in CpG methylation states between these two samples. Our data showed that hypermethylation of DMRs in iISC-BOs (hyper DMRs) was more than twice as high as hypomethylation in iISC-BOs (hypo DMRs), suggesting that DNA methylation is induced more frequently than DNA demethylation during direct reprogramming from MEFs to iISCs (Fig. 3A). Heatmaps showing the average CpG methylation rates in the hyper-/hypo-DMRs among MEFs, iISC-BOs, and ISC-BOs revealed that these hyper-/hypo-DMRs could be mainly divided into two groups: those that maintain the levels of CpG methylation in the process of direct reprogramming from MEFs to iISCs, and those that represent insufficient or excessive CpG methylation in only iISC-BOs (Fig. 3B).
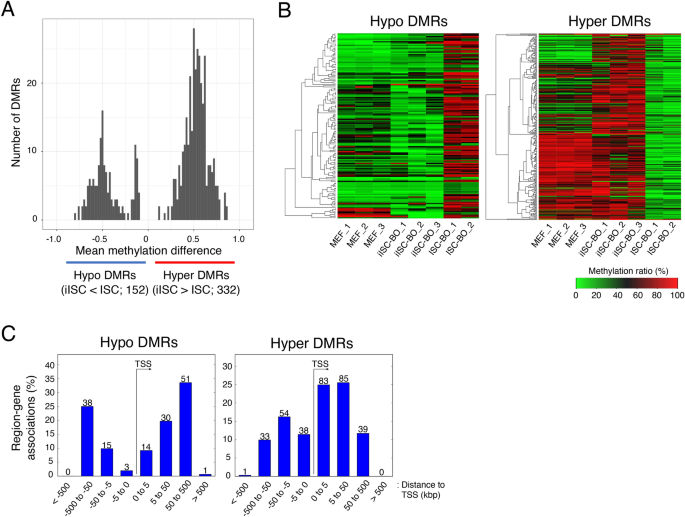
Analysis of DMRs between iISC-BOs and ISC-BOs. (A) Histogram showing mean methylation difference of DMRs between iISC-BOs and ISC-BOs. (B) Heatmaps showing averaged methylation ratio of detected DMRs in each sample. (C) Relative distance of detected DMRs from TSS of DMR-associated genes. The numbers above the bar plots indicate the counts of DMRs. As a pretreatment of the methylation data analysis, only cytosines assigned with 10 or more reads and located on autosomes were selected.
It has been reported that CpG methylation yielded around the TSS affects their transcription30. Thus, we analyzed the genomic loci of the hyper-/hypo-DMRs around the TSS to examine the possibility that these hyper-/hypo-DMRs affect gene transcription. Our data demonstrated that the hyper-DMRs were located in regions distal and proximal to the TSS, whereas the hypo-DMRs were mainly located in regions distal to the TSS (Fig. 3C). Thus, hyper DMRs contribute more frequently to the misregulation of gene expression in iISCs than hypo DMRs.
iISC-BOs have a cellular reprogramming-associated aberrant DNA methylation signature
As shown in Fig. 3, an abnormal DNA methylation state may be induced during direct reprogramming. Reprogramming-associated aberrant DNA methylation signatures can be classified into at least two groups. One is an original cell type-specific DNA methylation signature that should be changed but are abnormally maintained in reprogrammed cells (maintained DNA methylation: mDNA methylation), and the other is a DNA methylation signature that is abnormally acquired or erased in only reprogrammed cells (specific DNA methylation: sDNA methylation). To identify regions with mDNA or sDNA methylation in iISC-BOs, DMRs between iISC-BOs and ISC-BOs were divided into two groups based on the overlap with DMRs between MEF and ISC-BOs (Fig. 4A). When there was an overlap, iISCs still had an MEF-specific DNA methylation signature, indicating an mDNA methylation signature in iISCs. When there was no overlap, iISCs had a DNA methylation signature that was distinct from that of MEFs and iISCs, indicating an sDNA methylation signature in iISCs. Our data demonstrated that both hyper- and hypo-DMRs could be divided into regions with mDNA or sDNA methylation signatures, and that DMRs with sDNA methylation signatures were found more frequently than those with mDNA methylation signatures (Fig. 4B). Genome-wide distribution analyses revealed that both mDNA and sDNA methylation was detected at higher frequencies in exons with hyper-DMRs than in those with hypo-DMRs (Fig. 4C). Because hypermethylation of gene body CGIs is considered a result of enhanced transcription31, our data suggest that the mDNA and sDNA methylation signatures found in exons with hypermethylated DMRs reflect errors in transcriptional activation during direct reprogramming from MEFs to iISCs.
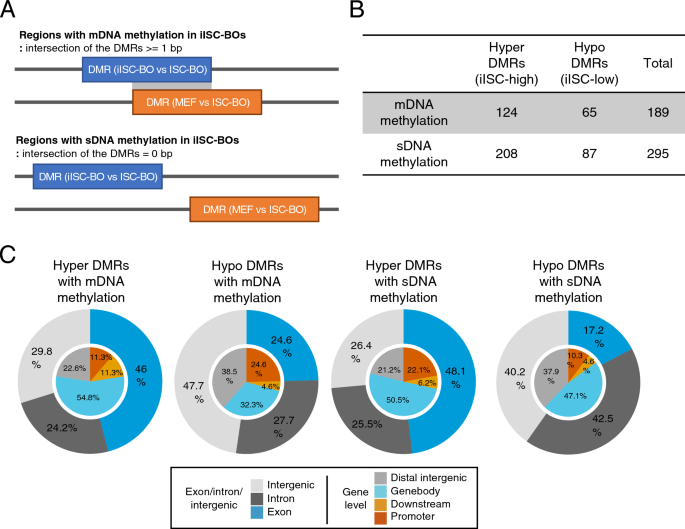
Classification and genomic positioning of abnormally methylated/unmethylated regions in iISC-BOs. (A) Definition of DMRs with mDNA and sDNA methylation in iISC-BOs (upper and bottom figures, respectively). (B) Number of DMRs in each class: hyper-DMRs with mDNA methylation, hyper-DMRs with sDNA methylation, hypo-DMRs with mDNA methylation, and hypo-DMRs with sDNA methylation. (C) Pie charts showing genomic position of DMRs in each class. Outer and inner circles indicate genomic position with different definition.
Abnormal DNA methylation in iISC-BOs has little effect on gene expression
Our present data suggest that hyper-/hypo-DMRs affect the transcriptional levels of genes and lead to the misregulation of gene expression in iISC-BOs. Our previous study demonstrated that the transcriptional signature of iISC-BOs closely resembles that of ISC-BOs, although a small number of differentially expressed genes (DEGs) were found between iISC-BOs and ISC-BOs26. Thus, in this study, we examined the relationship between hyper-/hypo-DMRs and DEGs, both of which were identified in iISC-BOs and ISC-BOs. Genes that contained hyper/hypo-DMRs within 10 kb upstream and downstream of the TSS were extracted and divided into DMRs with mDNA or sDNA methylation signatures (Fig. 5A). Among these hyper-/hypo-DMR-associated genes, hyper-DMRs were found at high frequencies downstream of the TSS, including the gene body, whereas only a few hypo-DMRs were found within 10 kbp upstream and downstream of the TSS (Fig. 5A). In addition, sDNA methylation was found more frequently than mDNA methylation in hyper-DMR-associated genes (Fig. 5A). These data suggest that hyper-DMRs are involved in the regulation of DEGs between iISC-BOs and ISC-BOs.
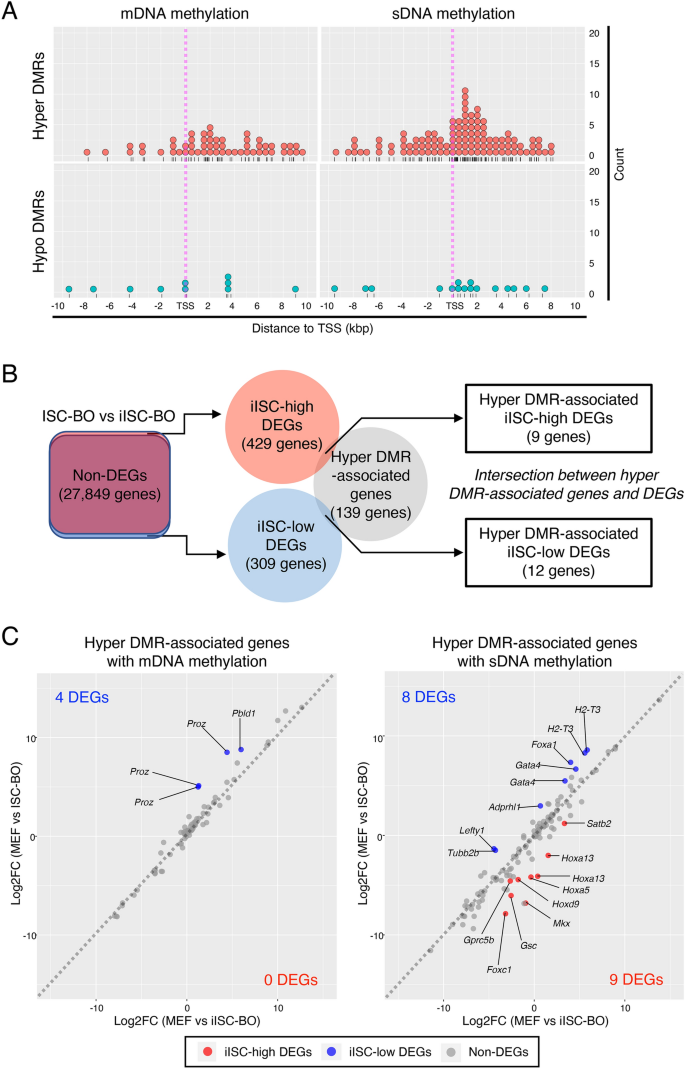
Trans-omic analysis for hyper-DMR-associated genes. (A) Dot plots showing distribution of hyper- (upper plots) and hypo- (lower plots) DMRs with mDNA (left plots) and sDNA (right plots) methylation around TSS of DMR-associated genes. (B) Right Venn diagram indicates intersection between genes associated with hyper-DMRs and iISC-high or -low DEGs which were detected from a comparative analysis between iISC-BO and ISC-BOs (left Venn diagram). (C) Scatter plots showing log-fold change of gene expression (Log2FC) of the hyper-DMR-associated genes between MEFs and ISC-BOs (vertical axis), and these between MEFs and iISC-BOs (horizonal axis). Left and right plots indicate hyper-DMR-associated genes with mDNA and sDNA methylation, respectively.
To examine this possibility, we classified DEGs into genes expressed at higher or lower levels in iISC-BOs than in ISC-BOs, designated iISC-high DEGs or iISC-low DEGs, respectively, and compared each of them with hyper-DMR-associated genes (Fig. 5B). Our data demonstrated that the number of genes contained in the hyper-DMR-associated genes and iISC-high DEGs or iISC-low DEGs were 9 and 12, respectively (Fig. 5B). These genes comprised only 6.5% and 8.6% of the hyper-DMR-associated genes, respectively. Scatter plots showing fold-differences in the expression of hyper-DMR-associated genes revealed that nine genes have hyper-DMRs with an sDNA methylation signature, while the 12 genes are divided into four and eight genes that have DMRs with an mDNA and sDNA methylation signature, respectively (Fig. 5C). Nevertheless, the expression levels of the majority of hyper-DMR-associated iISC-high and iISC-low DEGs (Foxc1, Gprc5b, Hoxa5, Satb2, H2-T3, Gata4, Lefty1, Foxa1, Tubb2b, Pbld1, and Proz) were significantly upregulated or downregulated in iISC-BOs compared to MEF, in the same manner as in ISC-BOs, while those of other DEGs (Hoxa13, Gsc, Hoxd9, Mkx, and Adprhl1) did not change significantly (Fig. 6).
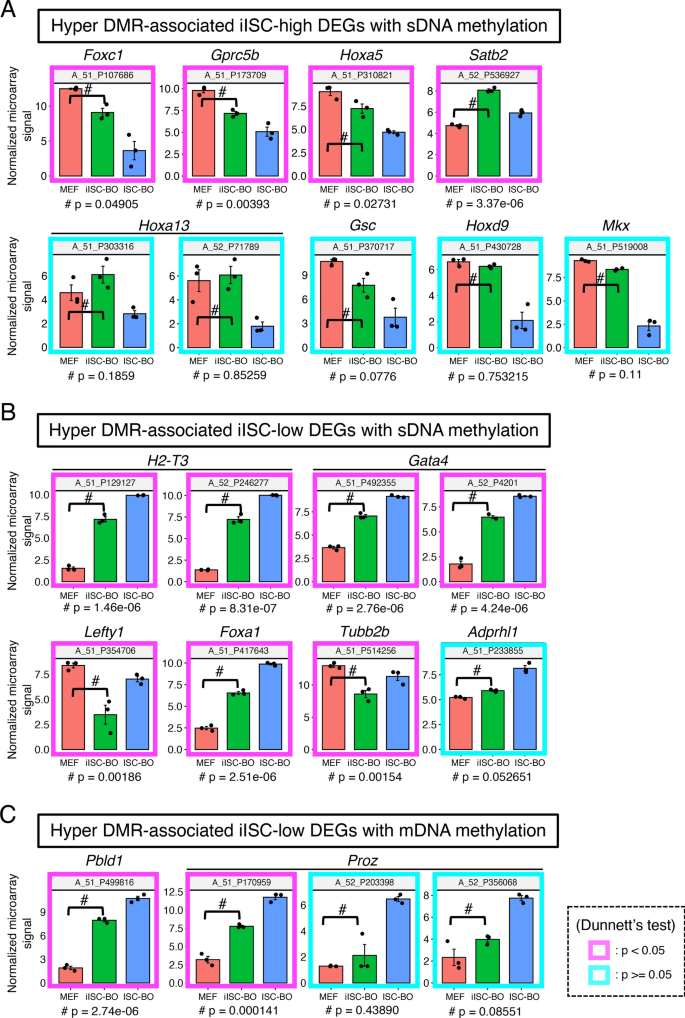
Gene expression analysis for hyper-DMR-associated DEGs. (A) Gene expression levels of hyper-DMR-associated iISC-high DEGs with sDNA methylation. (B) Expression levels of hyper-DMR-associated iISC-low DEGs with sDNA methylation. (C) Expression levels of hyper-DMR-associated iISC-low DEGs with mDNA methylation. Vertical axes of all plots indicate normalized and log-transformed microarray signals. Probe IDs of the microarray corresponding to the transcripts are indicated at the top of each plot. Transcripts showing significant differences in expression between MEFs and iISC-BOs are shown in the magenta box (p < 0.05) and those with no difference are shown in cyan boxes (p > 0.05). Dunnett’s test was used for statistical analysis.
In addition to the hyper-DMR-associated genes, the hypo-DMR-associated genes also overlapped with iISC-high and iISC-low DEGs, although the number of overlapping genes was only three and five, respectively (Fig. 7A). Five genes had hypo-DMRs with an sDNA methylation signature, while three genes were divided into one and two genes that had DMRs with mDNA and sDNA methylation signatures, respectively (Fig. 7B). Similar to the case of hyper-DMR-associated iISC-high and iISC-low DEGs, the hypo-DMR-associated iISC-high and iISC-low DEGs (Foxa1, Onecut1, Onecut2 and Ddr2), except for Hoxa9, were expressed at much higher or lower levels than in MEFs and ISC-BOs (Fig. 7C). Taken together, our data demonstrated that almost all abnormal DNA methylation states in iISC-BOs may not be involved in the dysregulation of genes that are normally expressed or silenced in ISC-BOs.
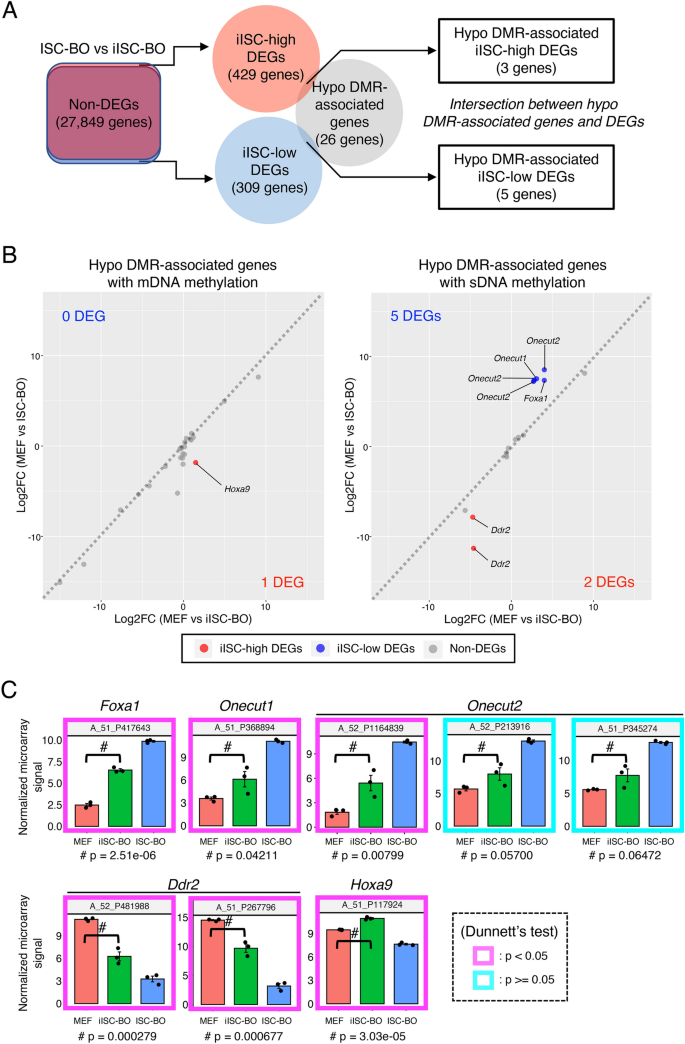
Trans-omic analysis for hypo-DMR-associated genes. (A) The right Venn diagram indicates the intersection between genes associated with hypo-DMRs and iISC-high or -low DEGs, which were detected from a comparative analysis between iISC-BO and ISC-BOs (left Venn diagram). (B) Scatter plots showing log-fold changes in gene expression (Log2FC) of the hypo-DMR-associated genes between MEFs and ISC-BOs (vertical axis) and between MEFs and iISC-BOs (horizontal axis). Left and right plots indicate hypo-DMR-associated genes associated with mDNA and sDNA methylation, respectively. (C) Expression levels of hypo-DMR-associated DEGs. Vertical axes of all plots indicate normalized and log-transformed microarray signals. Probe IDs of the microarray corresponding to the transcripts are indicated at the top of each plot. Transcripts showing significant differences in expression between MEFs and iISC-BOs are shown in the magenta box (p < 0.05) and those with no difference are shown in cyan boxes (p > 0.05). Dunnett’s test was used for statistical analysis.
- SEO Powered Content & PR Distribution. Get Amplified Today.
- PlatoData.Network Vertical Generative Ai. Empower Yourself. Access Here.
- PlatoAiStream. Web3 Intelligence. Knowledge Amplified. Access Here.
- PlatoESG. Carbon, CleanTech, Energy, Environment, Solar, Waste Management. Access Here.
- PlatoHealth. Biotech and Clinical Trials Intelligence. Access Here.
- Source: https://www.nature.com/articles/s41598-023-49546-8