Study area
The Bukit Tigapuluh landscape (BTL) is situated in the centre of Sumatra Island (1°4′27.72ʺS and 102°30′43.89ʺE) and spans across two provinces, namely Riau and Jambi (Fig. 4). The area encompasses over 3500 km2 of land, including the Bukit Tigapuluh National Park (1440 km2) and is home to the Talang Mamak indigenous community68. The study area of BTL includes the Datuk Gedang Essential Ecosystem Area (KEE), which covers 618.29 km2. The original vegetation, composed of extremely species-rich dipterocarp rainforest69, is now largely limited to the rugged center of the landscape and surrounded by a patchwork of various land-use types, including oil palm, rubber tree plantations, and pulpwood plantations covering ± 75% of the total landscape, non-active former logging areas are now partly covered with secondary forest (17%), and surface coal mining areas, small settlements, and private farmland with the smallest proportion. Based on its function, Datuk Gedang is located in a cultivation area covering 457.12 km2 of Production Forest (PF), 157.97 km2 of Limited Production Forest (LPF) and 1.38 km2 of Other Uses Areas (OUA). The PF and LPF areas are industrial plantation forests of rubber and acacia trees which incorporate a social forestry area. The OUA is a residential area and a garden for the local community. Bukit Tigapuluh Landscape also has a concession in the form of an ecosystem restoration timber forest product utilization area. The climate is tropical, with warm temperatures throughout the year (mean annual temperature = 22 °C, min = 21 °C, max = 33 °C) and high rainfall (average rainfall = 2577 mm/year, max = 347 mm/month, min = 83 mm/month), and altitudes ranging between 60 and 843 m asl68.
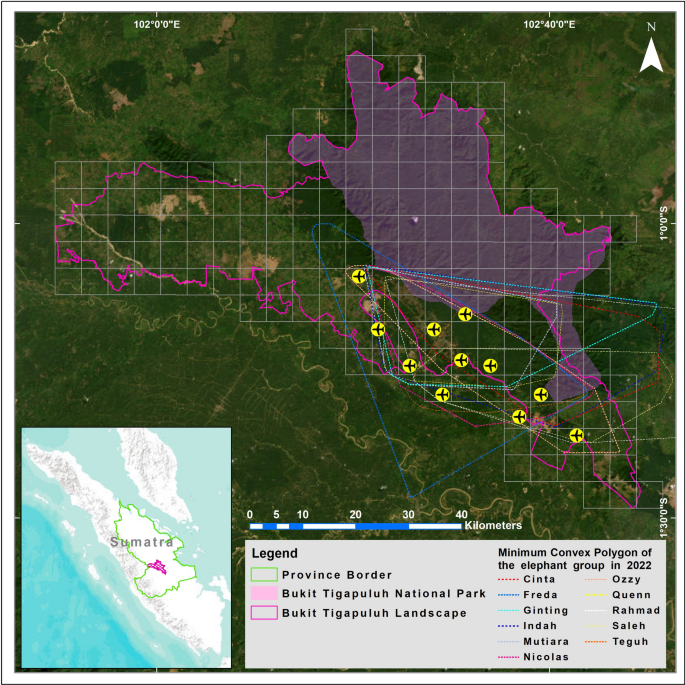
Study design of drone in Bukit Tigapuluh Landscape.
Drone surveys
Drone data was collected in November 2022 using a Dà-Jiāng Innovations (DJI) Matrice 300 RTK outfitted with a DJI Enterprise Zenmuse H20 Series multi-sensor camera. This camera includes a zoom, wide, and thermal camera (H20T), which utilizes an Uncooled Vanadium Oxide (Vox) Microbolom sensor for thermal detection. The drone has a maximum flight time of 30 min, a top speed of over 70 km h−1, a pilot-controlled range of more than 5 km, and a 20 MP camera capable of recording high-definition 4 K/60 fps video. We programmed all flight plans using Mission Planner (DJI Pilot version 1.9.0 by DJI Innovations Technology Co., Ltd., Shenzhen, China). All images were compiled and ortho-rectified using Agisoft Photoscan Pro ver. 1.2.5.2594, now known as Agisoft Metashape (https://www.agisoft.com/accessed as of 18 July 2023), before being imported into QGIS ver. 2.8.6 (QGis Development Team, Beaverton, OR, USA) for analysis.
The entire study area of 3500 km2 in the BTL was divided into 140 grids of 5 km × 5 km each. Previous survey data and information, such as the direct presence of elephants in the landscape and indirect encounters through traces of activity from the ongoing long-term research, local field guards, and forest officials were integrated into the spatial layers and overlayed in ArcGIS 10.6. Our study focuses on the central and southeastern parts of BTL since GPS collar data shows elephants are no longer moving southwest due to the development of agricultural land, illegal settlements, and the construction of uncontrolled electric fences that cut off the movement paths of Sumatran elephants. However, in principle, elephant surveys using drones can indeed be conducted without using GPS collars, but still consider preliminary surveys regarding the locations of elephant movement boundaries. Surveys of presence indicators such as dung, footprints, and information from local communities can determine the limits of elephant movement, which is very useful in optimizing resources and references in limiting survey locations. Like the transect and DNA surveys conducted by Moßbrucker in 2011 in the BTL, pre-surveys are crucial for successfully identifying the research boundaries to be undertaken. In preparation for implementing drone surveys to study Sumatran elephants, we conducted tests to assess any potential disturbances caused by the drones, such as evasive maneuvers or attacks, that could impact the accuracy of the survey results and minimise the disturbance of elephants. Based on our findings, we determined the minimum flying height of 100 m for the drones to avoid disturbing the elephants, which was the same height as their last flight before fleeing. We ensured that our drone’s flying height did not exceed 120 m, which complies with the regulations outlined in the Regulation of the Minister of Transportation of the Republic of Indonesia No. 37/2020 regarding the Operation of Unmanned Aircraft in Airspace Served by the State of Indonesia.
Prior to conducting the drone survey, we verified the location coordinates acquired from the GPS collars. The collar information is used to cluster sample areas based on elephant movements throughout 2022 in BTL, thus narrowing the potential habitat of elephants. Moreover, the collar information is used to strengthen our assumption that elephants no longer move southwest for various reasons. The selection of survey locations is partially random, with a few referring to collar information. Before the drone flight is carried out, if we found any indication of the presence of elephants around the flight location from radio telemetry signals, we would launch the drone towards the sample location approximately 300–500 m from the GPS collar transmission point to avoid disturbing the elephants. Telemetry only functions as a reference for the elephant’s location to avoid interference and not as a reference in choosing a drone flight location. The minimum altitude for each flight was set to 100 m. We conducted optimal flight evaluations and carried out drone surveys at an ideal speed rate of 5 m s−1, with a 90-degree camera orientation. The drone followed a pre-programmed flight plan autonomously, from take-off to landing. We conducted four flights at each site. The drone was programmed to take photos at regular intervals to ensure optimal photo collation and avoid shadows on maps, maintaining an 80% forward overlap and 80% lateral overlap between two consecutive images36,47. After conducting a field survey, we created maps and visually inspected them to detect the presence of the species (Fig. 5). We used photographs to capture each individual’s head or body shape and record their body length. To create high-resolution images of each site, we combined approximately 100 images and corrected the perspective using Pix4Dmapper (v4.7, Pix4D SA). We obtained Ground Control Points (GCPs) from a Google Satellite online map to ensure accurate positioning matching with the satellite data. We then selected 10 GCPs on each orthomosaic to match the coordinates of the satellite image70.
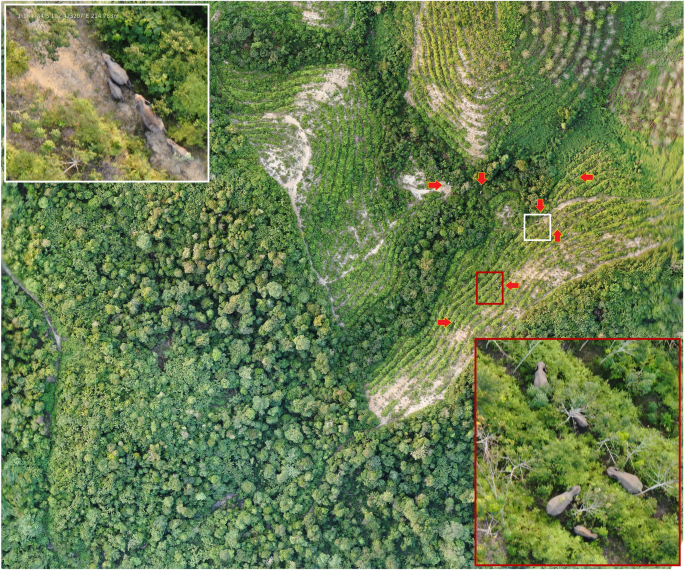
23 individual Sumatran elephants recorded in orthomosaic images and depicting the fusion between the Ginting and Indah groups in a rubber plantation.
Automated detection and body size measurements of Sumatran elephant
To count the number of elephants accurately, we utilized Picterra, an online machine-learning (ML) platform that employs a Convolutional Neural Network (CNN) architecture for object segmentation. CNNs are advanced Deep Learning tools that can recognize and delineate specific object classes from raster images by analyzing patterns in pixel relationships. This method provides a reliable and automated alternative to traditional counting methods71. Our approach is ideal for detecting distinct objects that may not be identical but have similar visual characteristics in images. We trained Deep Learning models to automate object detection with drone imagery. This software utilizes a modified version of the U-NET architecture72, a type of CNN, to enable instance segmentation without requiring a complex and data-intensive model such as Mask-R-CNN73. We created three detectors that specifically targeted calves and older elephants (age 1 + years old), and all elephants regardless of age (age 0 + years) (Fig. 6). This approach enabled us to train each detector separately, ensuring no confusion between the classes. We utilized drone orthomosaics for training the software by outlining polygons around each elephant. Approximately 10 elephants were used for each class during training. We trained each detector with 4000 steps. The accuracy of the binary classification model, the F1 score, was estimated as in74:
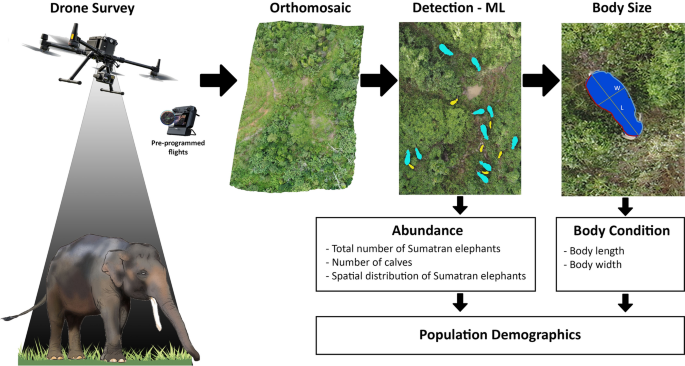
Overview of the automated work-flow for wildlife surveys, from drone flights to image analysis. Drones are used to collect hundreds of images that are converted into orthomosaics. Thereafter, animals are identified by machine learning and their body sizes measured.
$$F1=frac{2*Precision*Recall}{Precision+Recall}$$
In the context of this study, “precision” refers to the ratio of false positives (FP) and false negatives (FN) in the classifications. “Recall” is defined as TP/(TP + FN), where TP represents the true positive rate as determined by a human observer. The accuracy of the classifications was exceedingly high, with calves having a 94.14% accuracy rate, older elephants with 95.06%, and the entire elephant group with 90.75%. After running the detectors on the drone mosaics, each elephant was indicated with a polygon and data on its position (latitude and longitude), body area and perimeter were recorded.
We utilized the polygons classified by the ML for each elephant to determine body size. To automate the measurement of elephant length and width, we developed a custom-written R function (Fig. S3)75. Within this function, spatial polygons were plotted and analysed using the packages “sf” and “lwgeom” with further manipulation of the data using package “reshape2”76,77. To remove limbs from computation, polygons were smoothed by Gaussian Kernel regression with a bandwidth value of two, using the R-package “smoothr”78. To determine the length of an elephant from head to tail, we used the two furthest points on its polygon to represent these body parts. We divided the polygon into two-line segments at these points and constructed a line that followed the curvature of the polygon by using a set of points midway between corresponding coordinate points in each line segment. Accounting for the effect of smoothing, we added the distance between the farthest points in the smoothed polygon and the original polygon to the length of this curved line. This value represented the length of the elephant from head to tail, following the curvature of its body. All relevant code is available.
We also manually estimated the standard body length of elephants using classified polygons and mosaics to validate the automatic calculation. To do this, we measured the straight-line distance from the head to the tip of each elephant’s tail79,80. We utilized 10 panels with known areas ranging from 1.2 to 7.5 m, which were photographed during 3 drone missions to calculate the error of body length measurements. While installing a radio collar on an elephant’s neck, one individual from each group of elephants is physically measured for their body length. As an example, the results of the analysis show the elephant’s body length was manually measured at 2.9 m, while the corresponding automatic measurement from a drone was 2.9 ± 0.58 m. The measurements taken by the drone closely matched the manually measured dimensions of the elephant’s body length (F = 1875, p < 0.001, R2 = 0.94, y = 1.25x + 0.0800; Fig. S4).
Estimation of population size
We consider a model for spatially replicated counts proposed by38, also known as N-mixture models. The objective of this model is to estimate the abundance of the species of interest without the need of individual identification, while the model can be easily extended for understanding the relationship between the abundance and site-specific covariates. Therefore, N-mixture model has been recently extended for modelling the aerial counts51,81,82. However, we note that some potential issues in applying N-mixture modeling to wildlife abundance have been highlighted, such as a lack of identifiable parameters when abundance, probability of detection, or the number of visits to survey sites is low51,82,83.
In this paper, we fit the aerial counts on the N-mixture model for estimating the abundance of the elephant. For clarity, we start by describing the notations for the model. Let ({n}_{jt}) be the number of unique individuals detected at location (j) at time (t) for sampling occasions (t=1,dots ,T) and locations (j=1,dots ,R). We assume that within the sampling occasion (T), the target population is closed i.e., no birth/death and migration/emigration is allowed, and individuals are detected independently over locations and times. The count data is assumed to follow a binomial distribution such that:
$${n}_{jt}sim {text{Binomial}}left({N}_{j}, psi right),$$
where ({N}_{j}) is the population size at location (j) and (psi) is the detection probability. In this paper, we further assume the detection probability to be constant over time and space i.e., (psi) is the same for all (j) and (t) for simplicity. The realized total population ({N}_{total}) is equal to the sum of the estimated population size for all locations (j) such that ({N}_{total}=sum_{j=1}^{R}{N}_{j}).
To estimate the model parameters, a Bayesian approach is used for this case considering the sample size which is quite small. Therefore, we need to assign prior distributions to each parameter in the model to obtain the posterior densities of parameters. We assume a Poisson prior distribution for ({N}_{j}) such that:
$${N}_{j}sim {text{Poisson}}left(lambda right),$$
where (lambda) is the expected population size and (lambda sim {text{Uniform}}left(0, 100right)) with the upper limit is chosen such that, it does not affect the posterior distribution of (lambda) i.e., ({text{Pr}}left(lambda =100right)approx 0). For detection probability, a Beta prior is assumed such that (psi sim {text{Beta}}left(1, 1right)). ({text{Beta}}left(mathrm{1,1}right)) is chosen to constrain the detection probability (psi) such that (psi in left[0, 1right]). Note that28 suggested an alternative prior specification for (lambda) i.e., a gamma prior which is equivalent to the Negative-Binomial prior for ({N}_{j}). However, the Poisson-Uniform prior seems to be sufficient for our case therefore we restrict the analysis for given priors. Finally, site-specific covariates can be incorporated into (lambda) and/or (psi) if such information is available. In this paper, we simply fit the simple model where (lambda) and (psi) are assumed to be invariant. Let ({varvec{N}}=left{{N}_{j};j=1,dots ,Rright}) and ({varvec{n}}=left{{n}_{jt};j=1,dots ,R;t=1,dots ,Tright}), thus the joint posterior distribution over the model parameters is given by:
$$pi left({varvec{N}}, lambda ,psi |{varvec{n}}right)propto fleft({varvec{n}}|p, {varvec{N}}right)pleft(psi right)pleft({varvec{N}}|lambda right)pleft(lambda right),$$
where (fleft({n}_{jt}|p, {N}_{j}right)) is the joint likelihood function of the data and (pleft(.right)) denotes the prior distribution of the corresponding parameters defined earlier. We fit the count data of the elephant on the N-mixture model defined in Eq. ((pi left({varvec{N}}, lambda ,psi |{varvec{n}}right)propto fleft({varvec{n}}|p, {varvec{N}}right)pleft(psi right)pleft({varvec{N}}|lambda right)pleft(lambda right))) using a Bayesian method. The count data was collected from the aerial survey using drones at 8 different locations ((R=8)) (Fig. S5). The survey was conducted for four days resulting in (T=4), hence the closure assumption is well satisfied. Note that we only include locations with at least one individual being detected during the observations. We run Markov chain Monte Carlo (MCMC) algorithm for 50,000 iterations following an initial 5000 burn-in for each algorithm using 3 separate and independent chains. The model was fitted using the R package rjags84. Next, The trace plot and the Brooks–Gelman–Rubin statistic for each parameter are obtained for convergence check of the MCMC samples85.
Age prediction
We consider two models for age prediction of elephants in this paper: (i) Von Bertalanffy growth curve model, and (ii) generalized additive model (GAM). The growth curve derived by86 has been used for studying the growth phenomena on vertebrates including elephants80,87. The model is used to explain the growth curve of body sizes e.g., back length based on the individual ages59,61,86,88. Let ({L}_{i}) be the body size (the total body length) of individual (i) and ({t}_{i}) denote the age of associated individuals for individuals (i=1, dots , n). The von Bertalanffy growth function has a form of:
$${L}_{i}={L}_{infty }-left({L}_{infty }-{L}_{0}right){text{exp}}left(-K{t}_{i}right),$$
where ({L}_{infty }) is the asymptotic total body length, ({L}_{0}) is the body length at birth and (K) is a rate constant. Note that (left{{L}_{infty }, {L}_{0}, Kright}) are growth parameters to be estimated.
The second model we consider for predicting the age of elephants is generalized additive model (GAM). Under the GAM, we assume that age, a dependent variable, is a function of an unknown smooth function. The form of the generalized additive model for age can be written mathematically as:
$$gleft({t}_{i}right)={beta }_{0}+sleft({L}_{i}right)+{epsilon }_{i},$$
for (i=1,dots ,n) where ({beta }_{0}) is a constant, (gleft(.right)) is a link function to be chosen; and ({epsilon }_{i}) is a zero mean error term with variance ({sigma }^{2}). The function (sleft(.right)) denotes an unknown smooth function. In this work, we consider a basis expansion to approximate (sleft(.right)) such that (sleft({L}_{i}right)=sum_{r=1}^{m}{beta }_{r}{b}_{r}left({L}_{i}right),) where ({b}_{r}left({L}_{i}right)) is a B-spline basis function and ({beta }_{r}) are coefficients to be estimated60. The link function (gleft(.right)) is chosen such that it constrains the age into the interval (left[0, infty right]). Therefore, a Gamma distribution is assigned to fit the model to the age given the body length since the function is defined for all positive real numbers, and the log-link function is chosen such that (gequiv) log. Note that a Gaussian distribution with a log-link function may be an alternative distributional form for modelling age with a constant variance. However, we prefer a Gamma distribution where the variance is not necessarily constant i.e., we expect to have smaller uncertainties for smaller body length. We also note that the inverse of the von Bertalanffy growth function can be written as a linear function of the body length59 such that:
$$t=frac{1}{K}{text{log}}left({L}_{infty }-{L}_{0}right)-frac{1}{K}{text{log}}left({L}_{infty }-{L}_{i}right),$$
which is equivalent to the GAM equation with ({beta }_{0}=frac{1}{K}{text{log}}left({L}_{infty }-{L}_{0}right)) and (sleft({L}_{i}right)=-frac{1}{K}{text{log}}left({L}_{infty }-{L}_{i}right)). Fitting the inverse of von Bertalanffy growth equation to the age assuming a Gamma distribution with a log-link function is somehow similar to the initial GAM but a different function in (sleft({L}_{i}right)). Thus, we consider GAM is an appropriate and a reasonable approximation to the original von Bertalanffy growth function when the main objective is the prediction not the relationship itself.
Note that drone photogrammetry has been used to predict the age of hippopotamuses in nature using multiple imputation statistical analyses61. However, the conclusions of such data-driven models are limited without ground-truthing the findings with direct measurements from morphometric data collected in the field. Considering the difficulties in obtaining total body length data and other body measurements of Sumatran elephants in nature, validation data is needed in the form of appropriate morphometric measurements for age and sex, commonly available in ex-situ locations such as zoos. Therefore, we collect an additional dataset from the zoo corresponding to body measurements and their associated ages of 23 individuals with a range of age between 1 and 40 years old. We treated the additional dataset from the zoo as training data to obtain the parameter estimates of the von Bertalanffy growth model and GAM. The growth parameters obtained are used to derive the inverse of the von Bertalanffy model to back-calculate age from the total body length59. We use the R package FSA to obtain the maximum likelihood estimates of the von Bertalanffy growth parameters89 where the 95% confidence interval of corresponding parameters are derived using a nonparametric bootstrap. For GAM, we fit the model by setting age as a dependent variable and the body length as a predictor assuming a Gamma model with a log-link function using R package mgcv90. Parameter estimates from both the Von Bertalanffy growth model and GAM are used for comparing the age prediction for given body lengths while assessing the uncertainties e.g., 95% prediction intervals of the prediction. The primary objective of building such models is to estimate the age of elephants from the aerial survey data i.e., predicting individual ages based on the total body length estimated from the snapshot of aerial survey (Fig. S5). We further classify the age group into four classes according to their maturity, i.e., calf (0–1 year), juvenile (1–5 years), sub-adult (5–15 years) and adult (> 15 years)80.
Ethics declaration
Ethical review and approval were not required for this study. We use a non-invasive approach in collecting wild animal data. No live animals were used for this research, and no humans were part of this study. All work was conducted in accordance with Animal Welfare guidelines and received permits and support from the Ministry of Environment and Forestry, the Regional Government of Jambi Province and Forest and Non-Forest Utilization Concessions.
- SEO Powered Content & PR Distribution. Get Amplified Today.
- PlatoData.Network Vertical Generative Ai. Empower Yourself. Access Here.
- PlatoAiStream. Web3 Intelligence. Knowledge Amplified. Access Here.
- PlatoESG. Carbon, CleanTech, Energy, Environment, Solar, Waste Management. Access Here.
- PlatoHealth. Biotech and Clinical Trials Intelligence. Access Here.
- Source: https://www.nature.com/articles/s41598-023-48635-y