Infectious diseases claim millions of lives globally each year, typically caused by bacteria, viruses, and pathogens that spread from surfaces, food, air or parasites. Notable global outbreaks include COVID, Ebola, Swine Flu, as well as other persistent spreading diseases like HIV and malaria. Infectious diseases affect individuals of all ages, races, and ethnicities, including animals. Vaccines are vital in preventing the spread of these dangerous infections, each of which undergo approval by the United States Food and Drug Administration (FDA). Rigorous clinical trials on human subjects form an integral part of this approval process.
Statistical analysis programmers play a vital role in developing data required for FDA review and approval, statistically analyzing collected clinical trial data to determine the vaccine efficiency (immunogenicity) and safety (reactogenicity/serious adverse events).
Immunogenicity: Unraveling the Body’s Response
The human body naturally develops immunity to foreign substances that enter the system. Immunogenicity gauges the ability of a foreign substance, like an antigen, to provoke an immune response in a human body. This response involves humoral and/or cellular reactions. The antibody test (a blood test) determines if there is an immune reaction triggered by foreign invaders (antigens) and the level (titer) of antibodies in the blood. When a trial vaccine is administrated to subjects, an antibody test is performed and the titer value is noted at every visit/day including their day1 baseline (before the trial vaccine is administered).
Statistical Programmers Critical Role
At every visit/day, statistical programs calculate the geometric mean of titer values for all subjects for every strain separately. They also analyze the data to see if the subject has achieved seropositivity and if so, the visit/day when the seropositivity was achieved. Seropositivity is a 4-fold increase in titer value, i.e., when titer value at a visit is divided by baseline titer value and if its greater than or equal to 4, we determine the subject has seropositivity. Seropositivity levels are shown in graphical form for reviewers to visualize the data. The pattern of increase in the geometric mean titer value at each visit/day are shown as reports in graphical form to the FDA for approval. We also present the collected data in a form of SDTM (Study data tabulation model) in IS domain, analyze data in form of ADaM (Analysis data model) in ADIS domain, and submit the geometric mean tables and listings for every strain.
The following examples show how the immunogenicity data is presented in graphical form.
Figure 1 below shows the mean antibody titer values at day 0 (baseline) and at day 28, day 42 and day 56 from vaccine administration, respectively. The distinct colors shown on the figure represent different strains.
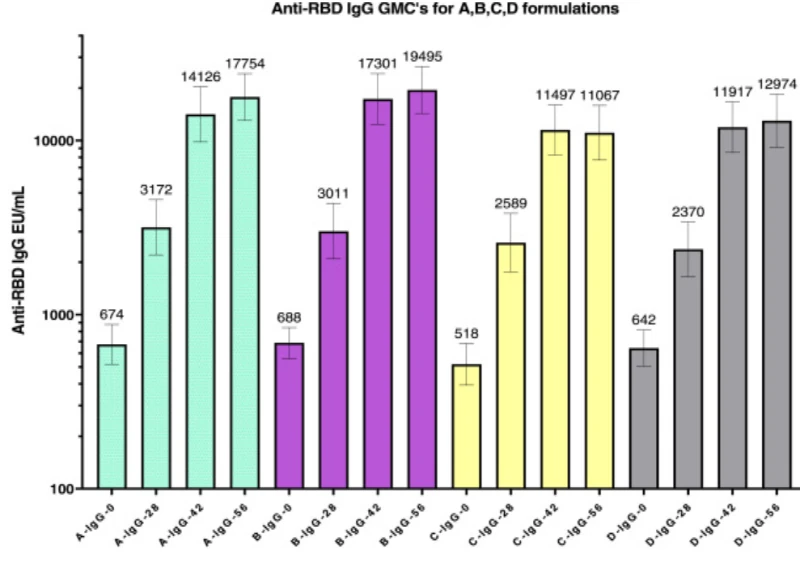
Figure 1. Antibody Titer Values
Source: medrxiv.org/content/10.1101/2022.03.08.22271822v2.full
Figure 2 below explains the Seropositivity at every visit/day after the vaccine administration. Distinct colors are shown for different cohort’s and doses of vaccine.
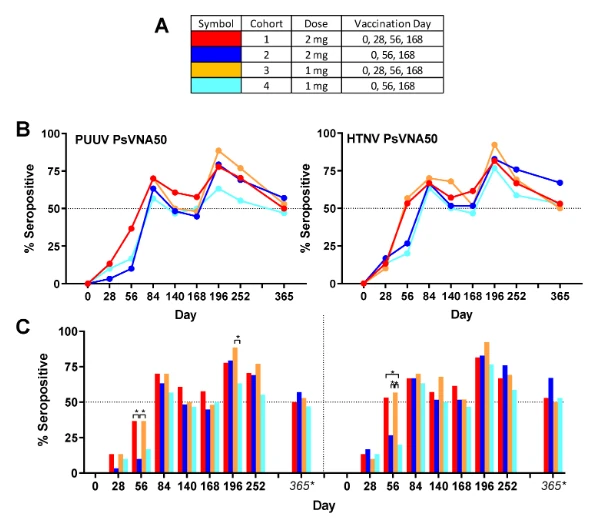
Figure 2. Seropositivity<
Source: https://www.ncbi.nlm.nih.gov/pmc/articles/PMC7565952/
Programmers Submit Reactogenicity Events to FDA
Reactogenicity is subset of reactions that occur soon after the vaccination and describes the immediate short-term reactions of a system to vaccines (not be confused with the long-term consequences sequelae). It represents the physical manifestation of the inflammatory response to vaccination, and can include injection-site pain, redness, swelling or induration at the injection site, as well as systemic symptoms, such as fever, myalgia, fatigue, nausea, or headache. If any of these events occurred with in 7 days of vaccination, then these are called clinical events. If the same event continues after 7 days of vaccination, then it’s considered an Adverse Event. Once the vaccine is administered to subjects, every subject is given a system to enter the response to questions daily. There are questionnaires for every event, e.g., if the event has occurred or not; if it occurred then how severe was the event; if this event leads to hospitalization; or if it needs any concomitant medication, etc. This data is collected for 7 days daily after the vaccine is administered. On the 7th day when subjects return the tab, the investigator checks to see if the entries are all correct, if the event is still ongoing, or if it is resolved. Body temperature is also collected daily to determine if subjects experienced any fever. Reactogenicity events are presented to FDA for approval in graphical (Box Plots) or tabular form based on the severity of events. Along with reports we also submit the complete e-diary information collected in SDTM (CE/FACE/VS) and ADAM (ADFACE/ADCE) standards.
Figure 3 and Figure 4 below are sample figures and tables which represent Reactogenicity.
This first figure of reactogenicity shows the percentage of subjects experiencing a particular event on each day from Day1 to Day7.
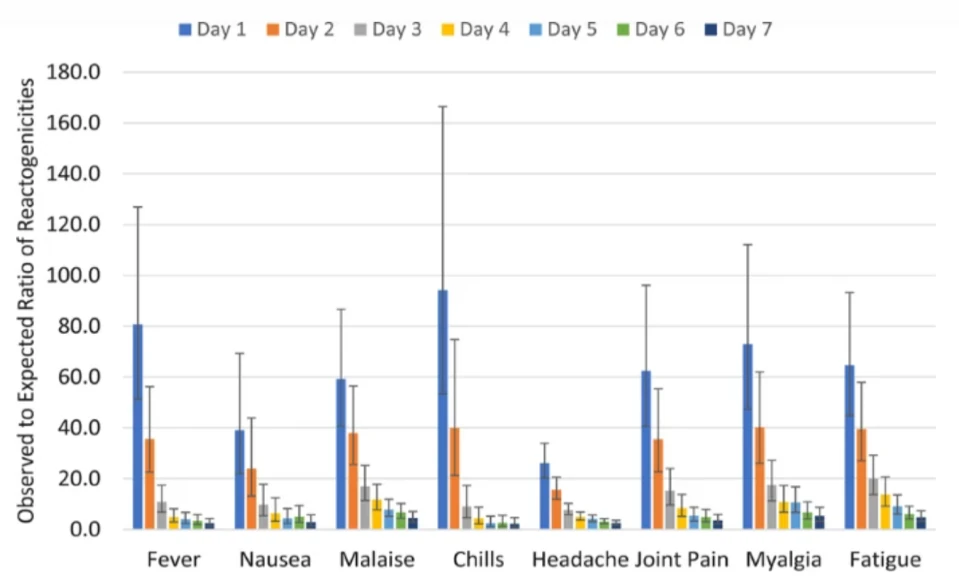
Figure 3. Reactogenicity
Source: https://bmcinfectdis.biomedcentral.com/articles/10.1186/s12879-023-08103-4
The figure below of reactogenicity shows percentage of subjects experiencing event at any given day within 7 days of vaccine administration by Grading. Subject is counted only once here at its maximum severity. This figure also shows percentage based on severity grading.
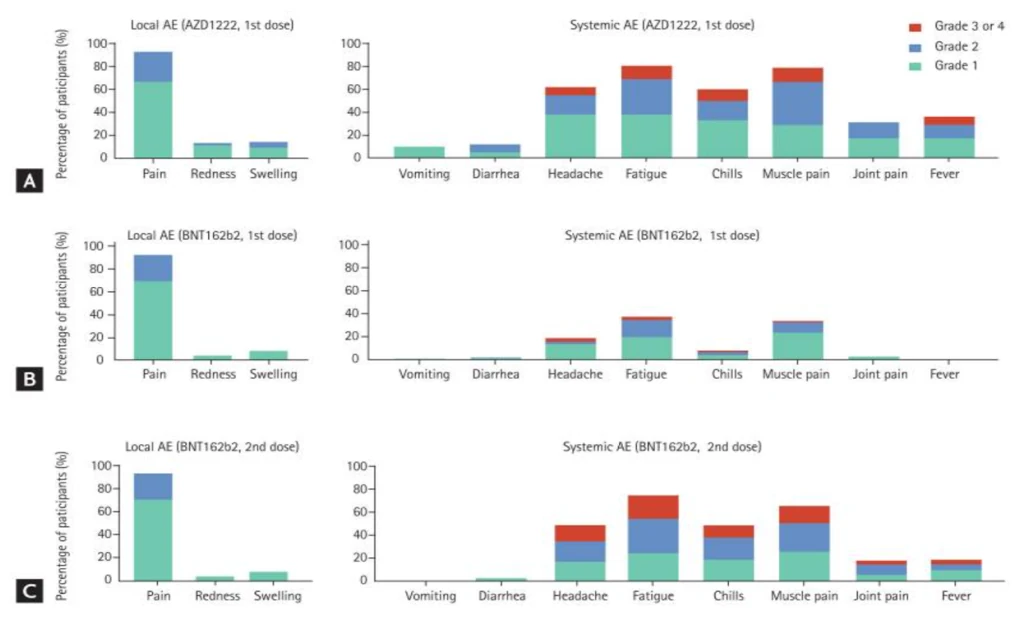
Figure 4. Reactogenicity by maximum Severity
Source: https://www.ncbi.nlm.nih.gov/pmc/articles/PMC8588964/
Programmers Report Serious Adverse Events, Critical Data Needed by FDA
An adverse event is any undesirable experience associated after the vaccine administration. Reactogenicity event that continued or occurred after 7 days of vaccine administration is also considered as Adverse event. The event is serious when outcome of the event is death, life-threatening, hospitalization, disability, congenital anomaly/birth defect, required intervention to prevent permanent impairment or damage (Devices) or any other serious important medically attended events. Adverse Events are graded by Severity (Mild/Moderate/Severe) and Toxicity Grading (Grade1, Grade2, Grade3, Grade4 etc.). CTCAE grading scale is used to determine the severity grading of Adverse events. Along with Serious Adverse events we also report non serious Adverse events which occur in greater than 5% frequency. Summary of these adverse events are submitted to FDA for vaccine approval to show the safety profile of the trial subjects. Adverse event tables and listings along with the subject’s demographic information is submitted to FDA to prove the safety of the trial subjects. Along with the reports, the SDTM (AE) and ADAM (ADAE) datasets are also submitted.
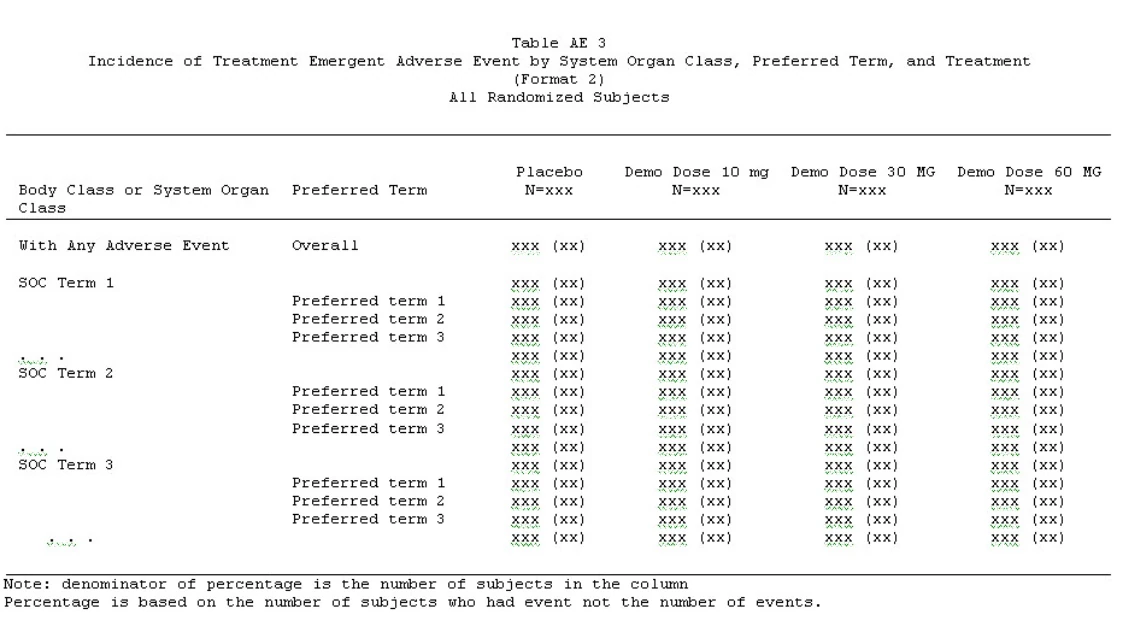
Statistical programmers analyze the Adverse event data and create multiple summary tables based on system organ class, the preferred term to show FDA the count and percentage of subjects experiencing any Adverse events.
1 – Summary of Adverse Events by System Organ Class and Preferred Term
2 – Summary Of Treatment-Emergent Adverse Events (Teaes) By Body System And Severity
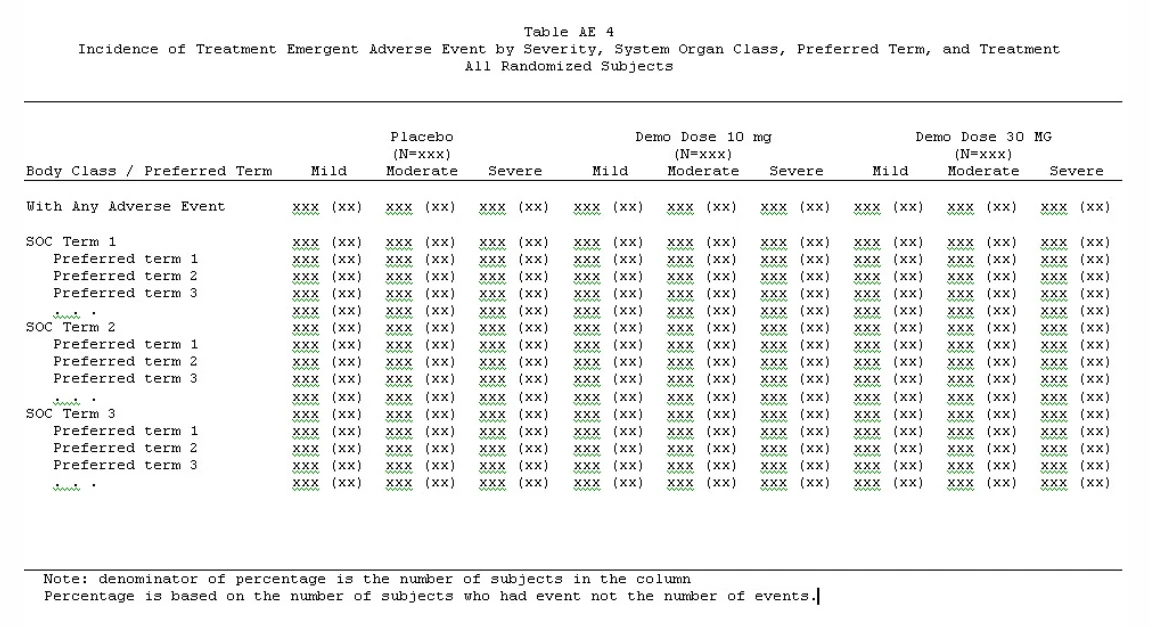
Source above tables: https://clintrialstatservice.wordpress.com/sapmaker-software/adverse-event-tables/
Statistical Programmers also analyze all the data collected for subjects like vitals, labs, ECG etc., create summary reports of all parameters collected, and then submitted to FDA. These submissions prove whether the vaccine has created any abnormalities/interpretations that are clinically significant or not. Similarly, vitals like systolic blood pressure, diastolic blood pressure, pulse rate, respiratory rate, BMI, etc. are summarized at every visit and provided to the FDA to prove the safety of subjects. Statistical programmers also report the patient’s medical history or any other concomitant medications that the subjects have used during and prior to trial.
Vaccines might have different impacts for different age groups and different races, so sometimes reports are generated based on subgroups of age, gender, race, ethnicity, medical history and any other health parameters such as obesity, diabetic status, or prior infections. All these summaries and data are reported in the form of TLGs (tables, listings, graphs) to the FDA. Along with TLGs, raw data collected is submitted in form of SDTM along with a CRF, Define, XPT’s, SDRG documents in CRT Package. Analyzed data is put in ADAM format and this is also submitted to FDA along with SAP (Statistical analysis plan), Define, XPT’s, ADRG. SDTM’s and ADAM’s are standards used to submit data to FDA, called CDISC (Clinical Data Interchange Standards Consortium) standards. Finally, SAS Programmers must understand these standards and keep up with all new versions and changes in the CDISC standards.
In summary, statistical analysis performed by these highly trained programmers in clinical trials is essential, ultimately providing the data needed by the FDA to determine if vaccines can be approved and administered to the public.
- SEO Powered Content & PR Distribution. Get Amplified Today.
- PlatoData.Network Vertical Generative Ai. Empower Yourself. Access Here.
- PlatoAiStream. Web3 Intelligence. Knowledge Amplified. Access Here.
- PlatoESG. Carbon, CleanTech, Energy, Environment, Solar, Waste Management. Access Here.
- PlatoHealth. Biotech and Clinical Trials Intelligence. Access Here.
- Source: https://www.biopharmatrend.com/post/740-statistical-programmers-essential-role-in-vaccine-fda-approval/