Ethics statement
This research complies with all relevant ethical regulations. Studies using human gingival biopsies were approved by the University of Pennsylvania (IRB #6; Protocol #844933; Lead PI: KIK) and the National Institutes of Health/National Institute of Dental, Oral and Craniofacial Research (NCT #01805869; Lead PI: JL [NIDCR]). Studies using murine samples were approved by the University of North Carolina at Chapel Hill (American Association for Laboratory Animal Science: IACUC ID #20-041.0-B) and the Queen Mary University of London (Animal Welfare & Ethical Review Body ID #P48019841).
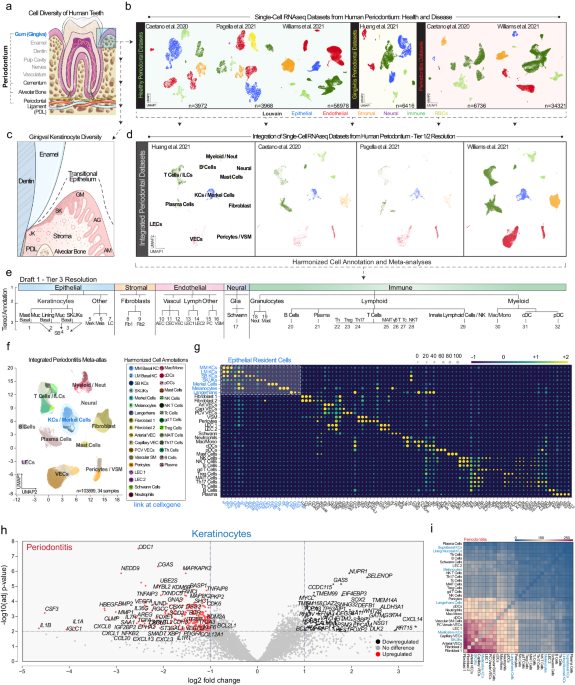
Human integrated periodontitis atlas and mouse keratinocyte atlas generation and analysis
Human single-cell data reprocessing
Raw fastq files for the previously published single-cell RNA sequencing projects were downloaded and processed using scripts available here: https://github.com/cellgeni/reprocess_public_10x. Briefly, series metadata was collected using the GEO soft family file. Following this, ENA web API was used to obtain information about the format in which raw data is available for every run (SRR/ERR), as well as to infer the sample-to-run relationships. Raw read files were then downloaded in one of the three formats: 1) SRA read archive; 2) submitter-provided 10X BAM file; 3) gzipped paired-end fastq files. SRA archives were converted to fastq using fastq-dump utility from NCBI SRA tools v2.11.0 using “-F –split-files” options. BAM files were converted to fastq using 10X bamtofastq utility v1.3.2. Following this, raw reads were mapped and quantified using the STARsolo algorithm. STAR version 2.7.10a_alpha_220818 compiled from source files with the “-msse4.2” flag was used for all samples. Wrapper scripts documented in https://github.com/cellgeni/STARsolo/ were used to auto-detect 10x kit versions, appropriate whitelists, and other relevant sample characteristics. The human reference genome and annotation exactly matching Cell Ranger 2020-A was prepared as described by 10x Genomics: https://support.10xgenomics.com/single-cell-gene-expression/software/release-notes/build#header. For 10x samples, the STARsolo command was optimized to generate the results maximally like Cell Ranger v6. Namely, “–soloUMIdedup 1MM_CR –soloCBmatchWLtype 1MM_multi_Nbase_pseudocounts –soloUMIfiltering MultiGeneUMI_CR –clipAdapterType CellRanger4 –outFilterScoreMin 30” were used to specify UMI collapsing, barcode collapsing, and read clipping algorithms. For paired-end 5’ 10x samples, options “–soloBarcodeMate 1 –clip5pNbases 39 0” were used to clip the adapter and perform paired-end alignment. For cell filtering, the EmptyDrops algorithm employed in Cell Ranger v4 and above was invoked using “–soloCellFilter EmptyDrops_CR” options. Options “–soloFeatures Gene GeneFull Velocyto” were used to generate both exon-only and full-length (pre-mRNA) gene counts, as well as RNA velocity output matrices.
Cellenics® database generation and subclustering
The single-cell RNA-seq dataset was processed, analyzed and visualized using the Cellenics® community instance (https://scp.biomage.net/) hosted by Biomage (https://biomage.net/), accessed between May 2022 and February 2024. The team of Cellenics included Alex Pickering, Iva Babukova, Pol Alvarez Vecino, Martin Fosco, Anugerah Erlaut, Germán Beldorati Stark, Sara Castellano, Stefan Babukov, Vicky Morrison, Adam Kurkiewicz, Dana Vuzman, and Peter Kharchenko. The tool itself is Cellenics®, an open-source single-cell analysis toolkit from Harvard Medical School: https://github.com/hms-dbmi-cellenics. Pre-filtered count matrices were uploaded to Cellenics®. Barcodes were then filtered in a series of four sequentially applied steps. Barcodes with less than 500 UMIs were filtered out. Dead and dying cells were removed by filtering out barcodes with a percentage of mitochondrial reads above 15%. To filter outliers, a robust linear model was fitted to the relationship between the number of genes with at least one count and the number of UMIs of each barcode using the MASS package (v. 7.3-56)71. The expected number of genes was predicted for each barcode using the fitted model with a tolerance level of 1 − α, where α is 1 divided by the number of droplets in each sample. Droplets outside the upper and lower boundaries of the prediction interval were filtered out. Finally, the probability of droplets containing more than one cell was calculated using the scDblFinder R package v. 1.11.372. Barcodes with a doublet score greater than 0.5 were filtered out. After filtering, each sample contained between 300 and 8000 high-quality barcodes and was input into the integration pipeline. In the first integration step, data were log-normalized, and the top 2000 highly variable genes were selected based on the variance stabilizing transformation (VST) method. Principal-component analysis (PCA) was performed, and the top 40 principal components, explaining 95.65% of the total variance, were used for batch correction with the Harmony R package73. Clustering was performed using Seurat’s implementation of the Louvain method. To visualize results, a Uniform Manifold Approximation and Projection (UMAP) embedding was calculated, using Seurat’s wrapper around the UMAP package74. To identify cluster-specific marker genes, cells of each cluster were compared to all other cells using the presto package implementation of the Wilcoxon rank-sum test73. Keratinocytes were subset from the full experiment by extracting manually annotated barcodes and filtering the Seurat object. The subset samples were subsequently input into the Biomage-hosted instance of Cellenics®. Filtering steps were disabled since the data was already filtered. The data was subjected to the same integration pipeline as the full experiment. All cells were manually annotated using available literature and CellTypist75.
Transfer of Cellenics® data to CELLxGENE
Annotated cell-level data were downloaded from Cellenics in the form of an .rds file containing a Seurat object. The data was converted by exporting count matrices and metadata from R and loading them using Scanpy version 1.9.3 (https://scanpy.readthedocs.io/). Additional metadata (e.g., age, sex, self-reported ethnicity) from the original datasets were matched to the closest entries in the respective ontology, per CELLxGENE contribution guidelines (https://cellxgene.cziscience.com/docs/032__Contribute%20and%20Publish%20Data). The final CELLxGENE dataset can be found at https://cellxgene.cziscience.com/collections/71f4bccf-53d4-4c12-9e80-e73bfb89e398.
DEG analysis using Cellenics® and g:Profiler76
Cells (all, keratinocytes, fibroblasts, vascular clusters; Supplementary Fig. 1) were grouped using lasso tools to allow for the pseudobulk RNA sequencing analyses using these Tier 1 annotations. Differentially expressed gene (DEG) lists and volcano plots (volcano plot statistical significance measured as a p value [i.e., ANOVA] log2 fold change) were generated in Cellenics® and exported as .csv files and uploaded to the g:Profiler website (https://biit.cs.ut.ee/gprofiler/gost). g:Profiler is part of the ELIXIR Recommended Interoperability Resources that support FAIR principles. A complete list of those resources can be found: https://elixir-europe.org/platforms/interoperability/rirs. g:Profiler assesses Gene Ontology and pathways from KEGG Reactome and WikiPathways. DEGs were uploaded to the query section and were first analyzed using g:GOSt multi-query Manhattan plots. These data were further analyzed for the results tab (GO:MF, GO:CC, GO:BP, KEGG, REAC, TF, MIRNA, HPA, CORUM, HP, WP). Data from Supplementary Fig. 2 are an incomplete display of all the g:Profiler data. DEGs are included in Supplementary Data 1 for further analysis.
CellPhoneDB77 and CellChat78
The total number of ligand–receptor interactions between Tier 3 cell types was calculated for healthy and periodontal disease using CellPhoneDB (version 3.1.0). The Tier 3 annotated AnnData object was subsetted and separate AnnData objects were saved for healthy and periodontal disease, respectively. Metadata tables containing the cell barcodes as indices were also exported. CellPhoneDB was then run as follows: cellphonedb method statistical_analysis metadata.tsv AnnData.h5ad –iterations = 10 –counts-data hgnc_symbol –threads = 2. The CellPhoneDB results were filtered by removing those interactions with a P value > 0.05. Results were visualized using a modified form of CellPhoneDB’s plot_cpdb_heatmap function to allow for re-ordering of cell types. Cell-cell interactions between receptors in Tier 4 keratinocyte subtypes and ligands in innate and adaptive immune subtypes were further explored using the R package CellChat (version 1.6.1 using the cell-cell interaction database). The Tier 4 annotated AnnData object was subsetted and separate expression matrices exported for healthy and periodontal disease, together with their respective metadata tables. These were used to create Seurat objects for health and periodontal disease, which served as inputs to CellChat. Analyses were performed using the log-transformed normalized gene counts with default parameters and using the human CellChatDB. Cell type composition differences were accounted for when calculating communication probabilities. Data from health and disease were compared to identify significant changes.
Partition-based graph abstraction (PAGA) plots79
The keratinocyte subset count matrices were imported into Scanpy version 1.9.3 to conduct quality control, normalization, and log transformation of the data to control for variability in sequencing depth across cells. To minimize the potential batch effects across the four datasets, a batch correction technique was applied using the Python package HarmonyPy version 0.0.973, with the ‘sample ID’ serving as the batch key. PAGA graphs were constructed using Scanpy’s implementation. These graphs were used to explore the relationships between different clusters of cells and to understand the potential developmental trajectories. The coordinates for UMAP80 were then calculated with the PAGA graph as the initial position, allowing for a visualization that is coherent with the topology of the PAGA graph. To better understand the developmental progression of cells along these trajectories, pseudotimes were estimated by diffusion pseudotime (DPT) analysis81 over the PAGA graphs. The DPT is a measure of the transcriptional progression of cells along a trajectory, starting from root cells that were manually selected. Heatmaps were created to visualize gene expression changes along the trajectories, with manually selected start and endpoints, using both Scanpy and Seaborn82. To smooth the plots and reduce noise, a moving average of the expression values was used, with a window size of 50 data points along pseudotime. The clustering of the genes in the heatmaps was performed using Ward’s method.
Mouse single-cell RNA library preparation, sequencing, processing, and analysis of data
All the necessary animal procedures were followed according to the UK law, Animals Scientific Procedures Act 1986. The experiments were covered by the necessary project licenses under the Home Office and Queen Mary University of London’s institution’s Animal Welfare & Ethical Review Body (AWERB). The mouse tissues were obtained at Queen Mary University of London, Barts & The London School of Medicine and Dentistry. Mice from both genders were maintained on the C57BL/6N genetic background and were housed under a 12-h light/12-h dark cycle, at temperatures of 20–24 °C with 45–65% humidity. Single-cell suspensions of gingival tissue were obtained from P28 mice, sacrificed by cervical dislocation. Three biological replicates were pooled together to give one single sample for sequencing. Both males and females were used. Fresh gingival tissues were processed immediately after dissection, cut into smaller pieces in a sterile petri dish with RPMI medium (#11875093, Sigma) and digested for 30 min at 37 °C under agitation using the Miltenyi Mouse-Tumor Dissociation kit (#130-096-730). The resulting cell suspension was consecutively filtered through 100 µm and 70 µm cell strainers and cells were collected by centrifugation. The viability of the cell suspension was determined using a Luna-FL automated cell counter (Logos Biosystems). Single-cell cDNA library was prepared using the 10x Genomics Chromium Single-cell 3’ kit (v3.1 Chemistry Dual Index). The prepared libraries were sequenced on Illumina® NovaSeq™6000 (2 × 150 bp) with a targeted sequencing depth of ~30,000 reads/cell. The cell ranger-6.0.1 pipeline was used for processing the scRNAseq data files before analysis according to the instructions provided by 10x Genomics. Briefly, base call files obtained from each of the HiSeq2500 flow cells used were demultiplexed by calling the “cellranger mkfastq”. The resulting FASTQ files were aligned to the mouse reference genome (GRCm38/mm10), filtered, and had barcodes and unique molecular identifiers counted and count files generated for each sample. The raw count matrix output from CellRanger was then processed by the ambient RNA removal tool CellBender83, giving an output-filtered count matrix file. This was used for subsequent preprocessing and data analysis using Python package 3.8.13 with the Scanpy pipeline84. For basic filtering of our data, we filtered out cells expressing less than 200 genes and less than 100 counts. We filtered out genes expressed in less than three cells and with less than 10 counts. Cells were filtered out by applying the following thresholds: 1) more than 20% mitochondrial reads; 2) ribosomal reads lower or higher than the 5th and 95th percentile; 3) more than 1% of hemoglobin reads and 4) total reads lower than 700 and higher than 50,000. Scrublet, a doublet removal tool was applied to further remove predicted doublets85. To ensure that the data was comparable among cells, we normalized the number of counts per cell to 10,000 reads per cell. Data were then log-transformed for downstream analysis and visualization. The cell cycle stage was predicted using the sc.tl.score_genes_cell_cycle tool86. We regressed out cell-to-cell variations driven by mitochondrial, ribosomal, and cell-cycle gene expression and the total number of detected molecules. We then scaled the data to unit variance. The neighborhood graph of cells was computed using PCA presentation (n PCs = 40, n neighbors = 10). The graph was embedded in two dimensions using UMAP as suggested by Scanpy developers. Clusters of cell types were defined by the Leiden method for community detection on the generated UMAP graph at a resolution of 0.1. Epithelial clusters were used for the second-level clustering. The respective cell types were identified upon annotation of clusters from first-level clustering. The cluster-specific barcodes were retrieved as a list, which was used to select the cells of interest from the filtered count matrix on a separate Jupyter notebook and were re-analyzed separately. Epithelial cells were filtered and analyzed as previously described, and clustered at resolution 0.5 using Louvain.
Adapted Single-cell Analysis of Host-Microbiome Interactions (SAHMI)87
The standard Kraken2 database (version 2.1.3) was downloaded. To avoid overlooking potential oral microbes, genomes from the Human Oral Microbiome Database (HOMD) (https://homd.org) not present in the standard database (n = 1,502 taxIDs) were also downloaded, and this custom database was built using kraken2-build88 with default parameters. Reads from were taxonomically classified using Kraken 2, with “–use-names” and “–report-minimizer-data” (Kraken2Uniq) but otherwise default parameters. True positives from Kraken2 results were identified using barcode level denoising from the SAHMI pipeline and rRNA enrichment. First, barcode denoising was performed. True taxa were identified by performing Spearman correlations between the number of unique and total k-mers across barcodes in each sample. Taxa found to significantly correlate (p value < 0.05) in at least one sample were retained. For all retained taxa, genomic contigs belonging to the taxa were extracted from the Kraken2 database and the reads that were classified to that specific taxa were then mapped to those genomic contigs using bowtie2 (version 2.2.5)89 with default parameters. Additionally, rRNAs were annotated along the extracted genomic contigs using barrnap (version 0.8) with default parameters. BEDTools (version 2.30.0)90 coverage was used to count the number of aligned reads overlapping annotated rRNAs. We then calculated the fold enrichment of reads across rRNAs relative to the entire genome, normalized by rRNA and genome length, respectively. Taxa found to contain at least a fivefold enrichment in rRNA sequences relative to the whole genome, which is expected for bacterial transcriptomics that is not rRNA depleted, were retained. From the human host reads, we previously identified which barcodes corresponded to which cell types. Because the reads that are classified to microbial taxa also contain these same barcodes, we then assigned cell types to the microbial reads. To calculate the relative abundance of taxa in each cell type, we divided the total number of reads classified to those taxa with a barcode assigned to that cell type by the total number of reads in the sample assigned to that cell type.
Spatial validation and analysis of keratinocytes
Mouse husbandry
All mice (Supplementary Fig. 4c) were bred and maintained in an AAALAC-certified animal facility under an IACUC-approved protocol (wild-type to Wallet/ID#20-041.0-B) at the University of North Carolina at Chapel Hill. Each animal was determined to have a healthy body score of at least 3 and had not previously been included in any other panel. Mice were euthanized in accordance with the Panel on Euthanasia of the American Veterinary Medical Association. In wild-type experiments, animals were only used for validation experiments.
Tissue preparation, mounting, and sectioning
Deidentified human gingival tissues were acquired from discarded routine third molar extractions (healthy tissues, Fig. 2 showing gingiva attached to tooth: NIH/ National Institute of Dental and Craniofacial Research (NIDCR) to LOCI: NCT01805869) or from gingival biopsies (all else: UPenn to LOCI; IRB #844933; MTA #68494). Immediately after extraction, tissues attached to teeth were placed in a 10% solution of N-buffered formalin (NBF) and fixed for a minimum of 24 h in a 4 °C refrigerator. After fixation, the tissues were washed twice in 1X PBS before being placed in 70% EtOH in a 4 °C refrigerator until they were ready to be mounted. Tissues were embedded in paraffin blocks using a Leica system and stored in a 4 °C refrigerator until sectioning using RNAse precautions on a Leica system. Formalin-fixed, paraffin-embedded (FFPE) human gingival tissue on SuperFrost Plus slides was heated to 60 °C on a slide warmer for 30 min. Following deparaffinization for 10 min using HistoChoice Clearing Agent, the tissues were rehydrated using a series of ethanol solutions (100%, 90%, 70%, 50%, and 30% EtOH in nuclease-free water) for 10 min (for 100%) and 5 min each, followed by 2 × 5 min in 100% nuclease-free water. During rehydration, 50 mL of a 1X solution of AR9 buffer (commercially available pH 9 buffer, Akoya Biosciences) in nuclease-free water was prepared and added to a Coplin jar. Following rehydration, the slides were added to the 1X AR9 buffer and covered with aluminum foil. Samples were antigen retrieved in a pressure cooker for 15 min at low pressure. Following antigen retrieval, the Coplin jar was removed from the pressure cooker and cooled for at least 30 min. The slide was then soaked in nuclease-free water for 30 s, followed by soaking in 100% EtOH for 3 min, both in Coplin jars.
Immunofluorescence on Human or Murine Tissues
Blocking solution was prepared using gelatin from cold water fish skin (10%; Sigma-Aldrich #G7765-1L), normal donkey serum (10%; Jackson ImmunoResearch #017-000-121), bovine serum albumin (10%; Sigma-Aldrich #A7030-50G), and Triton X-100 (0.2-0.4%; Sigma-Aldrich #T9284-500ML). The sample underwent antigen retrieval as described. A pap-pen was used to draw a hydrophobic barrier around the sample and allowed to dry for 5 min. The slide was then placed in a humidity chamber, and the sample was washed with 1X PBS for 2 × 5 min using a Pipetman (Gibco), then blocked using the blocking solution for 1 h. During blocking, an antibody cocktail containing Rb anti-Hu/Ms KRT19 (clone EP1590Y, 1:500 dilution; Abcam #Ab52625), Ck anti-Hu KRT14 (clone Poly9060, 1:500 dilution; Biolegend #906004), and Rt anti-Hu Ki67 (Clone SolA15, 1:500 dilution; Invitrogen #14-5698-82) in blocking solution dilution was prepared. Following the removal of the blocking solution, this antibody cocktail was added to samples, which were stored overnight in a 4 °C refrigerator. The next day, a donkey anti-species secondary antibody cocktail from was prepared (AlexaFluor 488 [AF488], anti-Rb, 1:1000 dilution, Jackson #711-545-152; Rhodamine Red-X [RRX], anti-Rt, 1:500 dilution, Jackson #712-295-153; and Cyanine 5 [Cy5], anti-Ck, 1:400 dilution, Jackson #703-175-155). The primary antibody cocktail solution was removed, and the samples were washed with 1× PBS for 2 × 5 min. The secondary antibody cocktail was added to samples and left to hybridize for 2 h at rt. This cocktail was then removed, and the samples were washed with 1× PBS for 2 × 5 min. Then, a solution of DAPI (1:1000 dilution in 1× PBS) was added to the sample for 5 min. This solution was removed, and the sample was washed with 1× PBS for 2 × 5 min before mounting with ProLong Gold Antifade. Imaging was performed using a Leica DMi8 with THUNDER Imager (Leica Microsystems) using a 20× 0.8 NA air or 40× 1.35 NA oil objective.
PhenoCycler-Fusion (PCF) on human tissues
All reagents in this section were purchased and used as received from Akoya Biosciences unless otherwise noted. Samples underwent deparaffinization, rehydration, and antigen retrieval as described above. Following sample immersion in EtOH, the sample was immersed in Akoya Hydration Buffer for 2 min, followed by Akoya Staining Buffer for 20 min. While the sample cooled to rt, the antibody cocktail was prepared. To 362 µL of Akoya Staining Buffer was added 9.5 µL of N, J, G, and S blockers. Then, 157 µL of blocking solution was pipetted into a 1.5 mL vial, and 1 µL of barcoded antibody (Table 1) was added to the vial such that the final volume of antibody cocktail was 190 µL. After immersion in Staining Buffer, the slide was removed, the back and area around the sample were wiped dry, and the slide was added to a humidity chamber. As a modification to the manufacturer’s instructions, the antibody cocktail was added to the sample, and the humidity chamber was placed in a 4 °C refrigerator overnight. After removal of the antibody cocktail, the slide was placed in staining buffer for 2 min, followed by post-stain fixing solution (10% PFA in staining buffer) for 10 min. Following 3 × 2 min washing in 1X PBS, the slide was immersed in ice-cold MeOH for 5 min. While the slide was immersed, the final fixative solution was prepared by adding 1 vial of fixative (approximately 20 µL) to 1 mL of staining buffer. The slide was removed from MeOH and placed in the humidity chamber, and 200 µL of the final fixative solution was added to the sample. This was left in place for 20 min. Then, the final fixative solution was removed, and the slide was washed in 3 × 2 min in 1× PBS. To convert the slide into a flow cell for use in the PCF experiment, the back of an Akoya flow cell top was removed, and the top was placed adhesive face-up in the Akoya-provided impressing device. The slide was removed from the 1× PBS, and the edges around the slide that matched where the top of flow cell adhesive would adhere were dried using a micro-squeegee tool (Essential Bangdi). Then, the slide which formed the bottom of the flow cell was placed sample-side down on the top of the flow cell without applying pressure to the adhesive. The tray of the impressing device was inserted into the device, and the lever was gently pulled to adhere to the top and bottom of the flow cell. After 30 s, the lever was depressed, the tray was pulled out, and the flow cell was removed. This flow cell was placed in 1× PCF buffer without buffer additive for a minimum of 10 min before any PCF experiment to allow for improved adhesion between the top and bottom of the flow cell. To prepare the PCF reporter wells, a 15 mL Falcon tube was first wrapped with aluminum foil. To this Falcon tube was added 6.1 mL of nuclease-free water, 675 µL 10× PCF buffer, 450 µL PCF assay reagent, and 4.5 µL of in-house prepared concentrated DAPI such that the final DAPI concentration was 1:1000. Then, this reporter stock solution was pipetted to 18 amber vials, with the volume in each vial being 235 µL. To each vial was added 5 µL of reporter per cycle. The total volume per vial was either 245 µL for a cycle with two reporters or 250 µL for a cycle with three reporters; to optimize reagents and reporters, no cycles contained only one reporter. Only one criterion was used to create a cycle: each cycle could contain a maximum of 3 reporters, corresponding to 1 of Atto550, AlexaFluor 647, and AlexaFluor 750 (where appropriate; see below for more information). A separate pipet tip was used to pipet the contents of each amber vial to a 96-well plate. DAPI-containing vials were pipetted into a well in the H-row, whereas vials containing reporters were pipetted into wells in other rows. Once all wells were filled, Akoya-provided foil was used to seal the wells. Imaging was performed using a PhenoImager Fusion connected to a PhenoCycler i.e., the PhenoCycler Fusion system (Akoya Biosciences) using a 20 × 0.8 NA air objective (Olympus). Requisite solutions for this instrument include ACS-grade DMSO (Fisher Chemical), nuclease-free water, and 1× PCF buffer with buffer additive, the latter of which was prepared by adding 100 mL of 10X PCF buffer and 100 mL of buffer additive to 800 mL of nuclease-free water.
RNAscope HiPlex 12 V1 or V2 on human or murine tissues
All reagents in this section were purchased and used as received from ACD unless otherwise noted. The sample underwent deparaffinization and rehydration as described. 1 drop of RNAscope hydrogen peroxide was added to the slides, and the samples were left for 10 min at rt. The hydrogen peroxide was tapped off the slides, and the samples were antigen retrieved and dried as described. During this time, the HybEZ oven was turned on and set to RNAscope (40 °C). The hydration paper was wetted with nuclease-free water to prepare the humidity chamber in the slide tray. An Immedge pen was used to draw a tight hydrophobic barrier around the tissues, then dried at rt for 5 min. The slides were then placed in the slide holder. One drop of Protease IV reagent was added to each contained region. The slide holder was placed in the tray, and the tray was placed in the HybEZ oven for 30 min. During this time, 1X RNAscope wash buffer was prepared in nuclease-free water. The RNAscope hybridization solutions were prepared by adding 1 µL of T probe (Table 2) to 100 µL of probe diluent. The tray was removed, and the slide carrier was immersed in the wash buffer for 2 × 2 min. The carrier was removed and dried, and a paper towel was used to dry the area around the barrier. Then, 20 µL of hybridization solution or 1 drop of positive or negative control probe mix was added to each spot. The slide holder was replaced in the tray, and the tray was placed in the HybEZ oven for 2 h. After 2 h, the slide holder was washed in wash buffer for 2 × 2 min. Signal amplifiers were added to the samples by hybridization of AMP1, AMP2, and AMP3 for 30 min each, with washing in-between steps. After signal amplifiers, T1–T4 fluorophores were added to each spot, with 15 min hybridization and washing. Then, RNAscope DAPI was added to each sample for 30 s. Following this, the DAPI was tapped off the slides, which were immediately mounted with Prolong Gold Antifade. Imaging was performed using a Leica DMi8 with THUNDER Imager (Leica Microsystems) using a 40 × 1.35 NA oil or 63 × 1.35 NA oil objective.
After imaging acquisition had been completed for T1–T4 probes, the sample necessitated the removal of the first probes for imaging T5–T8 and T9–T12 probes. After completed imaging of T1–T4, slides containing samples were placed in 4X saturated sodium citrate (SSC) at minimum overnight until the cover glass could be gently removed. During this time, an ampule of RNAscope cleaving solution was opened, and a 10% solution of cleaving solution in 4× SSC was prepared. After slide immersion 4× SSC and removal of the cover glass, the slides were added to the slide holder, and one drop of cleaving solution was added to each region containing the sample. The slide holder was loaded into the tray, and the tray was loaded into the HybEZ oven for 15 min. Then, the slide holder was washed in 0.5% Tween for 2 × 2 min. This process was repeated. Following this, T5–T8 probes were added to the sample in the same manner, and the sample was imaged. Once the imaging of T5–T8 probes was completed, their reporters were cleaved as described, and the T9–T12 probes were hybridized and imaged.
For HiPlex V2, no hydrogen peroxide was used, and Protease III was used instead of Protease IV. Additionally, for HiPlex V2, between the AMP3 step and the addition of T1–T4, the addition of FFPE reagent was required as follows. To 100 µL of 4× SSC was added 2.5 µL of FFPE reagent, resulting in a 1:40 solution of FFPE reagent. Following washing slides using 1× wash buffer, the FFPE reagent was added to each slide and incubated at RT for 30 min. Following this, the slide holder was removed from the tray and immersed in 1× wash buffer before proceeding to fluorophore addition.
Human primary cell culture and analysis
Human gingival keratinocyte (HGK) culture passaging, cryopreservation, and fixation
All reagents in this section were purchased and used as received from Lifeline Cell Technology or ATCC. DermaLife K Keratinocyte Medium (HGK medium), the keratinocyte growth kit, and a six-well plate (ThermoFisher Scientific) were brought into a biosafety cabinet using aseptic techniques. The keratinocyte growth kit reagents were added to the dermal basal cell medium. To three of the wells was added 1.5 mL of warmed media. The HGKs (Passage (P)2: Lifeline Cell Technology product #FC-0094, lot #05390; ATCC product #PCS-200-014, lot #80523333) were thawed and aliquoted into 100 µL portions in cryovials (ThermoFisher). One of the 100 µL vials was diluted to 1.5 mL by adding media; then, 500 µL of this diluted media was added to each well, and the six-well plate was placed in a tissue cabinet at 5% CO2 and 37 °C. After 24 h, the media was removed and replaced every 48 h until the cells reached 70% confluence, at which point they were passaged using 0.05% trypsin-EDTA, neutralized, and pelleted using a Sorvall Legend X1R centrifuge (Thermo Scientific) at 1232 RCF for 5 min, resulting in P3 HGKs. Some cells were re-plated in HGK medium and grown using the same procedure until P4 and P5 HGKs were obtained.
Cells that were not plated or re-plated were cryopreserved. P2 HGKs were cryopreserved using the solution in which they were delivered. For in-house passaged HGKs, the excess trypsin/neutralizing solution was removed, and the HGKs were resuspended in 1 mL of Frostalife (Lifeline). The cell suspensions were aliquoted into 1 mL cryovials, which were then placed into a Nalgene Freezing Container that was pre-loaded with 250 mL of ACS Reagent Grade 2-propanol (Sigma-Aldrich). The cells were cooled to -80 °C in an ultra-low-temperature freezer for at least 2 h before immersion in liquid nitrogen. Instead of cryopreservation, some cells were fixed for downstream analysis.
The cells were passaged and either cryopreserved or fixed. Following centrifugation and removal of the excess solution, the cells were suspended in 4% paraformaldehyde (PFA) for a minimum of 24 h. Following fixation, the PFA solution was removed, and the cells were resuspended in 70% ethanol (EtOH) in water. These were stored in a 4 °C refrigerator until future use. SuperFrost Plus (Fisher Scientific) slides were immersed in a solution of 0.1% poly-L-lysine (Sigma-Aldrich) in a Coplin jar for a minimum of 24 h. The slides were rinsed and dried at 37 °C for a minimum of 10 min before use. Cell suspensions were added to 1.5 mL Eppendorf tubes and diluted to 500 µL using 70% EtOH. Cytospin funnels (Fisher Scientific) were rinsed by adding an uncoated slide to the Cytospin clip and adding 70% EtOH to the funnel. The rotor was spun at 1600 RPM for 15 min, resulting in the evaporation of EtOH. Then, a poly-L-lysine slide was added to the Cytospin clip. The funnel was charged with the appropriate cell suspension in 70% EtOH and spun at 1600 RPM for 15 min to obtain cells in a circular spot on the slide. Multiple funnels were used, with rearrangement of the slide and funnels, to obtain four spots per microscope slide. Cells were processed for immunofluorescence and RNA ISH (HiPlex 12) as outlined in the above sections.
Mycotesting was performed using a MycoAlert Plus sample kit (Lonza). Luminescence testing was performed on a Spark (TECAN). Control testing was performed on Lonza MycoAlert Positive Control and deionized water from a Milli-Q IQ7003 (Millipore Sigma). Samples tested included sterile media, media collected prior to passaging cells to P5, and media collected from LPS-challenged and unchallenged cells prior to passaging cells to P4. All test reagents were brought up to rt. The MycoAlert PLUS reagent and MycoAlert PLUS Substrate were each dissolved in 1.2 mL MycoAlert PLUS Assay Buffer. Samples were centrifuged at 200 × g for 5 min. 100 µL of each sample was added to a Hard-Shell PCR 96-Well Plate (Bio-Rad), followed by 100 µL of MycoAlert PLUS Reagent. After 5 min, the first luminescence measurement (Reading A) was taken. Following this, 100 µL of MycoAlert PLUS Substrate was added to each sample. After 10 min, the second luminescence measurement (Reading B) was taken. The ratio of B to A was then calculated (Supplementary Data 1). All cells were found to be mycoplasma negative.
Statistical methods
General methods
All non-sequencing-based data were analyzed in Fiji, QuPath, and/or Prism 9. The selection of statistical tests is described in the text and figure legends; all statistical tests were two-sided. The graphs supporting each figure and the Supplementary Fig. were generated using Prism 9/10 and a community instance of Cellenics® (hosted by Biomage) unless otherwise specified. Venn Diagrams were generated using http://www.interactivenn.net/.
Spatial proteomic cell assignment and analysis
The determination of marker positivity in each cell was based on comparing its fluorescence intensity to predefined thresholds. We carefully selected thresholds for each marker to ensure accurate cell type classification. A marker was positive if its fluorescence intensity exceeded its threshold and negative if it did not. By applying this criterion, each cell was associated with positive/negative signals for each marker. The assignment of cell types for individual cells was made using consistent, predefined cell type signatures consisting of multiple markers. Cells considered fibroblast/stroma (PanCK−, CD45−, and CD31−), vascular cells (CD31+), and epithelia (PanCK+) were removed from further analysis. Only cells that were identified as immune cells (CD45+, PanCK−, and CD31−) were kept in the downstream analysis. In most cells, a unique cell type was confidently assigned based on the presence of the positive markers consistent with its signature. However, in some instances, a cell exhibited positive markers from more than one cell type. To resolve this ambiguous cell-type assignment, we implemented a deconvolution approach (adapted from Celesta91). The intent was to assign the most likely cell type to each cell in the presence of cell-type mixtures. As such, for each mixed cell type group, we extracted a feature intensity submatrix consisting of those cells and the features relevant to the cell type mixtures they represented. We then utilized a Louvain clustering method92 implemented in the Seurat toolkit version 393 to re-cluster those cells. The clusters were then subjected to cell type assignment based on their enriched markers. Dot plots were used to visualize the marker intensity exhibited across those clusters. The identity of each cluster was then determined by inspecting highly expressed markers, which we determined by the size and intensity of dots in the output matrix and compared with our DEG lists. To infer cellular interactions from the spatial data annotated with cell types, we employed the Squidpy library in Python94. Each cell on the slide was represented as a node in the cellular interaction graph. Edges connecting the nodes were created using Delaunay triangulation and were assumed to represent two interacting cells. To remove excessively long edges i.e., unlikely cell-to-cell interactions, a 99th percentile distance threshold was applied to the edges. From the cellular interaction graph, immune cells located in the junctional and sulcular stroma were extracted for further analysis. Interaction matrices were constructed to quantify the number of edges shared between each immune cell type within the junctional and sulcular stroma. Each entry in the interaction matrices represented the number of edges shared between the respective pair of immune cell types. To investigate the variation in immune cell interactions between the junctional and sulcular stroma, focusing on the levels of interaction between each immune cell type, we computed the difference in their respective interaction matrices. Specifically, we subtracted the interaction matrix of the junctional stroma from that of the sulcular stroma. The resulting matrix represented the difference in immune cell type interactions between the two regions, where more positive values represented greater interaction in the sulcular stroma and more negative values represented greater interaction in the junctional stroma. This subtraction matrix was then plotted as a hierarchically clustered heatmap using the Seaborn library in Python. This process was performed for each of the present slides to visualize the differences in immune cell interactions between the sulcular and junctional stroma across the various diseased patients. The resulting matrices were averaged to provide an aggregated view of the variations in the type of cells interacting with the immune cells.
Quantification and plotting of in situ hybridization
A multi-step approach to analyze RNA multiplex images was utilized after the image acquisition was performed using Fiji (ImageJ). The acquired.lif files were subsequently converted into 8-bit images, as an ome.tiff file (scripts available: see Code Availability). The RNA multiplex images were acquired at three different time points, each utilizing four probe sets on the same sample section. To ensure accurate representation, the three images from the same sample were overlaid using the Warpy and image combiner tools95, generating a 12-plex image represented in different channels. Subsequently, the images were subjected to segmentation using a pretrained model based on Cellpose 2.096 (Fig. 5; 12-plex ISH in vivo) or on StarDist97 (other analyses). The segmentation process was iteratively refined using images from 80 fluorescent images from post-mortem biopsies. The model was trained multiple times until achieving accurate delineation of cell expansion in both the basal and suprabasal layers. The gingival biopsy was segmented separately for each of the areas of interest—junctional epithelia, sulcular epithelia, and gingival margin—with each area divided into basal and suprabasal layers. Following the nuclei-based cell segmentation, subcellular analysis was performed using QuPath, where the number of RNA spots within each cell was detected based on the fluorescence intensity per spot. An individual spot was positive if its fluorescence intensity exceeded its threshold and negative if it did not. The raw data was then exported, and the number of RNA spots was detected and quantified per cell and channel. Subsequently, the raw data was processed as an input file through log scripts to rank the most highly expressed RNA transcripts and extract the field-of-view (FOV) from the X and Y coordinates of each cell. Manual thresholding was applied to define the positivity of the transcripts. To further analyze the RNA transcript data, we transformed the matrix into a Seurat object. The data were treated, and raw clustering was performed in the UMAP projection, as well as PCA evaluation, for each of the twelve probes analyzed, adding the spatial information regarding RNA transcript expression in each patient sample and providing RNA expression patterns within the basal and suprabasal layers from each of the ROIs in the tissue. Individual cell quantification was performed using a similar process (segmentation, manually-thresholded dot quantification) but was conducted independently to validate findings.
Reporting summary
Further information on research design is available in the Nature Portfolio Reporting Summary linked to this article.
- SEO Powered Content & PR Distribution. Get Amplified Today.
- PlatoData.Network Vertical Generative Ai. Empower Yourself. Access Here.
- PlatoAiStream. Web3 Intelligence. Knowledge Amplified. Access Here.
- PlatoESG. Carbon, CleanTech, Energy, Environment, Solar, Waste Management. Access Here.
- PlatoHealth. Biotech and Clinical Trials Intelligence. Access Here.
- Source: https://www.nature.com/articles/s41467-024-49037-y