Highly expressed Sema3C is correlated with stemness features in HCC
To explore the mechanism of interaction between CSCs and tumor stroma, we screened out genes that were highly expressed in cirrhosis and HCC tissues compared to normal liver tissues in GSE14323 and GSE6764 databases, and intersected with genes that were elevated in sorafenib-resistant HCC xenografts based on GSE121153 dataset to obtain 13 common genes (Fig. 1a). Among the 13 genes, we looked for secretory proteins that may mediate intercellular communication. Previous studies have reported that Sema3C, as a secreted glycoprotein, was elevated in HCC tissues and correlated with tumor size, portal vein embolization, and metastasis.15,16 Consistently, we found that Sema3C expression was higher in patients with stage III&IV than in patients with stage I&II (Fig. 1b). To detect the differential expression of Sema3C in circulatory levels between HCC patients and healthy individuals, we collected peripheral blood of 5 HCC patients and healthy people respectively and found that the concentration of Sema3C in HCC patients was higher than that of healthy individuals (Fig. 1c). By analyzing the data of TCGA-LIHC, HCC patients with elevated Sema3C expression have a worse prognosis compared to those with low Sema3C expression (Fig. 1d). Furthermore, we demonstrated that Sema3C expression was greatly enhanced at the fibrotic and advanced stages of DEN+CCl4-induced HCC models (Fig. 1e). Meanwhile, based on this HCC model, we also preliminarily evaluated the association of Sema3C with stemness. Tissue immunofluorescence (IF) showed that Sema3C and EpCAM expression were highly expressed in areas with high infiltration of CAFs, while low expression in areas with low abundance of CAFs (Fig. 1f). Previously, we constructed two sorafenib-resistant cell lines (Huh7 and HepG2),17 the results showed that Sema3C expression was significantly increased in sorafenib-resistant HCC cells (Fig. 1g).
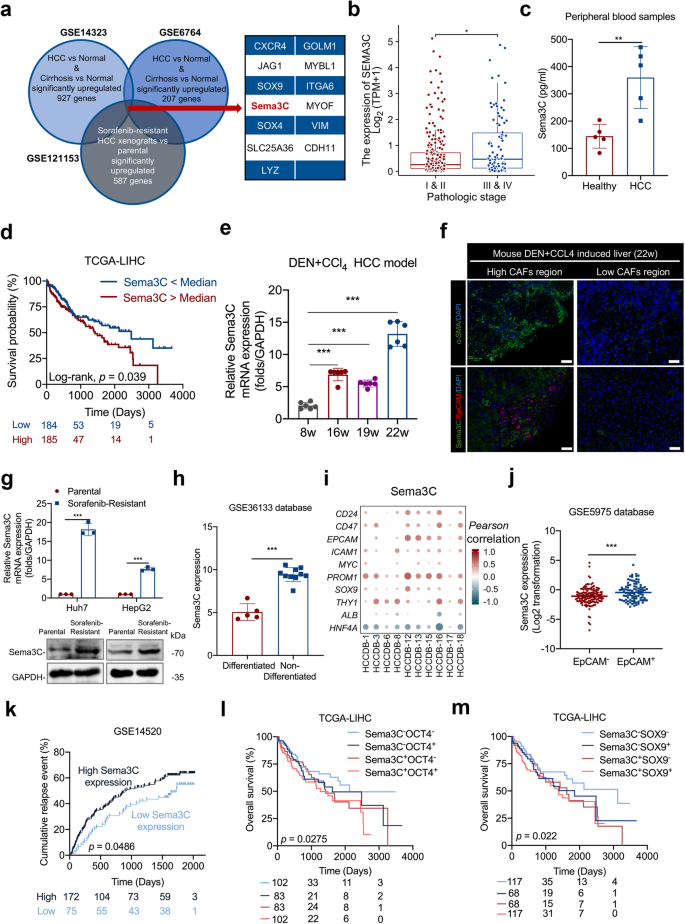
Highly expressed Sema3C is correlated with stemness features in HCC. a Identification of Sema3C with integrative analysis of public datasets, including genes up-regulated in both cirrhosis and HCC (GSE14323 and GSE6764) and in sorafenib-resistant HCC xenografts (GSE121153). b Correlation analysis between Sema3C expression and pathological stage. c The expression of Sema3C in peripheral blood of HCC patients and healthy individuals was determined by ELISA, n = 5. d Kaplan‒Meier survival analysis for overall survival in TCGA-LIHC dataset based on Sema3C median expression. e qRT-RCR analysis of Sema3C expression in DEN+CCl4-induced HCC model at various stages. 8w indicates normal liver, 16-19w indicates fibrotic liver, and 22w indicates HCC. f IF staining for Sema3C and EpCAM in DEN+CCl4-induced HCC tissues (22w). Cell nuclei were counterstained with DAPI. Scale bar, 50 μm. g The mRNA and protein expression of Sema3C in sorafenib-sensitive and sorafenib-resistant Huh7 and HepG2 cells. h Sema3C is highly upregulated in non-differentiated HCC cell lines compared to differentiated HCC cell lines from the GSE36133 database. i Correlation between Sema3C expression and stemness-associated genes in HCC using the HCCDB datasets. The dots in the figure indicate p < 0.05. The color intensity and size of the circle are proportional to the correlation coefficients. j Expression of Sema3C in EpCAM– and EpCAM+ cells from the GSE5975 database. k Cumulative relapse event analysis to predict HCC recurrence based on Sema3C median expression from the GSE14520 dataset. Kaplan‒Meier survival analysis for overall survival in TCGA-LIHC dataset based on Sema3C expression and OCT4+ (l) or SOX9+ (m) expression, respectively. Data are presented as means ± SD. *p < 0.05, **p < 0.01, ***p < 0.001
To further investigate the relationship between Sema3C and stemness, we analyzed its expression in both differentiated and non-differentiated HCC cell lines using the GSE36133 dataset, revealing higher expression in the latter. (Fig. 1h). In addition, by analyzing the correlations between the Sema3C and multiple stemness-related genes using the HCCDB databases, we discovered Sema3C was positively associated with CSCs markers, such as CD24, CD47, EPCAM, ICAM1, c-Myc, PROM1 (encoding CD133), SOX9, and THY1 (encoding CD90), while negatively correlated with hepatic lineage genes, such as ALB and HNF4A (Fig. 1i). Then, we compared Sema3C expression in EpCAM+ cells and EpCAM– cells in the GSE5975 database and found that Sema3C was up-regulated in EpCAM+ cells (liver CSCs) (Fig. 1j). Given that CSCs contribute to tumor recurrence, the impact of Sema3C on HCC relapse was examined using the GSE14520 dataset. The results showed that patients with highly expressed Sema3C had more HCC recurrence events than patients with low Sema3C expression (Fig. 1k). Besides, the survival analysis, stratified by the expression of Sema3C and stemness-related genes (OCT4 and SOX9), revealed that HCC patients expressing both Sema3C and OCT4/SOX9 had the worst prognosis (Fig. 1l, m). Altogether, these results suggested that Sema3C was up-regulated during HCC progression and was associated with HCC stemness.
Sema3C promotes stemness maintenance and initiation in HCC
To further explore the effect of Sema3C on the stemness phenotype of HCC, we compared the protein levels of Sema3C across multiple HCC cell lines. Our findings revealed elevated Sema3C expression in HCC cell lines compared to normal liver cell lines, and Sema3C was also expressed in hepatic stellate cells (LX-2) to a certain extent (Fig. 2a). In addition, we analyzed Sema3C expression variations across cell types in HCC using published single-cell datasets (GSE146115, GSE146409, and GSE166635). The results indicated that Sema3C was predominantly expressed in tumor cells and, to a lesser extent, in stromal cells, while it was rarely expressed in normal hepatocytes or endothelial cells, consistent with our in vitro cell line results (Supplementary Fig. 1a). Then, Hep3B and MHCC-97L were selected for Sema3C overexpression, while HepG2 and Huh7 were chosen for Sema3C knockdown (Fig. 2b). To determine Sema3C expression in CSC populations, we compared the protein levels of Sema3C between spheroids and non-spheroids. The results showed that Sema3C expression was significantly higher in spheroids than in non-spheroids (Fig. 2c). In line with bioinformatics analysis, Sema3C overexpression up-regulated the expression of stemness-related genes (Sox2, Oct4, Nanog, EpCAM, CD133, CD90, and CD24) in HCC cells when compared to empty vector controls (Fig. 2d). To further investigate whether Sema3C functionally contributes to drug resistance, self-renewal, and tumorigenesis, we conducted MTT and sphere formation assays. Sema3C overexpression in HCC cells significantly increased resistance to sorafenib, while Sema3C knockdown led to a marked decrease in resistance. (Fig. 2e, f). Meanwhile, HCC cells overexpressing Sema3C showed increased spheroid formation, while Sema3C knockdown cells had reduced spheroid formation (Fig. 2g, h). Additionally, colony formation experiments revealed that Sema3C overexpression promoted HCC proliferation, whereas Sema3C knockdown inhibited cell proliferation (Supplementary Fig. 1b, c). We also found that apoptosis was significantly inhibited in Sema3C-overexpressing HCC cells and enhanced in Sema3C-knockdown HCC cells (Supplementary Fig. 1d, e). Transwell assays further demonstrated that Sema3C overexpression promoted cell invasion and migration, whereas Sema3C knockdown attenuated cell invasion and migration (Supplementary Fig. 1f, g).
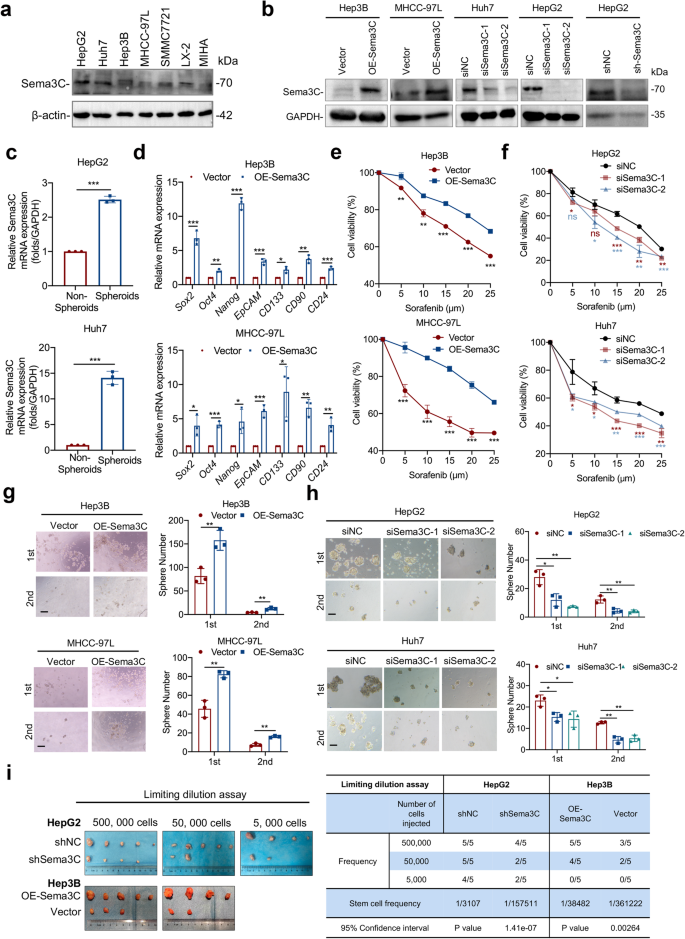
Sema3C promotes HCC stemness and initiation. a Sema3C protein expression levels in various HCC cell lines, hepatic stellate cells (LX-2) and normal liver cells (MIHA) were detected by Western blotting. b Sema3C protein expression levels were determined by Western blotting in Sema3C overexpressed and knockdown HCC cells. c Sema3C mRNA expression level in spheroids and non-spheroids cells of HepG2 and Huh7 cells. d The mRNA expression of stemness-associated genes in Sema3C-overexpressing HCC and control cells was determined by qRT-PCR analysis. The effect of Sema3C overexpression (e) or knockdown (f) on HCC cell chemoresistance was assessed by an MTT assay. The effect of Sema3C overexpression (g) or knockdown (h) on HCC cells self-renewal was evaluated by sphere formation assay. Scale bar, 100 μm. i Limiting dilution assay was conducted using HepG2 cells with Sema3C knockdown (shSema3C) or Hep3B cells infected with lentivirus-OE-Sema3C or empty vector in BALB/c nude mice (n = 5 per group). Student’s t test was used for comparing two groups and extreme limiting dilution analysis (ELDA) was used for limiting dilution assay. OE overexpression, NC nontarget control. Data are presented as means ± SD. *p < 0.05, **p < 0.01, ***p < 0.001
To evaluate the impact of Sema3C on tumor-initiating ability in vivo, a limiting dilution assay was conducted by subcutaneously injecting 5 × 10⁵, 5 × 10⁴, and 5 × 10³ HCC cells into nude mice. Hep3B cells overexpressing Sema3C showed a significantly higher tumor-initiating capacity compared to control cells. In contrast, Sema3C knockdown HCC cells resulted in a significantly reduced number of tumors compared to controls (Fig. 2i). Next, to verify the stemness maintenance role of secreted Sema3C in the TME, we conducted a series of rescue experiments. On the basis of endogenous Sema3C knockdown, recombinant human Sema3C (rhSema3C) was used to stimulate HCC cells. Transwell assay found that addition of rhSema3C could reverse the impact of Sema3C knockdown on invasion and migration of HCC cells (Supplementary Fig. 2a). MTT assay showed that the rhSema3C could reverse the sensitivity to sorafenib in HCC cells with Sema3C knockdown (Supplementary Fig. 2b). In addition, in vitro sphere formation also confirmed that secreted Sema3C could restore the spheroid formation of HCC cells upon Sema3C knockdown (Supplementary Fig. 2c). In summary, these findings demonstrate that Sema3C plays a critical role in enhancing HCC stemness, chemoresistance, and tumor initiation.
Sema3C maintains HCC stemness via a dysregulated AKT/Gli1/c-Myc signaling axis
To investigate the downstream mechanisms by which Sema3C maintains HCC stemness, pathway enrichment analysis based on the TCGA dataset was conducted. The result revealed a strong association between Sema3C and signaling pathways regulating stem cell pluripotency, consistent with our above findings. Additionally, significant KEGG enrichment was observed in the PI3K-AKT, Wnt, and Hippo signaling pathways (Fig. 3a). GSEA analysis also revealed that the PI3K-AKT and Hedgehog signaling pathways were highly enriched in HCC samples with elevated Sema3C expression (Fig. 3b). Given the role of PI3K/AKT, Wnt, Hippo, and Hedgehog pathways in stemness regulation, we detected key molecules within these pathways. Results suggested that Sema3C overexpression did not alter β-catenin or phosphorylated-YAP (p-YAP) protein levels (Fig. 3c). However, the mRNA levels of Gli1, Gli2, c-Myc, and CCND1 were increased in overexpressed-Sema3C HCC cells, and on the contrary, the levels of these target genes were decreased upon Sema3C knockdown (Fig. 3d). Consistently, western blot analysis confirmed that key mediators of the AKT and Hedgehog pathways—p-AKT, Gli1, and c-Myc—were highly expressed in Sema3C-overexpressing MHCC-97L HCC cells. Conversely, knockdown Sema3C in HepG2 cells attenuated the activated signaling. Furthermore, stimulation of MHCC-97L cells with varying doses of rhSema3C or at different time points revealed a dose- and time-dependent activation of the Gli1/AKT pathway (Fig. 3e). To further validate the significance of AKT/Gli1 signaling in Sema3C-driven HCC stemness, functional rescue experiments were performed in which a specific AKT inhibitor MK2206 was introduced into the Sema3C overexpressing HCC cells. MK2206 attenuated the stemness features induced by Sema3C overexpression, as evidenced by reduced chemoresistance in HCC cells (Fig. 3f), sphere-formation (Fig. 3g), migration, and invasion (Supplementary Fig. 2d). Previous study has demonstrated that the PI3K/AKT pathway could modulate the Hedgehog signaling pathway in renal cell carcinoma.18 Our findings indicated that MK2206 treatment blocked Sema3C-induced Gli1 protein expression in HCC cells, suggesting Sema3C could act as a mediator in potentiating AKT signaling activation of the Hedgehog pathway in HCC (Fig. 3h). This was further validated in an in vivo HCC model, where HepG2 cells with or without Sema3C knockdown were subcutaneously injected into nude mice. Upon Sema3C knockdown, the immunohistochemistry (IHC) staining revealed a decreased Ki67 expression as well as down-regulation of activated p-AKT, c-Myc, and Gli1 versus control tumors (Fig. 3I). Collectively, Sema3C-mediated activation of AKT and Gli1 signaling pathways promoted stemness maintenance of HCC.
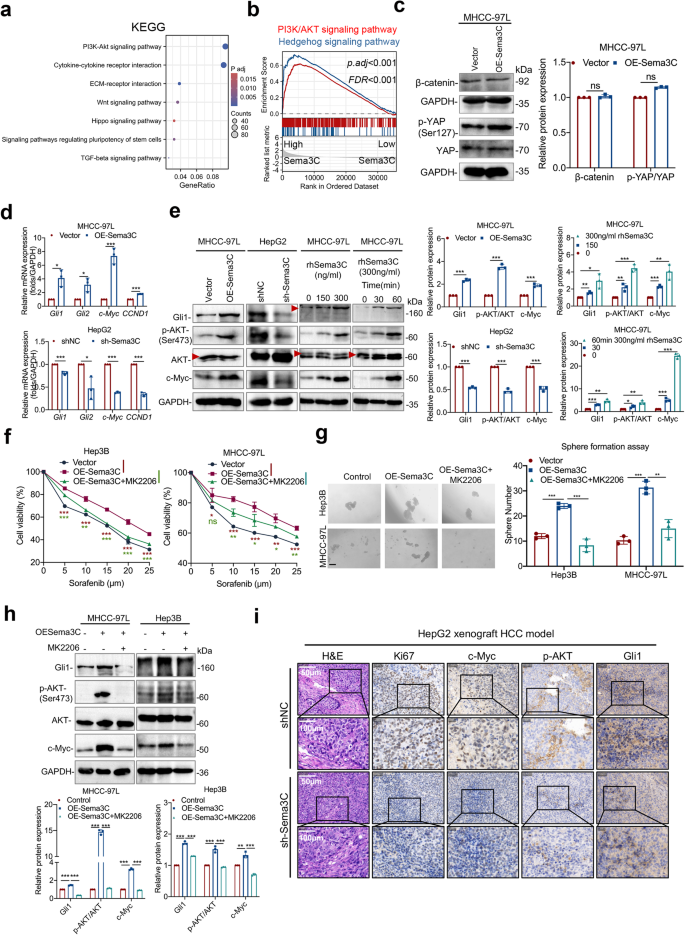
Sema3C drives HCC initiation via a dysregulated AKT/Gli1/c-Myc signaling axis. a KEGG pathway analysis found Sema3C to be highly correlated with PI3K-AKT signaling in HCC patients based on the TCGA-LIHC database. b GSEA identified an enrichment of genes involved in PI3K/AKT and Hedgehog signaling pathways in the high-Sema3C-expressing HCC group. c Western blotting analyses of the β-catenin and phosphorylated-YAP levels in Sema3C-overexpressing MHCC-97L cells. d The mRNA expression of Gli1, Gli2, c-Myc, and CCND1 in MHCC-97L cells transfected with OE-Sema3C or vector control and HepG2 cells transfected with sh-Sema3C or NC. e The protein expression levels of total AKT, p-AKT, Gli1, and c-Myc in MHCC-97L cells and HepG2 cells. Sema3C-overexpressing Hep3B and MHCC-97L cells were treated with MK2206 (AKT inhibitor) as indicated, and the cell viability was analyzed by an MTT assay (f), the ability of self-renewal was determined by a sphere formation assay, scale bar, 100 μm (g); the levels of Gli1, p-AKT, AKT, and c-Myc were determined by western blotting (h). i H&E and IHC staining for Ki67, c-Myc, p-AKT (Ser473) and Gli1 in HepG2 xenograft tumors. NC nontarget control; H&E hematoxylin-eosin; IHC immunohistochemistry; Data are presented as means ± SD. ns, not significantly; *p < 0.05, **p < 0.01, ***p < 0.001
Sema3C maintain HCC stemness via NRP1 and ITGB1
Previous studies have shown that Sema3C could bind to the neuropilins (Nrp1 or Nrp2), to mediate downstream signal transduction.19 Moreover, NRP1 was up-regulated in HCC and promoted the expansion of CSCs and tumor growth.20,21 To this end, we examined whether NRP1 mediated the stemness maintenance for Sema3C in HCC. MHCC-97L and Hep3B cells were treated with NRP1-targeting siRNA (Supplementary Fig. 3a, b), and results showed that knockdown of NRP1 attenuated Sema3C-induced chemoresistance, self-renewal, migration, and invasion of HCC cells compared to control cells (Supplementary Fig. 3c–e). Furthermore, we examined whether Sema3C-activated AKT and Gli1 signaling depended on NRP1 binding. Our results revealed that Sema3C-induced phosphorylation of AKT, and an increase of Gli1 and c-Myc expression were reversed by NRP1 knockdown (Supplementary Fig. 3f). NRP1 binds to a variety of downstream receptors, including the plexins and the integrins family.16 To identify co-receptors mediating stemness maintenance after Sema3C binds to NRP1, Sema3C and NRP1 were overexpressed in Huh7 cells, co-immunoprecipitation combined with mass spectrometry (IP/MS) revealed that only ITGB1, which belonged to the integrin family, could bind to both Sema3C and NRP1 (Fig. 4a, b, Supplementary Fig. 4a). Analysis of the TCGA-LIHC database showed a positive correlation between Sema3C and ITGB1 expression in HCC (Supplementary Fig. 4b). Co-immunoprecipitation (Co-IP) assays in Huh7 cells also confirmed the binding of Sema3C, NRP1, and ITGB1 (Fig. 4b). Simulated molecular docking results showed that VWFA domain (amino acids 140-378) of ITGB1 bound to Sema3C (Supplementary Fig. 4c). Moreover, NRP1 knockdown in Huh7 cells inhibited ITGB1 from binding to Sema3C, while NRP1 still bound Sema3C after ITGB1 knockdown, indicating that NRP1 acted as a ligand-binding receptor, facilitating the formation of a complex with Sema3C and ITGB1 in HCC cells (Fig. 4c). Furthermore, ITGB1 expression was significantly elevated in Sema3C-overexpressing Huh7 cells but decreased in Sema3C-knockdown HepG2 cells (Fig. 4d).
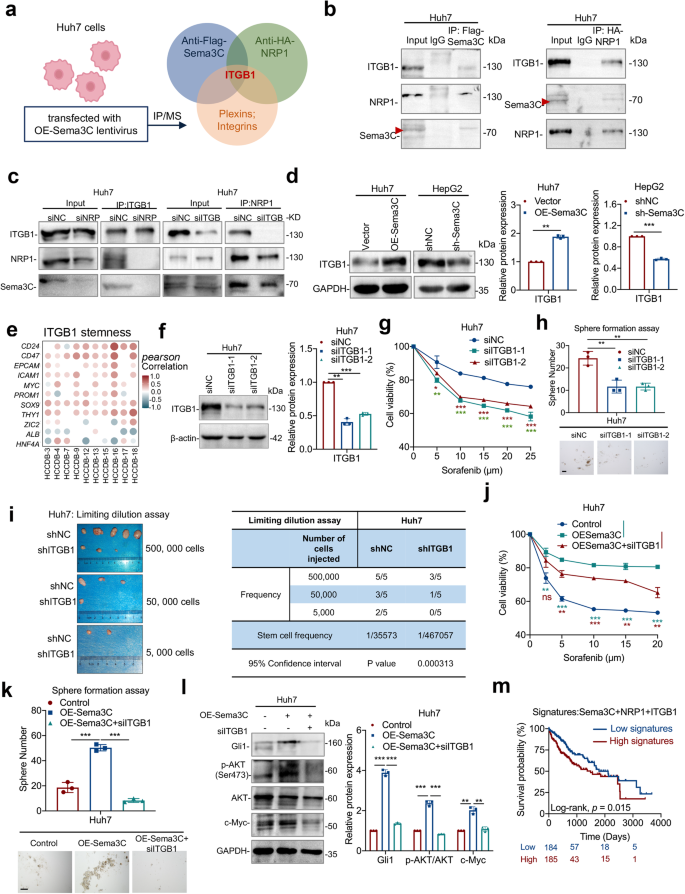
Sema3C drives stemness maintenance and signaling via NRP1 and ITGB1. a Scheme displaying the procedure used for identifying the potential receptors that can bind to Sema3C and NRP1. b Co-IP analysis for validation of ITGB1 as a binding protein of Sema3C or NRP1 in Huh7 cells. c NRP1 and ITGB1 were knocked down in Huh7 cells respectively, and the interaction between Sema3C, NRP1 and ITGB1 was detected by Co-IP. d ITGB1 expression was detected in HCC cells when Sema3C was overexpressed or knocked down. e Correlation between ITGB1 expression and stemness-associated genes in HCC using the HCCDB datasets. The dots in the figure indicate p < 0.05. The color intensity and size of the circle are proportional to the correlation coefficients. f The expression levels of ITGB1 were determined by western blotting in ITGB1 knockdown Huh7 cells. Huh7 cells transfected with siITGB1. The chemoresistant effect was investigated by an MTT assay (g). The ability of self-renewal was determined by a sphere formation assay, scale bar, 100 μm (h). i Limiting dilution assay of Huh7 cells with or without ITGB1 knockdown (shITGB1) in BALB/c nude mice (n = 5 per group). Huh7 cells were transfected with OE-Sema3C or siITGB1. The chemoresistant effect was investigated by an MTT assay (j). The ability of self-renewal was determined by a sphere formation assay, scale bar, 100 μm (k). The protein expression levels of Gli1, p-AKT, AKT, and c-Myc were validated by western blotting (l). m Kaplan–Meier survival analysis for overall survival of HCC patients segregated according to high or low gene signatures for Sema3C + NRP1 + ITGB1. Co-IP Coimmunoprecipitation. OE overexpression. NC nontarget control. Data are presented as means ± SD. ns, not significantly *p < 0.05, **p < 0.01, ***p < 0.001
Previous studies have shown that ITGB1 facilitates sorafenib resistance and tumor formation of HCC.22,23 Our study investigated the role of ITGB1 in HCC stemness regulation and found a positive correlation between ITGB1 expression and multiple stemness-related genes in the HCCDB database (Fig. 4e). siRNA was used to knock down ITGB1 in Huh7 cells (Fig. 4f), and results revealed that ITGB1 knockdown significantly inhibited chemoresistance, sphere-forming ability, migration, and invasion (Fig. 4g, h, Supplementary Fig. 4d). Concordantly, a subcutaneous tumor model of HCC showed that ITGB1 knockdown led to a significant reduction in tumor incidence rate (Fig. 4i). To characterize the role of ITGB1 in Sema3C-directed stemness, we transfected Huh7 cells with OE-Sema3C, with or without si-ITGB1. ITGB1 knockdown abrogated Sema3C-induced chemoresistance, self-renewal, migration, and invasion (Fig. 4j, k, Supplementary Fig. 4e). Moreover, silencing ITGB1 also antagonized Sema3C-induced upregulation of AKT phosphorylation, GlI1, and c-Myc expression (Fig. 4l). Additionally, NRP1 or ITGB1 knockdown in HCC cells weakened the stemness effect of rhSema3C, suggesting that rhSema3C relied on NRP1 and ITGB1 to exert its function (Supplementary Fig. 4f-h). Analysis of TCGA-LIHC data showed that HCC patients with high Sema3C, NRP1, and ITGB1 expression signatures had a worse prognosis (Fig. 4m). These results suggest that Sema3C regulates HCC stemness through the NRP1/ITGB1 axis.
HCC cells-derived Sema3C promotes ECM remodeling and HSCs activation
As axon guidance molecules, semaphorins establish and maintain effective communication links between axons and target cells, resulting in the formation of functional synapses.24 Inspired by this, we explored whether Sema3C secreted by HCC cells interacted with other TME components to reshape the tumor niche, promoting HCC stemness. Gene Ontology (GO) pathway enrichment analysis of proteins bound to Sema3C and NRP1 revealed significant enrichment in extracellular matrix organization, integrin-mediated signaling pathway, and collagen fibril organization. These findings suggested that Sema3C may regulate the ECM in the HCC microenvironment (Fig. 5a). To assess the effect of Sema3C on the ECM remodeling, a collagen contraction assay was conducted. We found that after being treated with the supernatants of OE-Sema3C-MHCC-97L cells, the gel contraction of collagen I was significantly enhanced (Fig. 5b). The MMP and lysine oxidase (LOX) family proteins are responsible for collagen remodeling in cancer.25,26 Overexpression of Sema3C markedly increased MMP2, MMP9, LOX, and LOXL2 levels, and treatment of MHCC-97L cells with rhSema3C elevated MMP2, LOX, and LOXL2 but not MMP9 (Supplementary Fig. 5a, b). To investigate the role of Sema3C in ECM remodeling in vivo, we performed orthotopic implantation of OE-Sema3C-MHCC-97L cells or control cells in nude mice. Tumors in mice injected with OE-Sema3C-MHCC-97L cells were significantly larger than those in control mice. Masson’s trichrome and PicroSirius red staining showed greater collagen fiber infiltration in OE-Sema3C tumors. IHC and quantitative analysis revealed increased α-SMA and collagen I expression in OE-Sema3C tumors compared to controls (Fig. 5c, d). These findings above revealed that Sema3C in HCC cells could exacerbate ECM deposition in the TME.
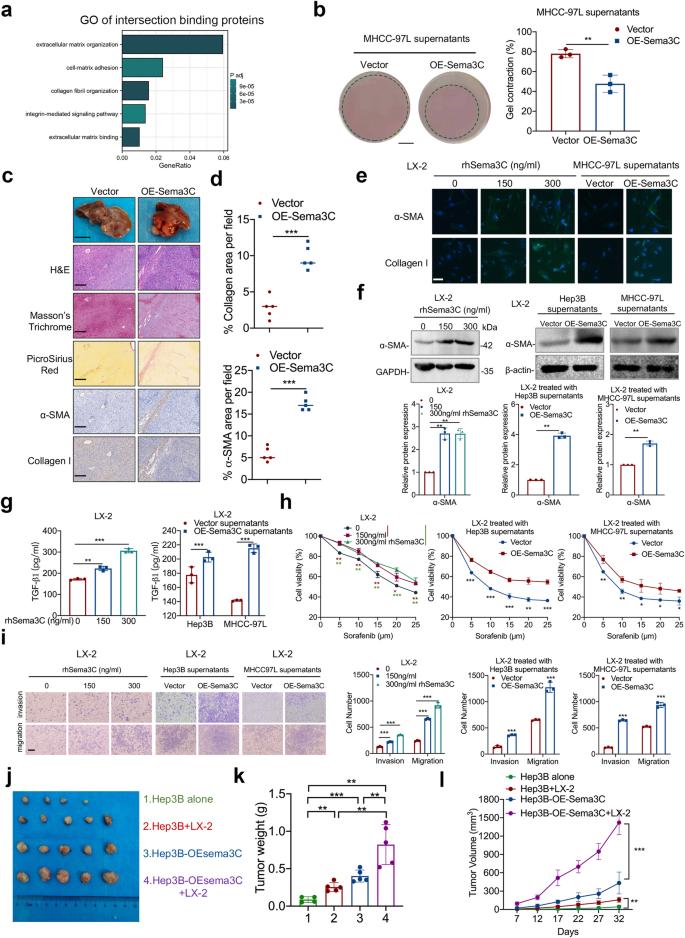
Sema3C is involved in the ECM remodeling and induces the HSCs activation. a GO analysis based on intersection proteins binding to Sema3C and NRP1. b Representative images of collagen gel contraction assays with MHCC-97L cells in either MHCC-97L supernatants or OE-Sema3C-MHCC-97L supernatants. Graph quantifying the change in the percentages of gel contraction by MHCC-97L cells in different conditions. Scale bar, 5 mm. c Representative images showing H&E, Masson’s trichrome and picrosirius red staining, and IHC staining for α-SMA and collagen I expression in serial sections of orthotopic liver xenograft tumors of BALB/C nude mice injected with MHCC-97L-Vector or MHCC-97L-OE-Sema3C cells. Gross tissue image scale bar, 1 cm, microscope image scale bar, 200 μm. d Percent of collagen fibers and α-SMA per field were counted in at least three random fields per animal, (n = 5). e Representative immunofluorescence images for α-SMA and collagen I in HSCs treated with dosage rhSema3C or supernatants of different Sema3C expression levels. Scale bar, 50 μm. LX-2 cells were treated with a gradient dose of rhSema3C or supernatants from Sema3C-overexpressed Hep3B and MHCC-97L cells. The α-SMA expression levels were detected by western blotting analysis (f). The TGF-β1 secretion was examined by ELISA assay (g). The chemoresistance ability was reflected by an MTT assay (h). The ability of migration and invasion was performed by Transwell assays, scale bar, 200 μm (i). 5 × 10⁵ Hep3B cells or OE-Sema3C Hep3B cells were injected subcutaneously into nude mice alone or mixed with LX-2 cells in a 1:1 ratio. The mice were sacrificed, and the xenograft tumors were excised 32 days after inoculation (j). The bar chart showed the tumor weight in each treatment group (k). The tumor volumes were monitored for 32 days (l). n = 5 per group. Data are presented as means ± SD. *p < 0.05, **p < 0.01, ***p < 0.001
In addition to directly regulating ECM, considering the secretory properties of Sema3C, we explored whether HCC-derived Sema3C could transform HSCs into CAFs in a paracrine way, thereby promoting ECM production. First, we treated LX-2 cells with rhSema3C and observed morphological changes using IF. The results showed that rhSema3C treatment markedly increased the cytoplasmic volume of LX-2 cells and induced the formation of more cellular projections (Supplementary Fig. 5c). In addition, rhSema3C could also enhance the proliferation ability of LX-2 cells (Supplementary Fig. 5d).
We collected conditioned medium (CM) from HCC cells with varying Sema3C expression levels and treated LX-2 cells for 48 h. The CM from OE-Sema3C-HCC cells or rhSema3C significantly increased the mRNA levels of ACTA2, COL1A1, ELN, and TGF-B1 (Supplementary Fig. 5e, f), as well as the protein expression of α-SMA and collagen I in LX-2 cells (Fig. 5e, f). Additionally, ELISA assay confirmed that Sema3C secreted by HCC cells promoted TGF-β1 production in LX-2 cells (Fig. 5g). Then the effect of Sema3C on the biological function of HSCs was verified. We found that CM from OE-Sema3C-HCC cells or rhSema3C significantly increased the capacity of LX-2 cells to chemoresistance, migration, and invasion as compared to controls (Fig. 5h, i). To verify the communication between HSCs and HCC cells, we collected CM from OE-Sema3C-activated LX-2 cells and co-cultured it with Hep3B cells. The results revealed that activated LX-2 upregulated stemness-related genes and enhanced chemoresistance in Hep3B cells, indicating that activated LX-2 cells were sufficient to induce stemness maintenance in HCC cells (Supplementary Fig. 5g, h).
To explore the impact of Sema3C-mediated interactions between HCC cells and HSCs on tumorigenesis in vivo, we constructed a xenograft HCC model by injecting HCC cells and HSCs subcutaneously into nude mice (Fig. 5j). Animals co-injected with OE-Sema3C Hep3B cells and LX-2 cells had a greater tumor weight and volume than all other groups (Fig. 5k, l). It is therefore suggested that HCC cells-derived Sema3C is involved in both remodeling ECM and activation of HSCs to form a supportive niche in TME.
IL-6 and cholesterol biosynthesis are responsible for Sema3C-mediated HSCs activation
According to the above findings, we explored the potential mechanism by which Sema3C induces HSCs activation. Thus, an RNA sequencing assay was performed based on LX-2 cells using rhSema3C or its control treatment. We identified 1383 differentially expressed genes (DEGs), with 1019 upregulated and 364 downregulated. IL6 and IL8 were the most significantly upregulated in the rhSema3C-treated groups compared to controls (Fig. 6a). Meanwhile, analysis of TCGA databases revealed a strong positive correlation between Sema3C expression and IL6, IL8 (CXCL8) expression in HCC (Supplementary Fig. 6a, b). To determine whether Sema3C directly promoted IL6 and IL8 production, we treated LX-2 cells with rhSema3C or supernatants from OE-Sema3C HCC cells, and only IL6 mRNA level was significantly upregulated (Fig. 6b). Moreover, ELISA experiments confirmed that gradient doses of rhSema3C or supernatants of OE-Sema3C-MHCC-97L cells increased IL6 secretion in LX-2 cells (Fig. 6c). To further investigate the biological processes involved in Sema3C-regulated HSCs activation, enrichment analysis of DEGs from transcriptome sequencing was performed. We found that Sema3C not only positively regulated IL6 production but also influenced cholesterol biosynthesis and metabolic processes in HSCs (Supplementary Fig. 6c-e). Consistently, rhSema3C significantly increased the total cholesterol content in LX-2 cells in vitro (Supplementary Fig. 6f). We identified the major DEG involved in cholesterol biosynthesis and metabolism, finding that HMGCS1, INSIG1, FASN, and HMGCR expression levels were significantly increased in the rhSema3C-treated groups (Supplementary Fig. 6g). Considering that HMGCR is the rate-limiting enzyme in the mevalonate pathway for cholesterol biosynthesis and its high expression in various tumor tissues promoted tumor progression.27,28 Therefore, we explored whether Sema3C affected cholesterol metabolism mainly by regulating HMGCR expression in HSCs. The results showed that rhSema3C treatment upregulated HMGCR mRNA and protein levels in LX-2 cells (Supplementary Fig. 6h, i). To elucidate the pathway by which Sema3C promoted IL6 secretion and cholesterol synthesis, we first investigated whether the PI3K/AKT pathway, known to be activated in HCC cells, was also involved in regulating LX-2 cells. However, the results suggested that rhSema3C could not increase AKT phosphorylation in LX-2 cells (Supplementary Fig. 6j). GSEA analysis revealed significant enrichment of the NF-κB pathway in rhSema3C-treated LX-2 cells (Fig. 6d). Treatment with rhSema3C or supernatants from OE-Sema3C HCC cells increased NF-κB (p65) phosphorylation in LX-2 cells (Fig. 6e, Supplementary Fig. 6k). To verify the involvement of NF-κB in Sema3C-induced HSCs activation, we pre-treated LX-2 cells with the NF-κB inhibitor-Bay 11-7082 and found that subsequent rhSema3C stimulation did not increase α-SMA or HMGCR expression (Fig. 6f, Supplementary Fig. 6l), and it also antagonized IL6 secretion and cholesterol synthesis (Fig. 6g, Supplementary Fig. 6m). Next, to explore whether Sema3C promotes HSCs activation via NRP1 and ITGB1, we performed Co-IP experiments showing that CM from Sema3C-expressing Hep3B cells induced NRP1-ITGB1 interaction in LX-2 cells (Fig. 6h). Silencing NRP1 in LX-2 cells using siRNA abrogated rhSema3C-induced IL6 secretion, NF-κB phosphorylation, α-SMA and HMGCR expression, and cholesterol synthesis (Fig. 6i, j, Supplementary Fig. 6n-p). To identify the involvement of ITGB1 in Sema3C-mediated HSCs activation, we found that ITGB1 protein levels were significantly increased in LX-2 cells treated with rhSema3C or supernatants of OE-Sema3C-HCC cells (Fig. 6k). Knockdown of ITGB1 similarly antagonized Sema3C-induced IL6 secretion, NF-κB phosphorylation, α-SMA and HMGCR expression, and cholesterol synthesis (Fig. 6l, m, Supplementary Fig. 6q-s). Additionally, phenotypic experiments demonstrated that knocking down NRP1 or ITGB1 reduced rhSema3C-induced TGF-β1 secretion, as well as proliferation, invasion, and migration of LX-2 cells (Fig. 6n–p). These findings suggested that Sema3C promoted HSCs activation by upregulating IL6 secretion and cholesterol synthesis through NRP1 and ITGB1.
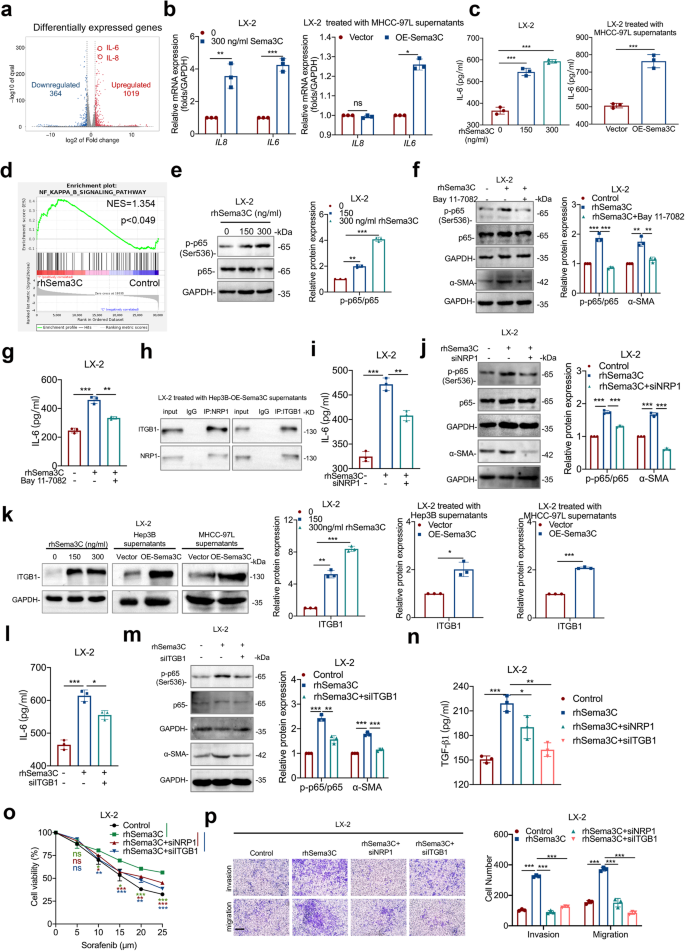
IL-6 and cholesterol biosynthesis are responsible for Sema3C-mediated HSCs activation. a The volcano map showed the differentially expressed genes of LX-2 cells treated with rhSema3C or PBS in vitro. HSCs were treated with rhSema3C or supernatants of MHCC-97L cells with different Sema3C expression levels. mRNA levels of IL6 and IL8 were detected using qRT-PCR (b). ELISA was used to examine the IL6 secretion level (c). d GSEA identified an enrichment of genes involved in the NF-κB pathway in rhSema3C-treated LX-2 cells. e Western blotting showed phosphorylated and total p65 protein expression levels in LX-2 cells treated with rhSema3C. LX-2 cells were pre-treated with Bay 11-7082 and subsequently stimulated with rhSema3C, the levels of phosphorylated p65, total p65, and α-SMA expression were determined by western blotting (f), and IL6 secretion levels were examined by ELISA assay (g). h LX-2 cells were treated with OE-Sema3C-Hep3B cell-derived supernatants, Co-IP assay was used to detect the interaction between ITGB1 and NRP1. LX-2 cells were transfected with siNRP1 and subsequently stimulated with rhSema3C, IL6 secretion levels were detected by ELISA (i). The phosphorylated p65, total p65, α-SMA, and HMGCR expression levels were determined by using western blotting (j). k LX-2 cells were treated with a dosage of rhSema3C or supernatants of Sema3C-overexpressed HCC cells, and ITGB1 protein expression was determined by western blotting. LX-2 cells were transfected with siITGB1 and subsequently stimulated with rhSema3C, and the IL6 secretion levels were detected by ELISA assay (l), the phosphorylated p65, total p65, and α-SMA expression levels were determined by using Western blotting (m). LX-2 cells were treated with siNRP1, siITGB1 or rhSema3C as indicated, the secretion of TGF-β1 in each group was detected by ELISA (n), the chemotherapy resistance of LX-2 cells was evaluated by MTT assay (o), and migration and invasion were performed by Transwell assay, scale bar, 200 μm (p). rhSema3C recombinant human Sema3C; Data are presented as means ± SD. ns not significantly; *P < 0.05, **P < 0.01, and ***P < 0.001
CAFs-derived TGF-β1 up-regulates Sema3C expression via AP1 in HCC cells
Research has shown that HSCs were the main source of CAFs in the TME, and CAFs could cross-talk with tumor cells to influence tumor progression in a paracrine way.7 Thus, we wondered whether Sema3C-induced CAFs activation could in turn regulate Sema3C expression in HCC cells to promote stemness maintenance, thereby creating a vicious cycle between stromal cells and tumor cells. First, analysis of the HCCDB database revealed a positive correlation between Sema3C expression and markers associated with CAFs, including ACTA2, VIM, FAP, PDGFRB, S100A4, and collagen-associated molecules, including COL1A1, COL1A2, FLNA, ELN, and LOX (Fig. 7a). We also found Sema3C to be significantly associated with the stromal score as calculated by using the R package “ESTIMATE” (Supplementary Fig. 7a). Furthermore, analysis using various algorithms in the TIMER2.0 database indicated a positive correlation between Sema3C expression and CAFs infiltration in HCC (Supplementary Fig. 7b). Immunofluorescence was employed to examine the spatial relationship between Sema3C expression and α-SMA+ CAFs in both human HCC samples and a mouse model of HCC induced by DEN+CCl4. We found that Sema3C expression was also increased in samples with high abundance of α-SMA+ CAFs infiltration, and the proximity of Sema3C to CAFs also indicated that Sema3C in HCC cells were constantly communicating with CAFs directly or indirectly (Fig. 7b, c). Furthermore, analysis of the TCGA-LIHC database revealed that HCC patients with high Sema3C expression and the presence of FAP+ CAFs subset showed a significant association with advanced tumor stages/T stages compared to those with low Sema3C expression and FAP+ CAFs. This suggested a clinical relevance of the interaction between Sema3C-expressing HCC cells and FAP+ CAFs in in driving malignant progression of HCC (Fig. 7d).
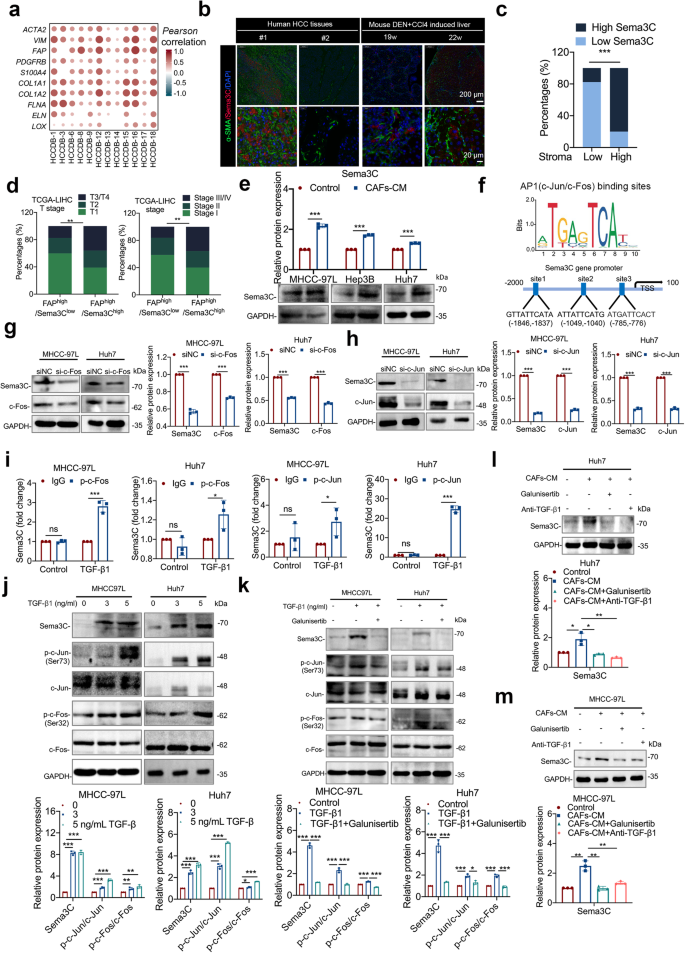
Sema3C expression is closely correlated with CAFs in HCC and is mediated by CAFs-derived TGF-β1. a Correlation between Sema3C expression and CAFs-associated genes (ACTA2, VIM, FAP, PDGFRB, and S100A4) and collagen-associated genes (COL1A1, COL1A2, FLNA, ELN, and LOX) in HCC using the HCCDB datasets. The dots in the figure indicate p < 0.05. The color intensity and size of the circle are proportional to the correlation coefficients. b Representative images of IF staining for low or high Sema3C expression (red) with different degrees of stromal infiltration (α-SMA-green) in HCC tissues or DEN+CCl4-induced mouse liver tissues. Cell nuclei were stained with DAPI (blue). c The correlation analysis revealed a positive correlation between high Sema3C expression and the stromal percentage in patients with HCC (total n = 27). d TCGA-LIHC analysis of the correlation between patients with T stage or stage and FAPhigh/Sema3Clow or FAPhigh/Sema3Chigh in HCC. e Western blotting showed that treatment with CAFs-conditioned media (CAFs-CM) significantly increased Sema3C expression compared with the control in HCC cells. f AP1 (including c-Jun/c-Fos) transcriptional binding sites in the Sema3C gene promoter. g, h MHCC-97L and Huh7 cells were transfected with si-c-Fos or si-c-Jun as indicated and the levels of Sema3C, c-Fos, and c-Jun were validated by western blotting. i ChIP-qPCR analysis showed that TGF-β1 stimulation facilitated the binding of phosphorylated c-Jun (p-c-Jun) and phosphorylated c-Fos (p-c-Fos) to the Sema3C gene promoter. j The levels of Sema3C, phosphorylated c-Jun (p-c-Jun), total c-Jun, p-c-Fos, and total c-Fos in MHCC-97L and Huh7 cells treated with different concentrations of TGF-β1 were determined by using western blotting. k Western blotting indicated that TGF-β1-induced Sema3C expression and AP1 signal activation could be inhibited by galunisertib (TGF-β1 receptor type I Inhibitor). l, m Western blotting confirmed that galunisertib and the TGF-β1 neutralizing antibody (anti-TGF-β1) inhibited the Sema3C upregulation stimulated by treatment with CAFs-CM. Data are presented as means ± SD. *p < 0.05, **p < 0.01, ***p < 0.001
To verify the dynamic communication between HCC cells and CAFs, primary CAFs were isolated from HCC clinical samples (Supplementary Fig. 7c). Then, HCC cells were cocultured with the CM of CAFs in vitro to confirm this hypothesis. The results indicated that treatment with CAFs-derived CM increased Sema3C expression in HCC cells compared to the control (Fig. 7e, Supplementary Fig. 7d). Previous studies have shown that TGF-β1 secreted by activated CAFs was involved in the regulation of tumor cells,29 and our above KEGG enrichment analysis also showed that Sema3C might be related to the TGF-β1 signaling pathway (Fig. 3A). We investigated whether TGF-β1 in CAF supernatants could enhance Sema3C expression in HCC cells. Analysis of the TCGA database showed a positive correlation between Sema3C and TGF-β1 expression in HCC (Supplementary Fig. 7e). Moreover, treatment of HCC cells with gradients of TGF-β1 in vitro significantly upregulated Sema3C mRNA levels (Supplementary Fig. 7f).
We explored the mechanism of TGF-β1-mediated Sema3C upregulation in HCC cells by analyzing the transcription factor binding sites in the Sema3C gene promoter region. Three AP1 binding sites were identified upstream (−1846 to −776 nucleotides) of the transcription start site (TSS) (Fig. 7f). Comparative analysis of AP1 family gene expression in MHCC-97L and Huh7 cells revealed that c-Jun and c-Fos exhibited the highest expression levels among the family genes (Supplementary Fig. 7g). As expected, silencing c-Jun/c-Fos with siRNA significantly inhibited Sema3C expression in HCC cells (Fig. 7g, h). Through ChIP-qPCR analysis, it was observed that stimulation with TGF-β1 led to a notable increase in the binding of phosphorylated c-Jun (p-c-Jun) and phosphorylated c-Fos (p-c-Fos) to the Sema3C promoter (Fig. 7i). Furthermore, the levels of p-c-Jun and p-c-Fos were increased with a dosage TGF-β1 treatment (Fig. 7j). To verify the regulatory effect of the TGF-β1-AP1 signaling axis on Sema3C, we performed rescue experiments using galunisertib (an inhibitor of TGF-β receptor 1), or a TGF-β1–neutralizing antibody. The results showed that galunisertib could block TGF-β1-induced Sema3C expression and phosphorylation of c-Jun and c-Fos (Fig. 7k). Besides, both galunisertib and TGF-β1–neutralizing antibody could antagonize CAFs-CM-mediated Sema3C expression (Fig. 7l, m). Collectively, AP1 signaling was accountable for the TGF-β1–mediated Sema3C upregulation in HCC cells.
Sema3C inhibition enhances sorafenib efficacy in HCC mouse model
The above studies have identified that Sema3C was up-regulated in sorafenib-resistant HCC cells and this elevated expression of Sema3C led to sorafenib resistance in vitro. However, targeted inhibitors for Sema3C are not commercially available nowadays. Therefore, we examined the therapeutic targeting of Sema3C by intravenous injection of rAAV8-shSema3C alone or in combination with sorafenib in a DEN+CCl4-induced HCC mouse model. At 20 weeks, the mice were injected with the rAAV8-shSema3C or its control rAAV8-shNTC via the tail vein. Three weeks later, the mice were segregated into 4 groups and then administrated with sorafenib at 30 mg/kg or DMSO control for 3 weeks (Fig. 8a). We randomly selected 3 mice from each group to verify the knockdown efficiency of Sema3C after removing liver tumors (Fig. 8b). We found that the combination of rAAV8-shSema3C and sorafenib significantly inhibited liver-to-body weight, tumor numbers, and the maximum size of tumors (Fig. 8c–f). Notably, The combination treatment of rAAV8-shSema3C and sorafenib significantly improved survival compared to mice treated with DMSO control, sorafenib alone, or rAAV8-shSema3C alone (Fig. 8g). IHC analysis of proliferative marker Ki67, Collagen I, and EPCAM in the excised livers from the four treatment groups revealed a marked decrease in the rAAV8-shSema3C/sorafenib combination group, suggesting knocked down of Sema3C did effectively impair proliferative capacity, stromal deposition, and stemness niche of the tumor (Fig. 8h). Collectively, these results suggested that inhibition of Sema3C sensitized HCC cells to sorafenib and synergically reduced tumor growth.
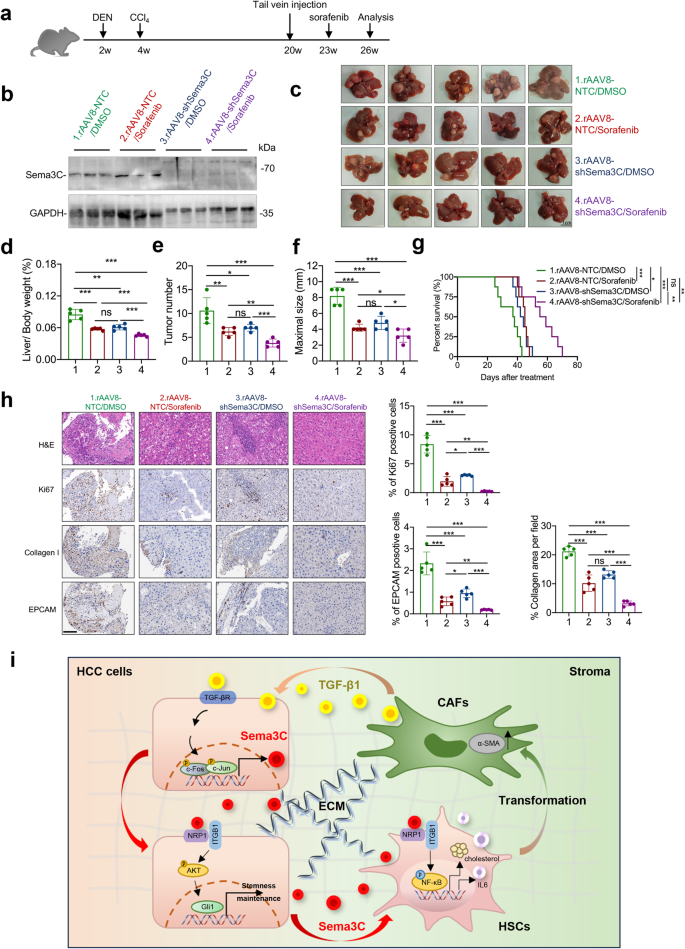
Sema3C inhibition enhances sorafenib efficacy in HCC mouse model. a Diagram demonstrated the time point of DEN+CCl4-induced mouse HCC model and treatment mode. b The mouse livers from the indicated groups were removed after 26 weeks, and the protein expression of Sema3C was detected by western blotting. c Representative images of mouse liver tissue from the indicated groups at 26 weeks (n = 5 per group), scale bar, 1 cm. Liver/body weight (d), tumor number (e), and maximal size of tumor of the indicated groups (f). g Kaplan–Meier survival curve showing percentage of overall survival of each annotated group (n = 8). h H&E, IHC staining and statistical analysis for Ki67, Collagen I, and EpCAM in HCC tumors harvested from the 4 treatment groups (n = 5 per group). Scale bar, 100 μm. i Schematic diagram showing that Sema3C mediates the interaction between CSCs and stroma in HCC. H&E hematoxylin-eosin, IHC immunohistochemistry; Data are presented as means ± SD. ns, not significantly; *p < 0.05, **p < 0.01, ***p < 0.001
- SEO Powered Content & PR Distribution. Get Amplified Today.
- PlatoData.Network Vertical Generative Ai. Empower Yourself. Access Here.
- PlatoAiStream. Web3 Intelligence. Knowledge Amplified. Access Here.
- PlatoESG. Carbon, CleanTech, Energy, Environment, Solar, Waste Management. Access Here.
- PlatoHealth. Biotech and Clinical Trials Intelligence. Access Here.
- Source: https://www.nature.com/articles/s41392-024-01887-0