Isolation of EPS producing lactic acid bacteria (LAB)
Different raw milk and yogurt samples were screened for the presence of LAB. Ten (10) morphologically different isolates were selected for further analyses. Based on the distinct characteristics of LAB (Table 2), Gram-positive bacilli, catalase and coagulase-negative isolates were selected for further analyses42. The slimy appearance on MRS plates (Fig. S1) and the reaction on Congo red agar also confirmed the exopolysaccharide production as reported by Patil et al.43. To be efficient LAB, a probiotic must withstand the acidic conditions of the stomach, and then tolerate exposure to bile acids in the small intestine44. The survival rate of LAB in the gastrointestinal juice was presented in Table 3. Data revealed that highest survival rates in gastric juice (pH 3.0) and intestinal juice (pH 8.0) was recorded for isolate number 1 (97.87 and 86.84% respectively).
Screening for exopolysaccharide production
Crude EPS of all the isolates under test were extracted by ethanol precipitation technique. It was noticed that LAB’s EPS dry weight ranged from 3.78 to 8.15 g/L (Fig. 1). Torino et al.45, reported that L. reuteri Lb121 EPS dry weight was 10 g/L. On the other hand, Nguyen et al.8 mentioned that the highest EPS dry weights yield was noticed when LAB isolates were inoculated on 20% sucrose (as a sole carbon source). Yu et al.46 revealed that LAB isolated from kimchi produced up to 9.80 g/L of EPS in response to the high sucrose concentration in the fermentation media.
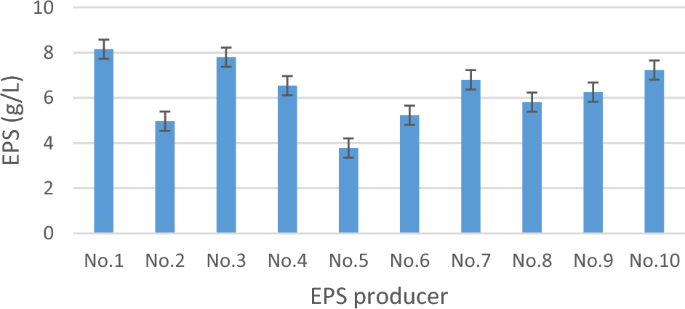
EPS production by the isolated EPS producing LAB.
Screening for the antimicrobial activity of the extracted EPS
Antimicrobial activity of the extracted EPS was evaluated by disc diffusion method. Isolate no.1 was the most promising EPS producing LAB with the highest antimicrobial activity against most of the tested pathogens, especially Staphylococcus aureus, MRSA, Enterobacter aerogenes, Klebsiella pneumoniae and Candida albicans with inhibition zone diameter (IZ) reached 8, 8, 8, 7 and 8 mm respectively (Table 4).
Aullybux et al.47 tested the antibacterial activity of EPS (extracted from Halomonas sp.) which exhibited promising antibacterial properties against several human pathogens namely Enterobacter aerogenes, Escherichia coli, Proteus vulgaris and Staphylococcus aureus. Similarly Saleem et al.48 and Hashem and Salem37 isolated LAB strains from traditional Chinese cheese with potent antibacterial activity against both Gram positive and negative bacteria. It is well known that the antimicrobial activity of L. plantarum is mainly exerted by bacteriocins (~ 60% of the reported strains) or partially characterized proteinaceous compounds, followed by organic acids or acidic conditions, and biosurfactants (BS) such as glycoproteins and EPS49. Broadly, the mechanism of action of these bioactive compounds is disruption and/or perforation of target cell membranes44.
Identification of the most promising isolate
16S rRNA sequencing was used to identify the most potent isolate (isolate no.1). Multiple sequence alignment was performed in accordance with the National Center for Biotechnology Information (NCBI) database. The promising strain was identified as Lactiplantibacillus plantarum strain A2 with accession number OP218384 (Fig. 2).
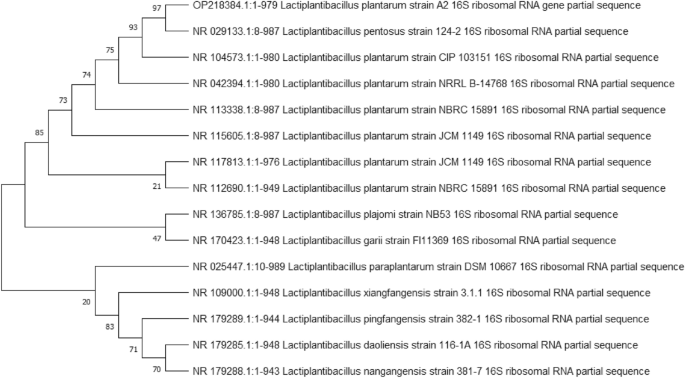
Phylogenetic tree of the most potent isolate.
Protein and total carbohydrate content of the selected EPS.
The protein content of Lactiplantibacillus plantarum OP218384 crude EPS was 3.71 ± 0.55 mg/g, while total carbohydrate content ranged from 68.963 to 76.879 mg/g.
Characterization of EPS
Fourier transform infrared spectroscopy (FT-IR) spectra analysis
The common characteristic absorption peaks of polysaccharides are the stretching vibrations of O–H bond (3200–3500 cm−1), C–H bond of the methylene groups (2930 cm−1), and saccharides ether linkage (1000–1200 cm−1). FTIR spectroscopic analysis of EPS (Fig. 3) revealed the broad characteristic absorption peak around 3257.2 cm−1, which is attributed to stretching vibrations of OH groups of the polysaccharide and the water constitutional molecules. The absorption peaks at ca. 2922.9 cm−1 and 1653.6 cm−1 signifies respectively the stretching and bending vibrations of C–H bond of methylene (CH2) group. In the critical identification region of polysaccharides, 1000–1200 cm−1, the stretching vibration band for C–O–C bond of the sugar cyclic form appeared at 1142.30 cm−1. The sharp weak absorption peak at approximately 917.5 cm−1 can be assigned to the skeletal mode vibrations of α-(1 → 4) glycosidic linkages. Whereas the presence of α-(1 → 6) glycosidic linkages can be indicated by the sharp strong absorption band at ca. 1014.4 cm−1. Overall, FTIR data of EPS in the functional groups region revealed similarity with amylopectin spectrum, in agreement with Miao et al.50.
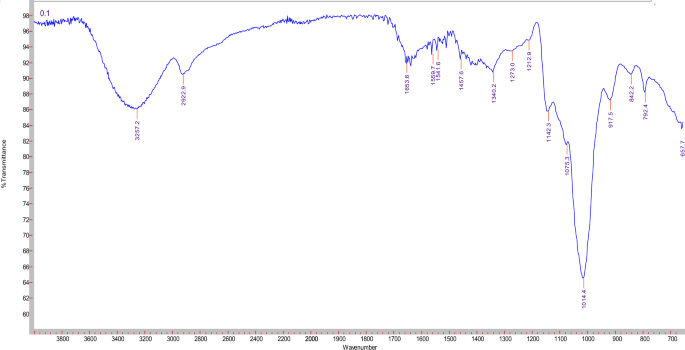
FTIR analysis of crude EPS.
Nuclear magnetic resonance (NMR) spectroscopy analysis
EPS of Lactiplantibacillus plantarum OP218384, was further analyzed using NMR spectroscopy. 1H NMR and 13C NMR analyses are usually employed for identifying the configuration of the glycosidic bond of EPS and revealing its composition19,48. In particular, signals appearing in the anomeric region (δ 4.5–5.5 ppm) of 1H NMR spectrum can differentiate between α- and β-anomeric protons of sugar residues in polysaccharides. Chemical shifts (δ) between 4.4 and 4.8 ppm represent the β-anomeric protons, whereas anomeric protons of α-linked residues usually resonate between 4.9 and 5.3 ppm19. In the present study, the 1H NMR spectrum (Fig. 4) revealed an α-anomeric configuration of the glycosidic linkage pattern in the polysaccharides. As displayed in Fig. 4, two main regions can be detected in the 1H NMR: the first is the anomeric protons region as characterized by the signals between δ 4.8–5.4 ppm, while the signals nearby δ 3.4–4.2 ppm signify the second region of protons linked to C2–C6. In the anomeric proton’s regions, two major peaks can be distinguished at δ 5.25 ppm and δ 4.90 ppm representing α-(1 → 4) and α-(1 → 6) linked D-glucans, respectively. The observed integration of the two peaks suggests a ratio of α-(1 → 6) linkages to α-(1 → 4) linkages of approximately 2:1. The 13C NMR spectrum (Fig. 4) can also be separated into two main portions, the anomeric carbons region (δ 98–102 ppm) and the nonanomeric carbons region (δ 60–81 ppm).
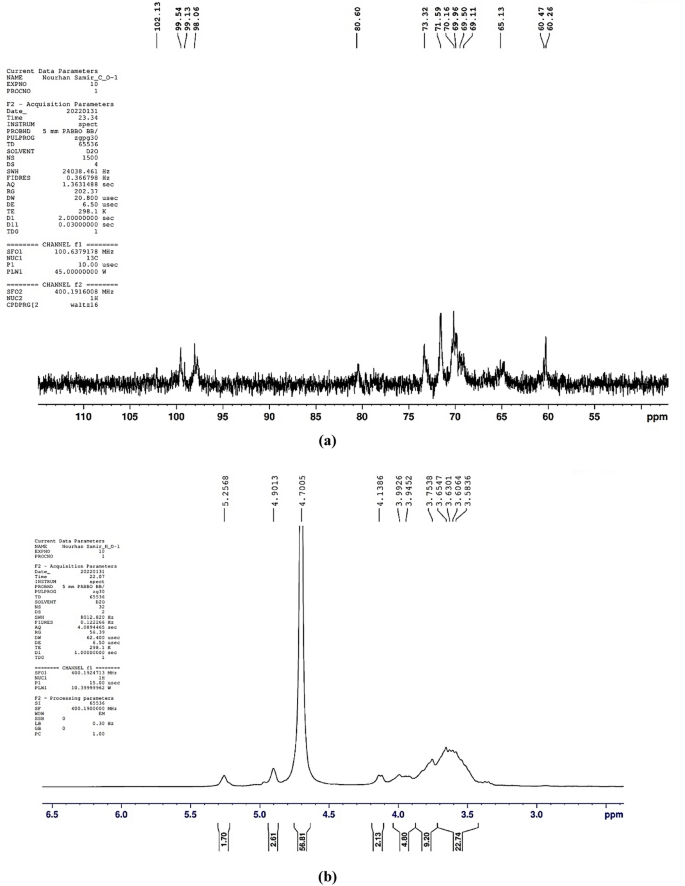
1H NMR (a) and 13C NMR (b) spectra of Lactiplantibacillus plantarum OP218384 EPS.
LC–ESI–MS (liquid chromatography electrospray ionization tandem mass spectrometric)
LC–ESI–MS was used to identify the monomeric sugars that composed the EPS. Both positive and negative modes were performed. In the present study as shown in Fig. 5. The prominent ions at m/z 855 demonstrated glycosidic cleavage production. The ions at 655, 519, 353, and 213 m/z ascribed to hexose monosaccharide sodium adduct ions in accordance with Nunes et al.51. Moreover, Tudella et al.52 also reported the glycosidic bond cleavage for hexose oligosaccharides typical of (1–4)-linked pyranosyl units.
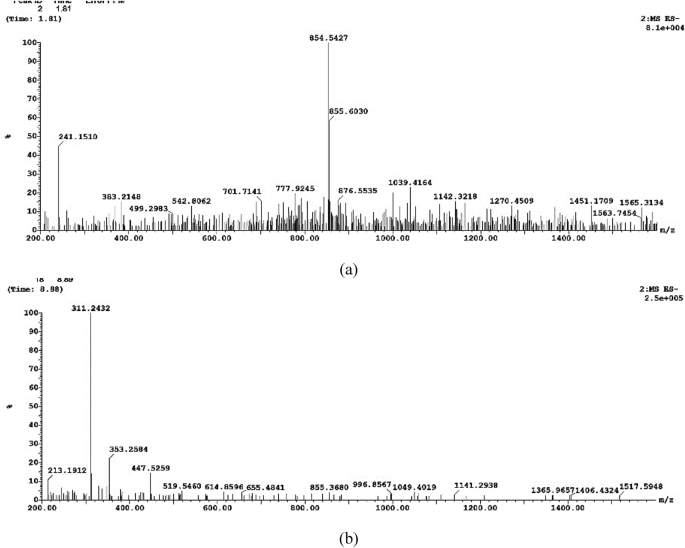
LC–ESI–MS analysis of Lactiplantibacillus plantarum OP218384 EPS.
Transmission electron microscopy (TEM)
Morphological study of Lactiplantibacillus plantarum OP218384 cells using transmission electron microscope studies revealed the presence of capsulated cells surrounded by a regular network-like structure defined as the EPS layer (Fig. 6). There has been speculation on the potential role of EPS production as a strategy used by L. plantarum to adapt to certain conditions inside the gastrointestinal environment53.
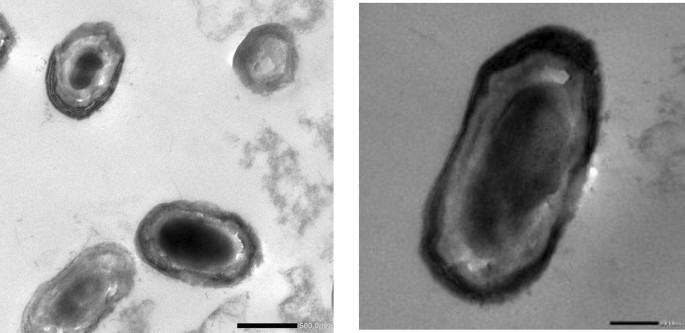
Transmission electron microscopy of Lactiplantibacillus plantarum OP218384 cells.
Optimization of biomass and EPS production using Taguchi orthogonal array
Optimization of nutritional and environmental factors that lead to optimum Lactiplantibacillus plantarum OP218384 biomass and EPS production was carried out using Taguchi orthogonal array with 8 factors design of experiment (DOE) (Table 1). Eight variables were used namely: peptone, yeast extract, dextrose, sucrose, pH, temperature, inoculum size, and culture volume. A 27-run model was performed, the biomass and EPS response values were recorded using Mintab19 software. Statistical significance was done using the analysis of variance (ANOVA). Lactiplantibacillus plantarum OP218384 biomass and EPS production were significant, as indicated by F-value of the model. Trial number 23 showed the highest yield (6.5 and 27.12 g/L for biomass and EPS productions, respectively) (Table 5, Table S3) with 2.4 and 3.3 folds increase respectively (Fig. 7). The optimum level for each variable was shown in Figs. 8, (Tables S4 and S5).
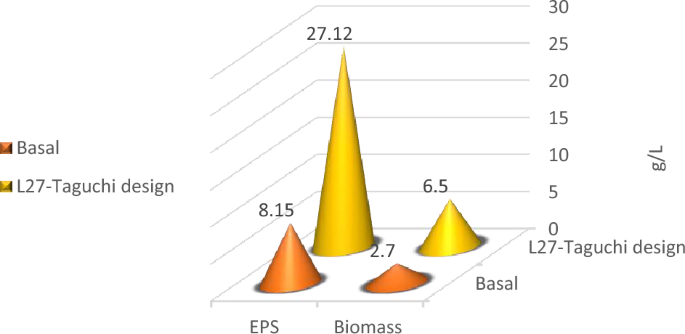
The 3D graph of the basal and L-27 Taguchi design trials for biomass and EPS production.
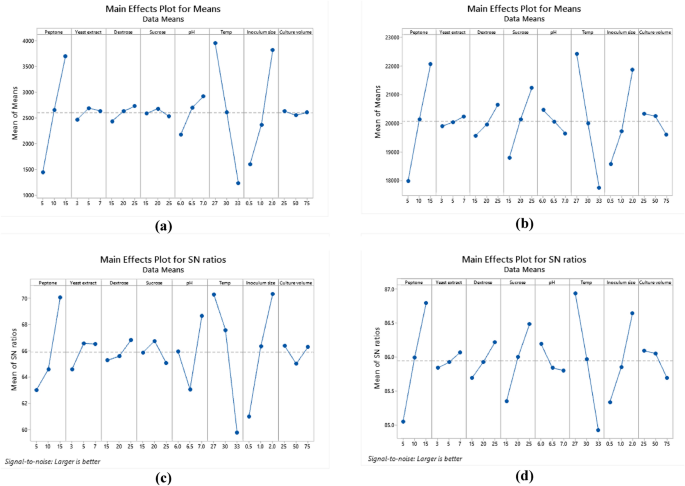
Response graph for relative factors means of biomass. (a), EPS (b). Response graph for S/N ratios for relative factors of biomass (c). and EPS (d).
Analysis of variance (ANOVA) was used to analyze the variables interactions and the factors variation contribution of Taguchi design results. It was concluded that data in equations R1 & R2 were consistent with the experiment. Temperature showed the highest influence on the production of biomass and EPS (Fig. 9a,b) followed by peptone, inoculum size (P < 0.05) (Table 6, Table S6). The residual diagrams (Fig. 9c,d) indicated that the errors were regularly distributed. The studied interactions between the main effective factors were proved by the Contour plot diagrams (Figs. 10, 11). The selected factors interacted with each other to maximize the production of both biomass and EPS. The statistical experimental studies concluded that the optimum parameters that lead to maximum EPS and biomass yield were peptone, 15.0 g/L: yeast extract. 5.0 g/L; dextrose,15.0 g/L; sucrose 25.0 g/L; pH, 6.5; temperature, 27 °C; inoculum size, 2.0 and culture volume, 5.0 mL. Studies have shown that the optimal deproteinization range of LAB fermentation between 30 and 40 °C54. Relevant studies have shown that while an increase in temperature can enhance bacterial activity, excessively high temperatures can cause irreversible denaturation of proteins and nucleic acids in microorganisms, negatively affecting strain activity55.
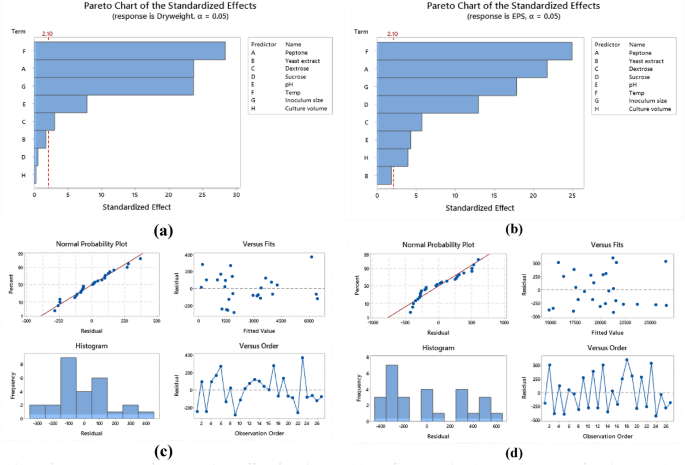
Pareto chart of standardized effect for biomass (a), EPS production (b), Residual Plot for biomass (c), EPS (d).
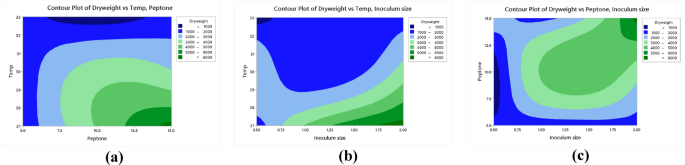
Contour plots of the relationship between biomass versus temperature and peptone (a), biomass versus temperature and inoculum size biomass (b) biomass versus peptone and inoculum size (c).
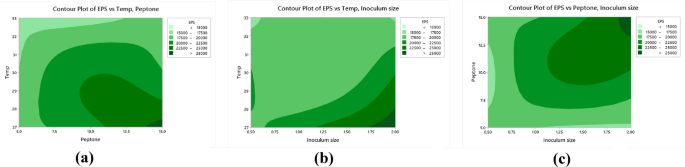
Contour plots of the relationship between: EPS versus temperature and peptone (a), EPS versus temperature and inoculum size (b), EPS versus peptone and inoculum size (c).
Similarly Prete et al.56 reported that physicochemical parameters (pH 6.5, temperature, inoculum size, culture volume and organic nitrogen sources (yeast extract, peptone)) significantly affected EPS production from LAB isolates. The primary objective of another research study was to optimize the fermentation conditions using the Plackett–Burman (PB) and response surface methodology (RSM) to enhance the EPS production57. Afreen et al.57 reported that Lactiplantibacillus paraplantarum NCCP 962 was identified and PB design successfully identified four independent components, including lactose, yeast extract, CaCl2, and tryptone, which were shown to have a statistically significant effect. The highest yield of EPS (0.910 g/L) was achieved when the lactose concentration was 6.57%, yeast extract concentration was 0.047%, CaCl2 concentration was 0.59%, and tryptone concentration was 1.37%. Zhang et al.58 study, the production process of EPS was optimized through applying initial pH 6, inoculation amount 5% (v/v), temperature 37 °C, cultivation time 36 h, glucose 3% (w/v), soy peptone 1.5% (w/v), KH2PO4 0.3% (w/v) to reach EPS yield 0.630 mg/mL, which was 1.31 times higher than the basal conditions.
Regression analysis modeling for biomass and EPS
Linear regression analysis in Minitab 19 software was used to develop the predictive mathematical models for the dependent variables (Eqs. 5, 6). The R2 value above 97% explains the higher variability and depicts the model’s validity.
$$ R1;(biomass;production) = 6.635 + 0.22656{text{X}}1 + 0.0417{text{X}}2 + 0.02933{text{X}}3 – 0.00567{text{X}}4 + 0.7522{text{X}}5 – 0.4524{text{X}}6 + 14817{text{X}}7 – 0.00053{text{X}}8 $$
(5)
(R2 = 99.11%)
$$ R2;(EPS) = 35.40 + 0.4086{text{X}}1 + 0.0864{text{X}}2 + 0.1083{text{X}}3 + 0.2434{text{X}}4 – 0.817{text{X}}5 – 0.7798{text{X}}6 + 2.195{text{X}}7 – 0.01491{text{X}}8 $$
(6)
(R2 = 98.92%)
Selenium nanoparticles (EPS-SeNPs) synthesis and characterization
The optimized EPS was used as a reducing and capping agent for selenium nanoparticles (SeNPs) synthesis. The color change of the exopolysaccharide/sodium selenite (Na2SeO3) solution from colorless to orange after ascorbic acid addition proved the formation of EPS-SeNPs as described by Tang et al.34 (Fig. S2). The synthesized selenium nanoparticle was scanned using U.V spectroscopy to assess the characteristic peak of SeNPs at 263 nm (Fig. 12a). Tang et al.34 synthesized selenium nanoparticles with Gracilaria lemaneiformis exopolysaccharides and reported the presence of SeNPs characteristic peak around 263 nm.
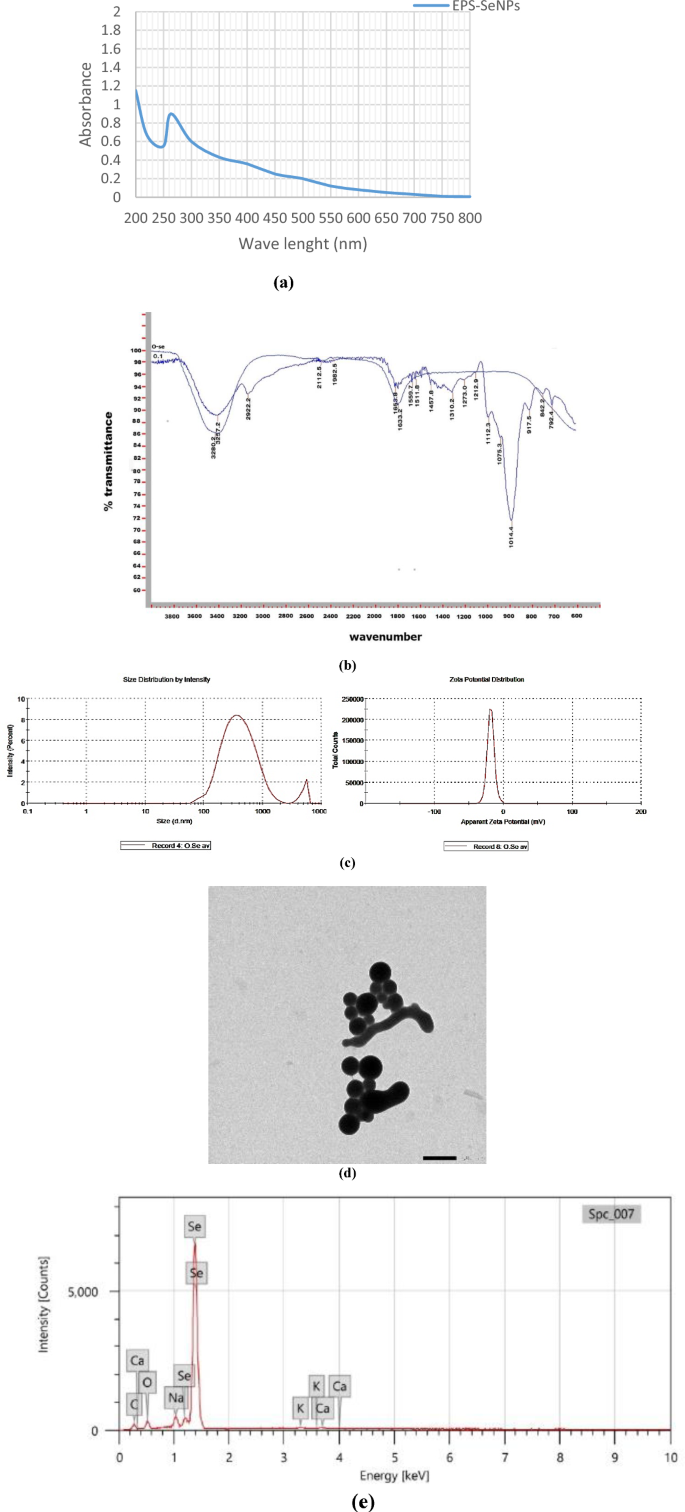
EPS-SeNPs physicochemical characterization where FTIR (a), UV spectrum (b), zeta potential, particle size (ps) and polydispersity index Zeta potential (c), TEM analysis (d) and EDX (e).
FTIR analysis proved the EPS role as a coating and stabilizing agent during the synthesis of the SeNPs, through the formation of strong hydrogen bond (Se-OH). The similarity between the FTIR spectra of EPS-SeNPs and EPS indicates slight shift of the hydroxyl group position (shifted from 3257 cm−1 (EPS) to 3289.2 cm−1 (EPS-SeNPs)) (Fig. 12b). In a trial to determine the homogeneity and stability of EPS-SeNPs, zeta potential and PDI were measured (− 19.7 mv and 0.446 respectively) (Fig. 12c). The observed negative zeta potential value confirmed the EPS involvement in the formation, stabilization, and growth of well-dispersible SeNPs34. Moreover, the structure, size, and shape of the biosynthesized EPS-SeNPs were examined by TEM, which revealed that EPS-SeNPs had a spherical shape with size ranged from 45 to 65 nm (Fig. 12d). Similarly, Cai et al.59 synthesized SeNPs using Lignosus rhinocerotis exopolysaccharide and reported that SeNPs diameter was 50 nm.
EDX analysis of the prepared EPS-SeNPs revealed that Se percentage was 32.71%, while oxygen and carbon atoms were 14.72, 48.43% respectively (Fig. 12e). Likewise, Cao et al.60 synthesized selenium nanoparticles from Grateloupia Livida exopolysaccharides with Se atom content accounted 36.49% of the total elements.
Antimicrobial activity of EPS-SeNPs
The highest antibacterial effect of EPS-SeNPs was shown against Staphylococcus aureus with inhibition zone 40.3 ± 0.57 mm followed by Klebsiella pneumoniae, MRSA and E. coli (35.3, 35 and 30.7 mm respectively) (Fig. S3). The prepared nanoparticles showed strong antifungal effect against Candida albicans (49.6 ± 0.57 mm) (Table 7). MIC index values of the synthesized EPS-SeNPs revealed a bactericidal and fungicidal effect against the tested pathogens. Microbial time kill curve study revealed the full eradication of microbial growth after 6, 8 and 10 h against Staphylococcus aureus, E. coli, Candida albicans and Klebsiella pneumoniae respectively (Fig. 13).
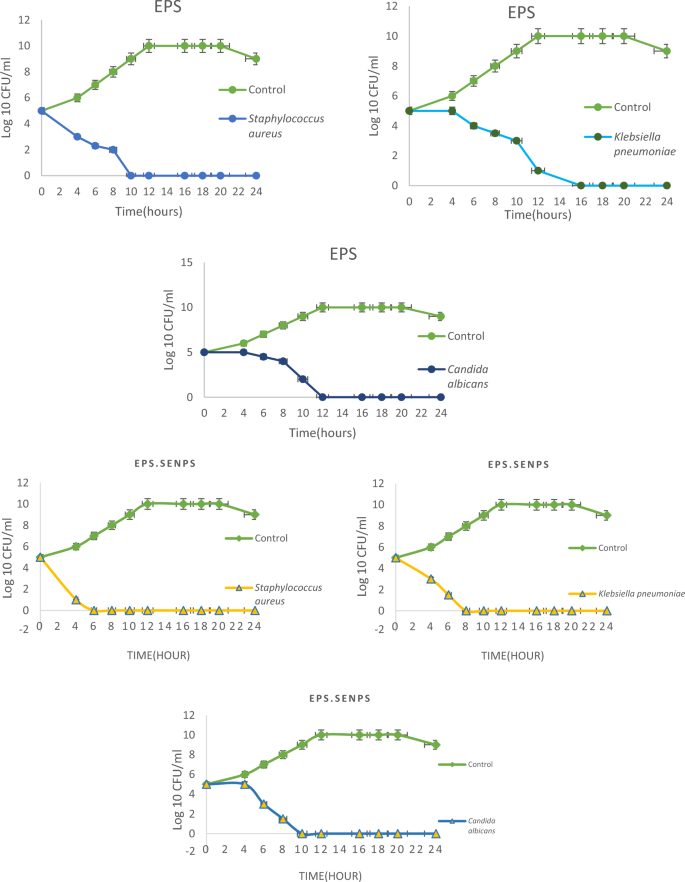
Time kill curve of the tested pathogens treated with EPS and EPS-SeNPs.
El-Deeb et al.61 reported that SeNPs exhibited antimicrobial effect against Staphylococcus aureus, MRSA and E. coli with inhibition zone diameter 29, 27 and 13 mm respectively. Moreover, Iqbal et al.38 declared that SeNPs showed antibacterial activity against Klebsiella pneumoniae, E. coli and Staphylococcus aureus with inhibition zone diameters 24, 23 and 22 mm respectively. According to Hashem and Salem37 SeNPs antimicrobial mechanism of action has four pathways: (1) metabolic invasion through disruption of intracellular adenosine triphosphate (ATP) levels, (2) fluctuation of intracellular reactive oxygen species (ROS) values, (3) depolarization, and (4) disruption of biological membranes.
Antioxidants, and cytotoxicity effects of EPS and EPS-SeNPs
Antioxidant properties
EPS and EPS-SeNPs showed concentration-dependent DPPH free radical scavenging effect at different concentrations ranged from 2.5 to 100 µg/mL (Table 8). The obtained data revealed that the highest antioxidant capacity was detected with Trolox (positive control) followed by EPS-SeNPs and EPS respectively. On the other hand, at 100 µg/mL, the DPPH free radical scavenging ability of the EPS-SeNPs reached 97.4% exceeding the EPS and the positive control percentage (93.1 and 92.9%, respectively) which verified the higher activity of the synthesized nanoparticles. The noticed EPS scavenging activity could be attributed to the presence of hydroxyl group, which can donate electrons to decrease the radicals concentration reaching a more stable state17. In accordance with Gunti et al.62 reported that the antioxidant activity of Phyto fabricated selenium nanoparticles (PF-SeNPs) was dependent on surface functional molecules and the size of nanoparticles occupied by secondary metabolites. PF-SeNPs also assisted in the protection of cells from free radicals by activating some selenoenzymes such as glutathione peroxidase.
Cytotoxic properties
To assess the safety of EPS and EPS-SeNPs, in vitro cytotoxicity against WI38 cells was investigated and compared to that of Staurosporine. In order to investigate the anti-lung cancer properties, cytotoxic IC50 was calculated against A549 cells. The effect of EPS and EPS-SeNPs against A549 and WI38 cell viability showed a dose-dependent decrease with the concentration ranging from 0.4 to 100 μg/mL (Fig. 14). The IC50 of EPS and EPS-SeNPs against A549 were 32.06 ± 1.57 and 5.324 ± 0.26 µg/mL, respectively, while the IC50 toward WI38 were 52.03 ± 2.29 and 15.83 ± 0.7 µg/mL, respectively (Table 9) which was in line with Tang et al.34 results. However, Staurosporine showed the highest therapeutic index with higher anti-lung cancer effect when compared to EPS-SeNPs. The efficacy of the synthesized EPS-SeNPs against cancer cells, A549, was higher than that of crude EPS, establishing the way for its usage as a therapeutic agent against lung carcinoma. The estimated therapeutic index showed that EPS-SeNPs were significantly safer and more effective against A549 cells than crude EPS. Tang et al.63 stated that arabinogalactans/selenium nanoparticles (LAG-SeNPs) showed the highest cytotoxic effect against A549 cells, followed by HepG-2 and MCF-7 cells. It was revealed that anti-cancer efficiency of SeNPs was improved via decoration with EPS, which improved the cellular absorption and permeability of selenium nanoparticles. Also, it’s worth mentioning that their efficiency was inversely correlated with their size4,10.
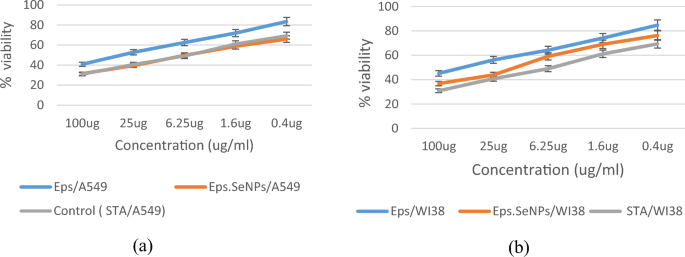
Effect of EPS, EPS-SeNPs and Staurosporine levels against Cell viability of A549 (a) and WI38 (b) respectively.
Effect of EPS and EPS-SeNPs on cellular reactive oxygen species (ROS)
Nowadays, many anticancer medicines present on the market cause tumor cell death by raising ROS levels. The green synthesis of SeNPs that induced the ROS levels in cancer cells seems to be promising therapy41. Results showed that EPS-SeNPs were more effective compared with EPS and control, Table 10 showed the ∆RFU, control% and relative fold-increase in ROS levels against A549 which reached 1.26, 1.13 and 1 respectively. It was reported that the overproduction of ROS has been linked to mitochondrial malfunction, including mitochondrial membrane potential (MMP) loss and activation of the mitochondrial apoptosis pathway41,62,64.
Real time RT–PCR
The relative change in the genetic expression of proapoptotic (Caspase-3 and BAX) and anti-apoptotic (Bcl2) genes
According to Nakamura and Takada64 excess ROS generation can damage the cellular proteins, nucleic acids, lipids, membranes, and organelles, which stimulates cell death processes, including apoptosis. Excessive mitochondrial ROS can cause intrinsic apoptosis, which activates caspase 9 expression. Caspase 9, a critical component in the intrinsic route, subsequently activates caspase 3, 6, and 7, resulting in cellular protein breakage and apoptosis. The mentioned pathways lead to inhibiting the anti-apoptotic activity of Bcl2’s and activate Bax. RT-PCR data (Table 11) revealed the proapoptotic potency of EPS and EPS-SeNPs for caspase 3 and Bax expressions. Caspase 3 expression reached 3.75 and 6.34 fold in EPS and EPS-SeNPs treated A549 cells, respectively. Furthermore, Bax expression was increased by 3.258 and 4.969 fold in EPS and EPS-SeNPs treated A549 cells, respectively, while Bcl2’s anti-apoptotic gene was decreased by 0.636 and 0.324 fold, respectively.
Cell cycle analysis assay
Apoptosis has been considered one of the most important mechanisms for anticancer activity65. Apoptosis is a process of planned cell death in multicellular organisms. Unlike necrosis, which is a kind of violent cell death triggered by acute cellular damage, apoptosis is a tightly regulated and controlled process that benefits the organism. Most cancer therapies essentially induce apoptosis in targeted cancer cells to cause cancer cells death63. SeNPs come in various forms, and each form has a unique anticancer mechanism. Therefore, flow cytometry was employed to investigate the anticancer mechanism of EPS and EPS-SeNPs against A549 cells. The results showed that apoptosis of A549 cells was remarkably induced after treatment with EPS and EPS-SeNPs. Compared with the control group, EPS-SeNPs showed higher total apoptosis and necrosis (42.31 and 7.55 respectively), than EPS (25.46 and 2.88 respectively) (Table 12 and Fig. 15). Inhibition of cell proliferation activity is associated with the blocking of the cell cycle. The A549 cell cycle distribution was investigated with EPS and EPS-SeNPs to determine whether cell cycle arrest was related to EPS and EPS-SeNPs proliferation inhibitory effect. Compared with the control group, EPS caused cell growth arrest at the G2/M phase, while EPS-SeNPs caused cell growth arrest in the S phase (Table 13). Jolly et al.,66 explained that SeNPs’ anticancer properties are attributed to selenium’s activation of glutathione S-transferase (GST) hence inhibiting cancer cell development by causing cell cycle arrest at the S phase. Through the process of endocytosis, cancer cells specifically take up SeNPs, that cause activating the signal transduction pathways associated with apoptosis, causing cancer cells death. Wu et al.67 indicated that A549 cells’ proliferation was considerably decreased by Polyporus rhinocerus water-soluble polysaccharides-protein complexes selenium nanoparticles (PRW-SeNPs) through the activation of apoptosis and G2/M phase arrest, DNA fragmentation, nuclear condensation and chromatin condensation were seen during the TUNEL-DAPI co-staining experiment, which further supported the activation of apoptosis. Ferro et al.68 demonstrated that SeNPs stabilized with 1,6-D-glucan have also shown anticancer activities against HeLa cells (a cervical cancer cell line), triggering apoptosis through the mitochondrial intrinsic route, decreasing the mitochondrial membrane potential and arresting cell division during the S phase.
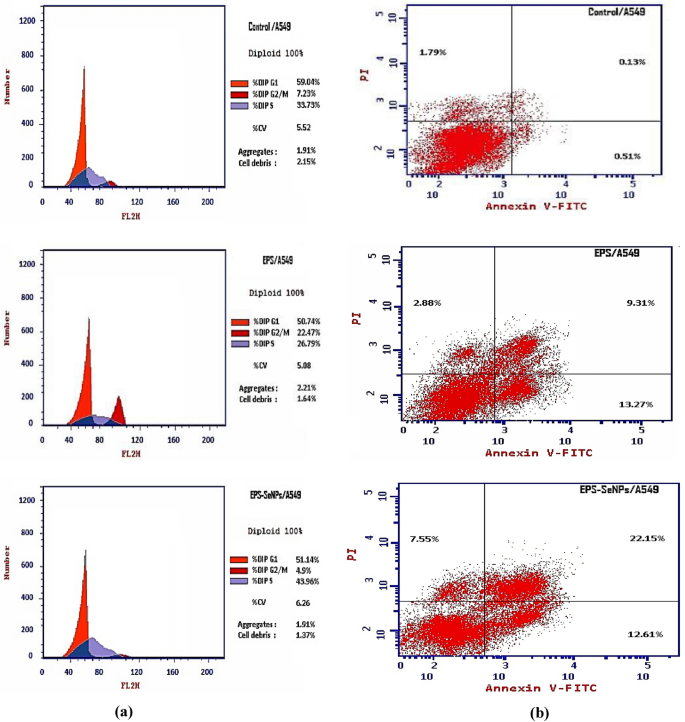
Flow cytometric profile of A549 cells for control, treated with EPS and EPS-SeNPs (a), Annexin V-FITC/PI double staining technique for quantitative study of apoptotic cells cytometry of A549 cells control, treated with EPS and EPS-SeNPs (b).
- SEO Powered Content & PR Distribution. Get Amplified Today.
- PlatoData.Network Vertical Generative Ai. Empower Yourself. Access Here.
- PlatoAiStream. Web3 Intelligence. Knowledge Amplified. Access Here.
- PlatoESG. Carbon, CleanTech, Energy, Environment, Solar, Waste Management. Access Here.
- PlatoHealth. Biotech and Clinical Trials Intelligence. Access Here.
- Source: https://www.nature.com/articles/s41598-023-48921-9