hPSC Culture
The hPSC lines utilized in this study were as follows: the human embryonic stem cell lines H1 (WiCell) and 2074 and the previously described human induced pluripotent stem cell (hiPSC) lines AG27 (reprogrammed using retrovirus (Vectalys) from AG05836B fibroblasts, obtained from Coriell Cell Repositories)5,6,7,8. hPSCs were maintained under feeder-free conditions on Geltrex (Life Technologies)-coated tissue culture plates using Essential 8 medium made in house as described previously8.
Culture of primary human hepatocytes
Human plateable hepatocytes (primary hepatocytes (PHs)) were purchased from Thermo Fisher Scientific and cultured in Williams’ Medium E (1x, no phenol red) (Thermo Fisher Scientific) following the manufacturer’s instructions.
Two-dimensional hepatocyte-like-cell differentiation
Cells were differentiated into hepatocyte-like cells (HLCs) in 2D as described previously5,6,8. Briefly, cells were initially seeded onto Geltrex-coated tissue culture plates as single cells after incubation with Accutase (Life Technologies). The optimal seeding density was previously established empirically as described in Mathapati et al.5. Differentiation to HLCs was a 3-stage process consisting of differentiation to definitive endoderm (DE—Phase I), hepatic specification to hepatoblasts/hepatic endoderm (HE—Phase II), and finally maturation to hepatocyte-like cells (HLCs—Phase III). For a detailed protocol of the differentiation process, please see Mathapati et al., 2016 and Siller et al.5,8.
Suspension culture and differentiation into liver organoids
For differentiation of hPSCs into organoids, cells were harvested by incubation with Accutase (Life Technologies) for 10 min at 37 °C until the cells had detached. The cells were pelleted by centrifugation at 300x g for 5 minutes at room temperature. After the cells were counted, they were seeded into 125 ml or 500 ml cell culture Erlenmeyer flasks (Corning) at a bulk cell density of 3.5-4 ml of media/million cells, (see9) in Essential 8 (Life Technologies) with 10 μM Y-27632 (BOC Sciences). The cells were allowed to self-organize into aggregates for up to 24 hours on an orbital shaker at 70 RPM in a humidified 37 °C, 5% CO2 incubator. The conditions for suspension culture (orbital shaker at 70 RPM in a humidified 37 °C, 5% CO2 incubator) were utilized for all steps of the differentiation. After aggregate formation, differentiation was initiated to drive pluripotent hPSC aggregates to primitive streak/mesendoderm (Day 1) and further patterned toward definitive endoderm (Day 2) (see Fig. 1A for a schematic overview of the differentiation). For differentiation, the hPSC aggregates were collected from the flask, transferred to a 50 ml conical tube and pelleted by centrifugation for 5 minutes at 300 x g at room temperature. After removal of the supernatant, the aggregates were resuspended in 3.5 ml/million cells of differentiation medium comprised of RPMI 1640 (Life Technologies) with B-27 either with or without insulin (RPMI/B-27 +/-) (Life Technologies) depending on the cell line and 3 or 4 μM CHIR99021 (BOC Sciences). Optimal conditions need to be established for each line based on our previously established protocol5,6,7,8. The aggregates were then transferred back to the Erlenmeyer flask and incubated for another 24 hours. After 24 hours, the aggregates were collected as described above, and the cell pellet was gently resuspended in the same volume of RPMI/B-27 +/-, without any small molecules, and transferred back to the Erlenmeyer flask. The aggregates were incubated for an additional 24 hours. On Day 2 of differentiation, the cells were directed toward hepatic endoderm (Day 7). The aggregates were collected as described above and resuspended at 3.5 ml/million cells in Knockout DMEM (Life Technologies), 20% (vol/vol) Knockout Serum Replacement (Life Technologies), 1% dimethyl sulfoxide (Sigma-Aldrich), nonessential amino acids (NEAA—Life Technologies), 2-mercaptoethanol (Life Technologies) and Glutamax (Life Technologies) and incubated for 5 days, with a medium change every 48 hours. On Day 7, the resulting organoids were switched to medium for maturation to liver organoids. The medium comprised Lebovitz L-15 base medium with 8.3% fetal bovine serum (FBS-Biowest), 8.3% Tryptose Phosphate Broth (Sigma-Aldrich), hydrocortisone (Sigma-Aldrich), ascorbic acid (Sigma-Aldrich), Glutamax (Life Technologies), 100 nM dexamethasone (Sigma-Aldrich), and 100 nM N-hexanoic-Tyr, Ile-6 aminohexanoic amide (Dihexa) (Active Peptide). The organoids were cultured from Day 7 to Day 20, with a medium exchange every 48 hours. Organoids were collected and analyzed or maintained in long-term culture as indicated.
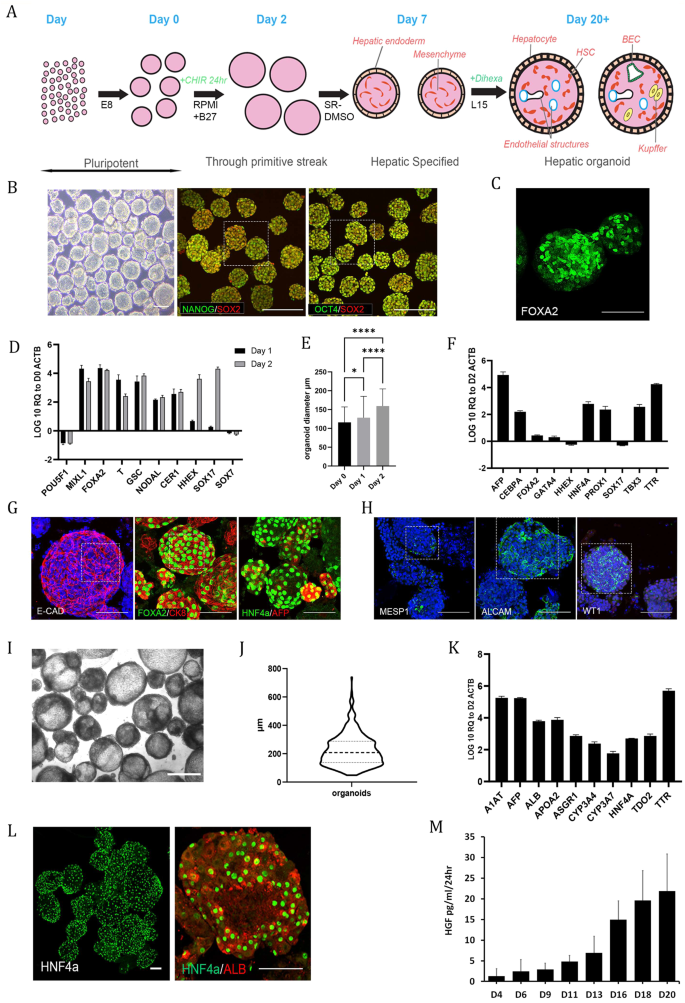
A Schematic overview of organoid differentiation from PSCs. B Representative images of Day 0 (D0) pluripotent spheroids, left panel brightfield. The remaining panels show whole-mount immunostaining of the pluripotency markers OCT4, SOX2 and NANOG; the scale bar is 200 µm. The highlighted area is magnified in Supplementary Fig. 9. C Whole-mount immunostaining of the definitive endoderm (DE) marker FOXA2 at D2 of differentiation. D RT‒qPCR analysis of pluripotency- and DE-associated genes at D1 and D2 of differentiation relative to D0 spheroids on a log10 scale. The results from three independent experiments are presented as the mean ± SD. E Graph showing the shift in size of organoids from D0 to D2. The size is expressed as the mean diameter (µm) with error bars showing the standard deviation, representing a total of 570 organoids. Day 0 vs. Day 1 p = 0.001, Day 0 vs. Day 2 p < 0.0001, Day 1 vs. Day 2 p < 0.0001 from Kruskal‒Wallis test with Dunn`s multiple comparisons test. F RT‒qPCR analysis of DE and early liver development genes at D7 of differentiation relative to D2 on a log10 scale. The results from three independent experiments are presented as the mean ± SD. G Whole-mount immunostaining of D7 organoids showing epithelial (ECAD) and early hepatocyte markers (FOXA2, CK8, HNF4α, AFP) on the outer surface of the organoids. The highlighted area is magnified in Supplementary Fig. 9. H Whole-mount immunostaining of D7 organoids showing heterogeneous expression of mesoderm (MESP1)- and mesenchymal (ALCAM, WT1)-associated markers. The highlighted area is magnified in Supplementary Fig. 9. I Brightfield image of D20 organoids. Scale bar is 500 µm. J Violin plot of D20-D27 organoid diameter from three representative experiments. The solid line represents the mean, while the dotted lines represent the quartiles. K RT‒qPCR analysis of both early and later (developmentally) hepatocyte genes at D20 of differentiation relative to D2 on a log10 scale. The results from three independent experiments are presented as the mean ± SD. L Whole-mount immunostaining of D20 organoids showing expression of the hepatocyte markers HNF4α and albumin on the outer surface of the organoids. M Demonstration of increasing secretion of HGF into the culture medium by the organoids throughout differentiation as measured by ELISAs. The results from three independent experiments are presented as the mean ± SD. All of the above experiments were performed with the hiPSC line AG27. All scale bars are 100 µm unless stated otherwise.
Fixation of organoids
For transmission electron microscopy (TEM), the organoids were fixed in 1% glutaraldehyde/1% paraformaldehyde (PFA) in 0.12 M phosphate buffer and 0.02 mM CaCl2 (pH 7.2–7.5; Sigma) for 4 hours at room temperature, washed in 8% glucose (in 0.12 M phosphate buffer and 0.02 mM CaCl2, pH 7.2–7.5) and postfixed in 2% OsO4 (in 0.12 M phosphate buffer and 0.02 mM CaCl2, pH 7.4; Sigma) for 90 minutes at room temperature. For histology and immunohistochemical detection, the organoids were briefly rinsed in 0.1 M Sörensen buffer (pH 7.4) and immersed in 3% PFA and 0.05% glutaraldehyde in 0.1 M Sörensen buffer (pH 7.4) for 2 hours at room temperature followed by 30 minutes at 4 °C. After a thorough washing in 0.1 M Sörensen buffer (pH 7.4), the organoids were dehydrated and embedded in paraffin. Serial sections (6 µm thick) were cut from paraffin blocks using a microtome, and every tenth slide was stained with hematoxylin-eosin for histological examination.
Immunostaining of organoids
Immunohistochemical detection of cytokeratin 18 (CK18) and cytokeratin 19 (CK19) was performed by an indirect two-step method in paraffin-embedded sections. After deparaffinization and rehydration of sections, antigen retrieval was performed in HistoStation (Milestone, Sorisole, Italy). Endogenous peroxidase was blocked in 5% H2O2 (3 × 10 min), and then, sections were incubated with primary mouse anticytokeratin 18, clone DC10 (DAKO, Glostrup, Denmark; 1:25) or primary mouse anti-cytokeratin 19, clone BA17 (DAKO, Glostrup, Denmark; 1:50) antibody for 1 h at room temperature. After PBS washes, the sections were exposed to antimouse DAKO EnVision+ System-HRP Labeled Polymer (DAKO, Glostrup, Denmark) for 35 min at room temperature. Then, the reaction was developed with 3,3-diaminobenzidine tetrahydrochloride (Sigma-Aldrich). Sections were dehydrated, counterstained with hematoxylin and mounted in DPX (Sigma-Aldrich). Tissue sections were examined with an Olympus BX51 microscope equipped with a DP71 camera.
For whole-mount immunofluorescence and confocal imaging, organoids were fixed in 4% PFA for 60 minutes, pelleted (300x g for 5 min, low deceleration) and washed in PBS for 20 min, which was repeated three times. Fixed samples were stored in PBS at 4 °C until needed. Ten microliters of sphere sediment was pipetted onto a coverslip and briefly air-dried, followed by centrifugation at 1000x g for 5 min. The fixed organoids were blocked for 1 h in PBS with 0.1% Triton X-100 (Sigma-Aldrich) x 100 (PBS- Triton X-100) and 10% goat serum (Life Technologies). The primary antibody was then diluted at the appropriate dilution in PBS- Triton X-100 containing 1% goat serum and incubated overnight at 4 °C. The primary antibody was removed, and the sample was washed 3 × 20 min in PBS-Triton X-100. All Alexa Fluor secondary antibodies (Life Technologies) were diluted 1:1500 with PBS-Triton X-100, added to the samples for 4 h at 4 °C in the dark and subsequently washed 3 times for 20 min in PBS-Triton X-100. For dual labeling of the samples, the above steps (block, primary, secondary) were repeated. Nuclei were counterstained with DRAQ5 at 1:1500 in PBS for a minimum of 15 min before imaging. A full list of antibodies used are available in Supplementary Table 2.
Microscopy
Phase-contrast images were obtained using an Axio Primovert upright light microscope (Zeiss). Images were captured using Zen Software (Zeiss). All scale bars represent 100 μm unless otherwise stated in the figure legends. Confocal images were obtained using Olympus FV1000 and Andor Dragonfly microscopes, and images were captured using Olympus Fluoview and Fusion, respectively, and compiled using ImageJ software.
Spinning disk confocal microscopy
For clear organoid visualization, we used the ultrafast confocal system IXplore SpinSR Olympus (Olympus, Tokyo, Japan). We utilized our previously published imaging settings10. The imaging system consists of the following units: an inverted microscope (IX83; Olympus, Tokyo, Japan) and a spinning disc confocal unit (CSUW1-T2S SD; Yokogawa, Musashino, Japan). Fluorescence data for image reconstruction were collected via either a 100 x silicone immersion objective (UPLSAPO100XS NA 1.35 WD 0.2 silicone lens, Olympus, Tokyo, Japan) or a 20 x objective (LUCPLFLN20XPH NA 0.45 air lens, Olympus, Tokyo, Japan). The following lasers were used to excite fluorophores: 405 nm laser diode (50 mW) and 488 nm laser diode (100 mW). Confocal images were acquired at a 2048 × 2048-pixel resolution. Optical sections were acquired at 1.5 μm and 250 nm intervals along the z-axis for 3D reconstruction of 20x and 100x objectives, respectively. The fluorescent images were collected by appropriate emission filters (BA420-460; BA510-550; Olympus, Tokyo, Japan) and captured concurrently by two digital CMOS ORCA-Flash4.0 V3 cameras (Hamamatsu, Hamamatsu City, Japan). Fluorescence confocal images were acquired using cellSens software (Olympus, Tokyo, Japan). Icy open source software was used for image processing and 3D reconstruction11.
Cryosectioning
PFA-fixed organoids were transferred to a cryomold, embedded in OCT compound (Thermo Fisher Scientific) and cooled to −80 °C in a bath of isopropanol on dry ice. The cryo-embedded organoids were then sectioned at 50 μm on a cryotome and transferred to slides. Slides were stored at −80 °C until immunostaining and imaging as described above.
Transmission electron microscopy
The fixed organoids (described above) were rinsed and incubated overnight in 10% sucrose (in water) at 4 °C, and the organoids were dehydrated in graded alcohols (50%, 75%, 96%, 100%), cleared in propylene oxide and embedded in a mixture of Epon 812 and Durcupan (Sigma; polymerization for 3 days at 60 °C). First, semithin sections were cut on an Ultrotome Nova (LKB, Sweden) and stained with toluidine blue. Subsequently, ultrathin sections were cut on the same ultramicrotome, collected onto formvar carbon-coated copper grids, counterstained with uranyl acetate and lead citrate and examined under a JEOL JEM-1400Plus transmission electron microscope (at 120 kV, JEOL, Japan).
LSEC functionality testing
Day 21 organoids were transferred to a 6-well suspension plate at 3 ml/well. In separate wells, either Alexa Fluor™ 488 AcLDL (Thermo Fisher, L23380) or FITC-FSA (Gift from Karen Sørensen), both at 2 µg/ml, was added to the culture medium. The samples were incubated at 37 °C for both 15 and 75 minutes before being washed twice in culture medium and fixed as described previously. Organoids were then immunostained with endothelial markers as described above.
RNA
Two methods were employed to isolate RNA. (i) Cells were collected for RNA isolation from 2D controls by washing the cells once with DPBS−/−, followed by scraping the cells into DPBS−/−. The resulting cell suspension was pelleted by centrifugation at 300x g for 1 minute at room temperature. The supernatant was carefully removed, and TRIzol (Life Technologies) was added to lyse the cells. For organoids, RNA isolation was performed by removing 2 ml of suspension culture medium from the Erlenmeyer flasks and collecting the organoids by centrifugation at 300x g for 5 min at room temperature. The supernatant was carefully removed, and organoids were washed with 5 ml of DPBS−/− and repelleted. DPBS−/− was gently removed, and TRIzol was added to lyse the organoids. TRIzol samples were then either processed immediately for RNA isolation according to the manufacturer’s instructions or stored at −80 °C for subsequent processing. RNA was quantified using a NanoDrop ND-1000 Spectrophotometer (NanoDrop). For vitamin K-dependent enzyme analysis, total RNA was isolated using the MagMAX™-96 Total RNA Isolation Kit on a MagMAX™ Express-96 Deep Well Magnetic Particle Processor as described by the manufacturer (both from Thermo Fisher Scientific, Waltham, MA, USA).
cDNA synthesis
Five hundred nanograms of RNA was used as a template for reverse transcription to cDNA. cDNA synthesis was performed using the High-Capacity Reverse Transcriptase Kit (Life Technologies) with random primers, following the manufacturer’s instructions for reactions without RNase inhibitor.
Gene expression analysis with RT‒qPCR
Gene expression was analyzed via reverse transcriptase quantitative polymerase chain reaction (RT‒qPCR) using TaqMan probes (Life Technologies) or SSO Universal Probes Master Mix (Bio-Rad). For a complete list of probes used in this study, please see Supplementary Table 2. All samples were analyzed in triplicate. Data are presented as the average of three independent experiments +/- the standard deviation.
CYP450 activity and induction
Analysis of cytochrome P450 (CYP) basal activity and inducibility was performed as previously described with several modifications for organoid cultures6. Briefly, 2D HLCs and organoids were induced from Day 20 onward of differentiation with prototypical CYP450 inducers: for CYP3A4, we cultured cells with 25 μM rifampicin and 100 μM omeprazole for CYP1A2 (Sigma-Aldrich). Prior to starting the inductions, the cells/organoids were washed with DPBS−/− 4 times to remove hydrocortisone and dexamethasone. After washing, the inducers were added to L-15 medium as described above, minus hydrocortisone and dexamethasone. The induction medium was refreshed every 24 h for 3 days. Seventy-two hours postinduction, the cells were assayed for CYP1A2 and CYP3A4 activity using the P450-Glo CYP3A4 (Luciferin-PFBE) Cell-based/Biochemical Assay kit (Promega, Cat. no. V8902) and the P450-Glo CYP1A2 Induction/Inhibition Assay kit (Promega, Cat. no. V8422) according to the manufacturer’s instructions. Data were normalized to 1 million hepatocytes and are presented as the average of three independent experiments +/- the standard deviation.
Heroin metabolism
After 21 days of differentiation, 50 organoids per well were loaded in triplicate into a 96-well plate and treated with culture media with 10 µM heroin for 1, 3, 6, and 24 hours. For controls, we used culture media without organoids; these samples were assessed in parallel to measure heroin degradation throughout the experiment. To stop metabolism at each time point, we transferred the samples to a new 96-well plate prefilled with formic acid (final conc. 0.1 M) along with internal standards. The samples were centrifuged for 10 min at 1000x g at 4 °C. The supernatants were transferred to autosampler vials and analyzed for heroin, morphine, and morphine-3β-D-glucuronide (M3G) using an Acquity UPLC system (Waters, Milford, MA) coupled to a Xevo-TQS triple quadrupole mass spectrometer with an electrospray ionization interface (Waters) based on a method previously described12. Data acquisition, peak integration, and quantification of samples were performed using MassLynx 4.0 SCN509 software (Waters Corp., Milford, MA, USA).
Coagulation factor studies
For coagulation studies, hepatic organoids were cultured in L15 medium with Vit K (Konakion Roche) 5 µg/ml for at least 48 h before harvesting.
FVII activity
Factor VII (FVII) activity in the cell medium was determined using the Human FVII Chromogenic Activity Kit (Nordic BioSite AB, Täby, Sweden) according to the manufacturer’s instructions. Primary hepatocytes (Thermo Fisher Scientific) were used as controls. The functional activity of FVII from supernatants of iPSC-HO was assessed by two methods: a) western blotting after activation with tissue factor (TF, STA Neoplastin) and CaCl2 and incubation with antithrombin (AT), purified from human plasma, (Grifols®, Spain) and unfractionated heparin (Hospira®) to measure the ability of FVII to become active and form a complex with AT; and b) thrombin generation (CAT, Stago®, Valencia, Spain) of supernatants derived from organoids with and without FVII-depleted plasma. Briefly, 40 µl of organoid supernatants was added to 40 µl of FVII-depleted plasma and activated with 5 pM TF. Fluorescence measurements started just after the addition of Fluka® reagent diluted in a commercial buffer containing calcium. As controls, we used only 80 µl of FVII-depleted plasma and 40 µl of serum-free medium (SFM L15) with 40 µl of FVII-depleted plasma, with activation by 5 pM TF. Fluorescence measurements were recorded for 60 min in a fluorimeter (Stago ®, Valencia, Spain).
Western blot analysis of FII, AT, A1AT and FVII
Intracellular levels of FII were determined by western blots (WBs). Briefly, hepatic organoids were lysed in T-PERTM buffer (Thermo Fisher Scientific), and lysates were collected by centrifugation at 8000x g for 10 min. Equal amounts of proteins from lysates were separated by SDS‒PAGE using Mini-PROTEAN® TGX™ 10% Precast Gels (Bio-Rad, Hercules, CA, USA) before transfer onto a Sequi-Blot PVDF membrane (Bio-Rad) using the Mini Trans-Blot Electrophoretic Transfer Cell system (Bio-Rad). The membranes were incubated overnight at 4 °C with the primary antibody anti-FII (Novus Biologicals, Centennial, CO, USA) or beta-actin (Sigma-Aldrich, Saint Louis, MO, USA). The membranes were washed and then incubated with the appropriate horseradish peroxidase (HRP)-conjugated secondary antibody (Santa Cruz Biotechnology, Dallas, TX, USA) for 1 h at room temperature. The blots were developed using Radiance Plus chemiluminescent substrate (Azure Biosystems, Dublin, CA, USA), and the signals were quantified using the ImageQuant LAS-4000 mini-Imager (GE Healthcare, Chicago, IL, USA). Primary hepatocytes were used as controls.
AT, alpha-1-antitrypsin (A1AT) and FVII were evaluated by western blots on 8% polyacrylamide gel electrophoresis performed under 10% SDS denaturing conditions in the presence 0.05 M reducing agent. AT, A1AT and FVII were immunostained with rabbit anti-human AT (A9522, Sigma-Aldrich), anti-human A1AT (Dako Diagnostics, Denmark) and anti-human FVII (AF2338, R&D) polyclonal antibodies, respectively.
Evaluation of N-glycosylation of secreted proteins
N-glycosylation was evaluated by comparative WBs under basal conditions and after digestion with neuraminidase (α(2 → 3, 6, 8, 9)) from Arthrobacter ureafaciens, Sigma-Aldrich), following the manufacturer’s instructions, and with N-glycosylase F (PNGase F, Sigma-Aldrich, Madrid, Spain). Cell supernatants (up to 200 µg of glycoprotein in a volume of 35 µl) were denatured with 10 µl of 250 mM phosphate buffer and 2.5 µl of 2% SDS with 1 M 2-mercaptoethanol, heated at 100 °C for 5 minutes and cooled. Triton X-100 (2.5 µl of 15%) (v/v) was added. Then, 2.0 µl of PNGase F (≥5000 units/ml) was added and incubated overnight at 37 °C. Samples were run in SDS‒PAGE and detected as described above.
Serum protein analysis via ELISA
ELISAs for human albumin (Bethyl Laboratories, Inc.), human A1AT (Abcam cat# ab108799) and hepatocyte growth factor (Antibodies-online) were used as described by the supplier. Colorimetric readings were taken at the specified wavelength on a SPECTRAmax PLUS 384. Values were derived from standards using appropriate lines of best fit generated on Softmax pro software. For clotting factors, organoids were collected by centrifugation for 10 minutes at 300x g, and the cell medium was collected. Hepatic organoids were lysed in T-PERTM buffer (Thermo Fisher) containing Halt protease and phosphatase inhibitor cocktail 1X (Thermo Fisher). FVII and FX antigens (FVIIAg and FXAg) were measured in the cell medium using an FVII ELISA kit and FX ELISA kit (Abcam), respectively. FII, AT, Protein C, and Protein S were measured using Procarta-plex coagulation 6 plex panel 1 and coagulation 4 plex panel 3 (Thermo Fisher Scientific). Primary hepatocytes were used as controls. The FVIIAg and FXAg levels (ng/ml) were normalized to 1 × 10⁶ cells, and the ratio of organoid/primary hepatocytes was calculated.
Oleic acid accumulation assay
Oleic acid (1 M, Sigma-Aldrich) was diluted with NaOH (Sigma-Aldrich) and heated at 70 °C for 30 minutes to form a 20 mM sodium oleate solution. This solution was then diluted with a 5% BSA/PBS solution at 37 °C to form a 5 mM sodium oleate/BSA complex. This solution was further diluted to 300 μM in culture media and incubated with organoids for 5 days, changing the media each day. After fatty acid treatment, the organoids were incubated with 3.8 μM BODIPY 493/503 (Life Technologies) for 30 min in culture medium at 37 °C and then washed two times with PBS before being replaced with fresh culture medium containing DRAQ5 (Thermo Fisher) at 1:1500. Organoids were then imaged on a confocal microscope as described above.
Sample preparation, processing and data processing of proteomics data
Patient liver samples
Five patient samples were collected from liver explants from patients undergoing LTX at Oslo University Hospital. The samples were stored in liquid nitrogen. The regional ethics committee approved the use of the patient material (REK 2012-286) in accordance with the Declaration of Helsinki. All participants provided written informed consent.
Samples were processed as follows: the proteins were precipitated with acetone/TCA (Sigma-Aldrich). The pellets were resuspended in 8 M urea in 50 mM NH4HCO3, and the proteins were reduced, alkylated and digested into peptides with trypsin (Promega). The resulting peptides were desalted and concentrated before mass spectrometry by the STAGE-TIP method using a C18 resin disk (3 M Empore). Each peptide mixture was analyzed by a nEASY-LC coupled to QExactive Plus (ThermoElectron, Bremen, Germany) with an EASY Spray PepMap®RSLC column (C18, 2 µl, 100 Å, 75 µm x 25 cm) using a 120-minute LC separation gradient.
The resulting MS raw files were submitted to MaxQuant software version 1.6.1.0 for protein identification. Carbamidomethyl (C) was set as a fixed modification, and acetyl (protein N-term), carbamyl (N-term) and oxidation (M) were set as variable modifications. A first search peptide tolerance of 20 ppm and a main search error of 4.5 ppm were used. Trypsin without the proline restriction enzyme option was used, with two allowed miscleavages. The minimal unique+razor peptide number was set to 1, and the allowed FDR was 0.01 (1%) for peptide and protein identification. The UniProt database with ‘human’ entries (October 2017) was used for the database searches.
Proteins with log2(intensity) > 10 average intensity value were defined as “expressed proteins”. The Pearson correlation coefficient between the liver and organoid was calculated from log2(intensity) with the cor.test function in R. Differential expression of proteins between the liver and organoid was defined as a more than 2-fold change and p < 0.05 by a two-sided T test. Gene Ontology analysis was conducted with the GOstats Bioconductor package13. Multiple test correction was performed by the Benjamin-Hochberg method with the p.adjust function in R.
Library preparation and scRNAseq data processing
scRNA-seq libraries were prepared from the liver organoids at Day 48 with Chromium Single Cell 3’ Reagent Kits (version 2-10x Genomics) as described previously14. Conversion to fastq format, mapping/UMI counting in human genome (hg19) and data aggregation were implemented by mkfastq, count and aggr functions with default parameters in CellRanger software (v2.1.0). Subsequent data processing, such as batch effect normalization, was performed by Seurat software (v3.1.0)15. In each replicate, the feature UMI count was normalized to the total count and multiplied by 10,000. The top 2,000 highly variable features (HVFs) were then identified by variance stabilizing transformation. Anchor cells across different scRNAseq libraries were identified with HVFs under 20-dimensional spaces from canonical correlation analysis and used for the transformation of multiple scRNAseq datasets into a shared space. Gene expression values were scaled for each gene across all integrated cells and used for principal component analysis (PCA). Twenty PCs were further assigned into two-dimensional space using uniform manifold approximation and projection (UMAP) and used to identify cell clusters. Differentially expressed genes in each cluster were identified with a more than 1.25-fold change and p < 0.05 by two-sided T test. Overrepresented GO terms were identified by GOstats (v2.24.0)13. Multiple test correction was performed by the Benjamin-Hochberg method with the p.adjust function in R.
The cluster labels were assigned by cell type-specific markers and GO terms (Supplementary Fig. 2c, e). Nine out of 22 clusters were first separated by the overrepresentation of “extracellular matrix (GO:0031012)”, which is a feature of stellate and endothelial cells. Active (ASTs) and resting stellate cells (RSTs) were defined by genes involved in “mitotic nuclear division (GO:0140014)” and its markers (MGP and ELN). Non stellate clusters were labeled endothelial cells (ECs) and further divided into liver sinusoidal endothelial cells (LSECs) and macrovascular endothelial cells (MVECs) by the absence and presence of vasculogenesis markers (KDR and HAND1)16. Seven of 13 other clusters were assigned hepatocyte (HEP), cholangiocyte (CHO), Kupffer cell (KPC) and Kupffer precursors (KPP) using the enrichment of GO terms “Cholesterol homeostasis (GO:0042632)”, “Keratinization (GO:0031424)”, “Phagocytosis (GO:0006909)” and “Hematopoietic stem cell differentiation (GO:0060218)”, respectively. Five clusters were assigned as peripheral nervous system with the expression of neuronal lineage markers (SOX2 and PAX6) and further divided into neuron (Neu), glia (Glia), neuro progenitor (NPC) and cilia-bearing cell (CBC) with “axon development (GO:0061564)”, “glial cell development (GO:0010001)”, “mitotic nuclear division (GO:0140014)” and “cilium assembly (GO:0060271)”, respectively14. We could not identify any unique marker or relevant GO terms in one cluster and labeled it unknown (UN). The cluster labeling strategy is schematically represented in Supplementary Fig. 2b.
Public transcriptome profiles were downloaded from the NCBI Gene Expression Omnibus database. The single-cell transcriptome of the liver organoid from Ouchi et al. (GSE130073)3 and the human liver atlas (GSE124395)17 were merged with our scRNAseq data and plotted into the shared UMAP space by Seurat as described above. Clusters, which are mainly composed of CD45+ cells and unique to the human liver atlas, were labeled as “other immune cells”. Genes were sorted by the difference in the average expression of all cells between our and Ouchi et al. liver organoids and used for GSEA (v2.2.2) of REACTOME genes without collapsing the gene set18. Cell-type-specific gene signatures were constructed from bulk RNA-seq in primary hepatocytes (GSE98710, GSE112330 and GSE135619)19,20, biliary tree stem cells (GSE73114)21, stellate cells (GSE119606)22 and endothelial cells (GSE114607)23. The RNA-seq reads were aligned to the hg19 human genome by TopHat (v2.2.1) with default parameters24. The mapped reads were counted in each gene by HTSeq software (v0.9.0) with options “-s no -f bam”25.
The factors of technical variations across multiple transcriptome datasets were minimized by the RUVs function in RUVSeq (v1.8.0)26. Subsequently, differentially expressed genes in each cell type were identified by DESeq2 (v1.14.1). For evaluation of the enrichment of the cell-type specific genes, genes were sorted in individual cells by relative expression level to average of all cells and used for GSEAPY software (v0.9.3) with options “–max-size 50000 –min-size 0 -n 1000”. Hepatic zone-specific genes were obtained from transcriptome profiles of hepatocytes from laser-microdissected human livers (GSE105127)27. After processing the bulk RNA-seq, the zone-specific genes were defined with a more than 1.5-fold change and p < 0.05 by a two-sided T test. The enrichment was evaluated by GSEAPY software with preranked genes in individual cells relative to all cells in all hepatocyte clusters.
For investigation of the transcriptional bias between LSECs and MVEC, cells from EC clusters were ordered in pseudotemporal spaces by Monocle (v2.99.3). Briefly, the Monocle object was first constructed from the UMI count matrix for cells in EC clusters and preprocessed according to the instructions. We then replaced data in “normalized_data_projection” and “reducedDimW” with nontransposed and transposed PCA dimensional matrices. In addition, the “reducedDimS”, “reducedDimA” and “reducedDimK” slots were replaced with the transposed UMAP dimensional matrix. The principal graph was learned by the learnGraph function with “RGE_method = ‘DDRTree’, close_loop=T, prune_graph=F, euclidean_distance_ratio=5”. Subsequently, cells were ordered according to the trajectory by the orderCells function using MVEC1 as a root cluster. Differentially expressed genes were identified by the differential GeneTest function with the model “~sm.ns(Pseudotime)”. Finally, genes with q < 1e-50 were selected as EC ordering-dependent genes and used for GO analysis by GOstats as described above.
Animal work
Male and female NOD. Cg-Prkdcscid Il2rgtm1Wjl/SzJ (NOD scid gamma, NSG) mice (purchased from The Jackson Laboratory, Bar Harbor, ME, USA) were housed in a Minimal Disease Unit at the animal facility at Oslo University Hospital Rikshospitalet, Oslo, Norway, with a 12-hour light–dark cycle and ad libitum access to water and standard rodent diet. All experiments were performed with co-housed age-matched mice. Mice undergoing surgery were not fasted and were 15 weeks of age at the time of surgery. All animals received human care, and the animal experiments were approved by the Norwegian National Animal Research Authority (project license no FOTS 19470) and performed according to the European Directive 2010/63/EU, the Animal Research: Reporting of In Vivo Experiments guidelines and The Guide for the Care and Use of Laboratory Animals, 8th edition (NRC 2011, National Academic Press).
Implantation of human liver organoids under the rodent kidney capsule
Male and female immunodeficient NSG mice were used in this study. The transplantation of the organoids under the kidney capsule or the sham laparotomy was performed as described in28 with some modifications. In brief, the procedure was performed using proper multimodal analgesia with s.c. administration of local analgesia (Marcain, 0.07 ml/10 g BW) in combination with s.c. administration of buprenorfin (0.1 mg/kg) before surgery and general anesthesia with i.p. injection with FD2 (fentanyl/domitor/dormicum) and Antisedan (antagonist) post-surgery. Following a sterile preparation of the left flank, a 1.5 cm incision was made midway between the last rib and the iliac crest and approximately 0.5 cm parallel and ventral to the spine28,29. The left kidney was slowly externalized through the abdominal incision using sterile cotton swabs, immobilized using nontraumatic forceps and moisturized with warm sterile saline. The injection site was located at the upper lateral side of the kidney, and a 1 ml syringe with a 25 G needle containing either the organoid suspension or pure Matrigel (Thermo Fisher Scientific) (sham surgery) was gently pushed under the capsule toward the inferior pole of the kidney to avoid perforation and damage to the blood vessels. Fifty to eighty microliters of organoid suspension or Matrigel matrix was very slowly discharged under the kidney capsule, and the needle was simultaneously slowly pulled out of the capsule to avoid backflow. Next, the kidney was returned to the body cavity, the abdominal wall was closed with sutures, and the skin incision was closed with 7 mm wound clips. After surgery, the mice were examined daily the first week for normal wound healing, with weight measurements and general well-being, thereafter once a week. Once every week, blood was sampled from the saphena vein for serum marker measurement.
Statistical analysis
Data are reported as the mean and standard deviation (if normally distributed) or as the median and interquartile range. Comparisons of two groups were performed using unpaired Student’s t test or Mann‒Whitney U test. For comparisons with more than two groups, Kruskal‒Wallis with Dunn`s multiple comparisons test was applied. Statistical analyses were performed with Graph Pad Prism 9.4.1 for Windows (GraphPad Software, Inc., San Diego, California).
- SEO Powered Content & PR Distribution. Get Amplified Today.
- PlatoData.Network Vertical Generative Ai. Empower Yourself. Access Here.
- PlatoAiStream. Web3 Intelligence. Knowledge Amplified. Access Here.
- PlatoESG. Automotive / EVs, Carbon, CleanTech, Energy, Environment, Solar, Waste Management. Access Here.
- PlatoHealth. Biotech and Clinical Trials Intelligence. Access Here.
- ChartPrime. Elevate your Trading Game with ChartPrime. Access Here.
- BlockOffsets. Modernizing Environmental Offset Ownership. Access Here.
- Source: https://www.nature.com/articles/s12276-023-01074-1