Anatomic definition and signaling potential of antrum and corpus mesenchyme
Foveolar cells are present in both gastric regions; their fraction is larger in the antrum, where pits (foveolae, outlined by staining with the lectin UEAI or with laminin antibodies) are wider and deeper in relation to the whole gland than those in the corpus (Supplementary Fig. 1b, c). In both regions, whole-mount confocal imaging revealed blood vessels and smooth muscle fibers packed tightly in the limited space between individual glands (Fig. 1b). Corpus arterioles branch along the full gland length to extend a deep capillary network, while antral arterioles have a larger bore and extend capillaries mainly at gland tops, with little branching along the gland length (Fig. 1c and Supplementary Fig. 1d, e, Supplementary Movies 1 and 2). Slender smooth muscle fibers extend lateral branches near the foveolar base, so the resulting fine network of lamina propria myocytes is taller and wider in the antrum (Fig. 1c and Supplementary Movies 3 and 4).
Pdgfra-expressing mesenchymal cells are pivotal in intestinal epithelial homeostasis33. In PdgfraH2BeGFP knock-in mice38,39, we detected cells with high and low levels of nuclear GFP (Fig. 1d and Supplementary Fig. 1e–g). Antral PDGFRAHi cells aggregate around the pit, where they extend beyond the basement membrane into the lamina propria (Supplementary Fig. 1e, f), while corpus PDGFRAHi cells distribute uniformly along corpus glands (Supplementary Fig. 1g). PDGFRALo cells distribute uniformly along the antral gland length but their density is modestly lower near the corpus isthmus and neck; in both gastric regions, PDGFRALo cells also concentrate below the gland base, occupying a substantially larger space in the corpus than in the antrum (Fig. 1d and Supplementary Fig. 1g). To further assess cell morphology, we crossed Rosa26mT/mG reporter40 and PdgfraCre(ER-T2) knock-in mice41, thus producing mice where baseline red fluorescence (Tomato) in all cell membranes turns green (GFP) in cells with Cre enzyme activity (Supplementary Fig. 2a). Tamoxifen did not induce structural changes that indicate tissue toxicity (Supplementary Fig. 2a). Cells embedded in the basal lamina, corresponding to PDGFRAHi, engulf glands within their intercalated cytoplasmic projections and cells corresponding to PDGFRALo are present beneath glands (Fig. 1e and Supplementary Movies 5 and 6). In summary, PDGFRA+ cells are present throughout the glandular stomach and their different arrangements in the corpus and antrum (Fig. 1f) likely reflect distinct influences on overlying gastric epithelia.
SI crypts form organoid structures in Matrigel supplemented with EGF, Noggin (a BMPi), and RSPO1, a Wnt potentiating agent (ENR medium)42. As Lgr5+ stem cells in the antral gland base resemble those in SI crypt bottoms, the original conditions to culture antral glands were adapted from an SI foundation and include additional requirements for Wnt3a and gastrin (ENRWG)3. Selected intestinal PDGFRALo cells, which express BMP inhibitor (BMPi) and RSPO genes, induce intestinal crypts to form spheroids in vitro in the absence of any supplemental factors33. PDGFRALo cells isolated by flow cytometry from either gastric segment (Supplementary Fig. 3a) failed to expand intestinal crypts in vitro, revealing a functional distinction from their intestinal counterparts (Fig. 2a). In contrast, corpus and antral glands readily formed spheroid structures in the absence of recombinant (r) factors when co-cultured with PDGFRALo cells isolated from the SI or from the corresponding gastric region (Fig. 2b) but not when co-cultured with gastric stromal PDGFRAneg or CD31+ endothelial cells (Supplementary Fig. 3b). Spheroids arising from corpus glands were consistently smaller and fewer than those from antral glands but expressed corpus-specific (chief and parietal cell) markers, while antral spheroids expressed higher levels of Wnt target genes Axin2 and Cd44 (Supplementary Fig. 3c). These structures thus reflect region-specific cell differentiation, different degrees of corpus and antral progenitor cell expansion, and discernible effects from mesenchymal cell co-cultures. Because isolated gastric PDGFRAneg cells showed negligible activity in the assay, we focused on characterizing PDGFRA+ cells further.
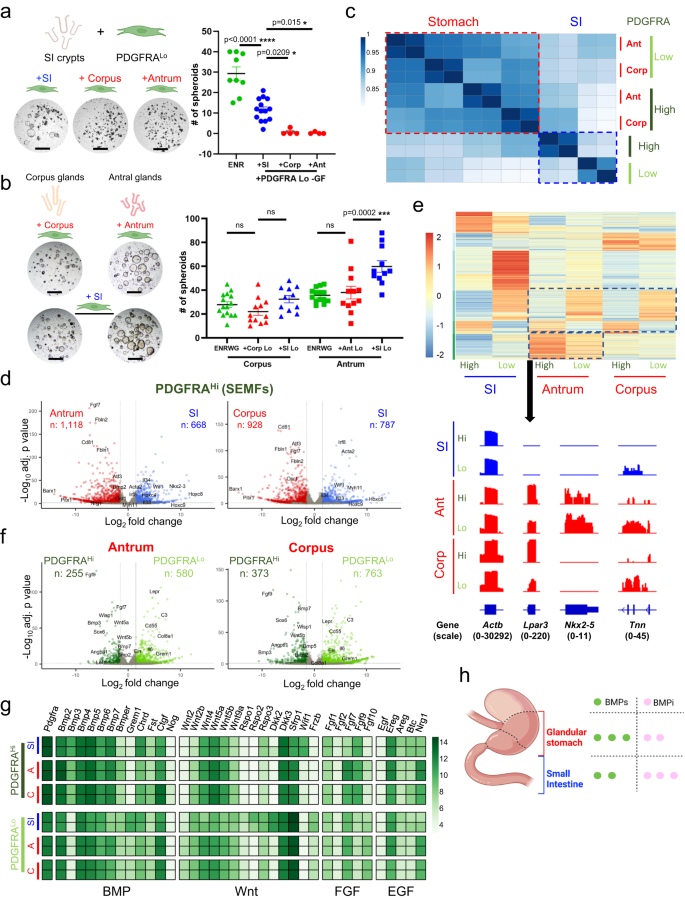
a Co-culture of SI crypts with PDGFRALo cells isolated from SI, antral or corpus mesenchyme and without NOG or RSPO1 (−GF). Stomach PDGFRALo cells did not induce spheroids. SI organoid growth in complete ENR served as a control. Scale bars 400 μm. Bars represent mean ± SEM. ENR: n = 9, +SI n = 14, +Corp and +Ant: n = 4. Significance of differences determined by one-way ANOVA and Tukey’s multiple comparison test. ns not significant. Source data provided as a Source Data file. b Co-culture of corpus or antral glands with PDGFRALo cells isolated from the same segment or from SI elicited spheroid growth in the absence of rNOG and RSPO1. Scale bars 400 μm. Corpus: ENRWG n = 15, +Corp Lo n = 12, +SI Lo n = 11, Antrum: ENRWG n = 14, +Ant Lo n = 12, +SI Lo n = 13. Control: gastric spheroid growth in ENRWG medium. Bars represent mean ± SEM. Significance of differences determined by one-way ANOVA and Sidak’s multiple comparison test. ns not significant. Source data provided as a Source Data file. c Pearson correlations among RNA-seq libraries from SI, antral, and corpus PDGFRAHi and PDGFRALo cells isolated from PdgfraH2BeGFP mice. Differences between gastric and intestinal PDGFRA+ cells are detailed in Supplementary Data 1. d Genes differentially expressed (q < 0.05; log2 fold-difference >1.5) between SI, antral, and corpus PDGFRAHi cells. Selected genes are named. Significance of differences determined by DESeq2 default settings (Wald test). e Genes enriched in each regional population (q < 0.05; log2 fold-difference >1.5; k-means = 6) and Integrative Genome Viewer tracks for representative genes enriched in antral PDGFRA+ cells. Actb controls for normalization of read counts. Parentheses: range of signal values. f Genes differentially expressed (q < 0.05; log2 fold-difference >1.5) between antral and corpus PDGFRAHi and PDGFRALo cells. Significance of differences determined by DESeq2 default settings (Wald test). g Relative expression of mRNAs for candidate niche factors (BMP, Wnt, FGF, and EGF agonists and antagonists) in each mesenchymal cell population. Heatmap is prepared from normalized rlog counts from DEseq2; each row represents one replicate. h Bulk RNA-seq data point to a higher BMP tone from Pdgfra+ cells in stomach than in the SI.
Regionality of gastrointestinal Pdgfra-expressing mesenchymal cells
To define regional differences, first we profiled bulk transcriptomes of PDGFRA+ cells purified by flow cytometry from the corpus and antrum of PdgfraH2BeGFP mice. Stripping external muscle before cell isolation excluded PDGFRAHi neurons nestled therein, so that the remaining PDGFRAHi cells represent gastric sub-epithelial myofibroblasts (SEMFs). Replicate RNA-seq libraries from each cell isolation were highly concordant (Supplementary Fig. 3d). In unsupervised hierarchical analysis, gastric PDGFRA+ cells were distinct from their previously described intestinal counterparts33, followed by differences between PDGFRAHi and PDGFRALo cells in each organ (Fig. 2c). Corpus and antral PDGFRAHi cell (SEMF) transcriptomes resembled each other more than they resembled SEMFs from the SI (Fig. 2d, Supplementary Fig. 3e and Supplementary Data 2). Exclusive expression of known transcriptional regulators Barx1 and Pitx1 in gastric, and of Nkx2-3 and posterior Hox genes in intestinal, cells support the veracity of additional findings. For example, gastric SEMFs express higher levels of Fgf7, Fbln1 and Fbln2, Cd81, and transcription factor genes Atf3 and Osr1, whereas intestinal SEMFs express higher levels of Il33 and Il34, the Wnt inhibitor Wif1, and transcription factor Irf8. Differential expression of Acta2 and Myh11 hints that intestinal and antral SEMFs may be more contractile than those in the corpus.
Segment- and cell type-specific gene modules were evident in each population (Fig. 2e). Intestinal PDGFRALo cells have the most distinctive transcriptome of any population, with unique expression of Eln, Col8a1, and Il6, among other factors, and differing from intestinal SEMFs in expression of >2100 genes (q < 0.05; |log2 fold-change| > 1.5), compatible with distinct and opposing functions33 (Supplementary Fig. 3f). The corresponding populations in both corpus and antrum are less divergent, differing in expression of ~800 (antrum) to ~1100 (corpus) genes (Fig. 2f). Gastric PDGFRALo cells from either segment are enriched for Cd55 (a marker we investigate later in this study), Lepr and Dll1 (genes that mark specific mesenchymal cells in mouse and human intestinal mesenchyme, respectively)43,44 while gastric SEMFs are enriched for signaling factors such as Fgf9 and Angptl1, multiple BMP genes, and for transcription factor (TF) gene Sox6 and, in the antrum, Wnt-responsive Lef1 (Fig. 2d, e and Supplementary Data 2). Foxl1, which marks intestinal SEMFs among other cells31,33,45, is expressed in gastric SEMFs and, at a lower level, also in gastric PDGFRALo cells. Thus, regional differences in the spatial arrangements of Pdgfra-expressing cells (Fig. 1) extend to their gene expression profiles.
Among potential sources of the signals that support epithelial expansion in vitro, genes for canonical Wnt2 and for non-canonical ligands Wnt4, Wnt5a, and Wnt5b are expressed in both PDGFRA+ populations in both corpus and antrum; however, Wnt-potentiating factors Rspo1, Rspo2, and Rspo3 express at lower levels in gastric than in intestinal PDGFRALo cells (Fig. 2g). Thus, while PDGFRA+ cells in every segment produce Wnt ligands, only transcripts in intestinal PDGFRALo cells display a potential for significant canonical Wnt signaling. BMP transcripts are enriched not only in intestinal, antral, and corpus PDGFRAHi cells, but Bmp2, Bmp5, and Bmp7 are also prominent in gastric PDGFRALo cells (Fig. 2g). Grem1, a BMPi abundant in intestinal PDGFRALo cells, and other classical BMPi are barely present in bulk populations of gastric PDGFRALo cells, which instead express a putative and atypical BMP7 inhibitor, Ctgf46,47. Based on mRNA levels alone, these findings suggest that overall BMP “tone” may be higher in the stomach than in the SI (Fig. 2h).
In culture, gastric glands generally form spheroid structures (see Fig. 2b and Supplementary Fig. 3b), distinct from intestinal organoids, in which budding protrusions represent crypts housing progenitor and stem cells42. When conditions to culture gastric glands were first defined, human fibroblast growth factor (FGF) 10 induced budding of unclear significance (stomach epithelium lacks crypts)3. In this light, the asymmetry of FGF transcripts in PDGFRA+ cells is striking. Of the five transcripts expressed in any population, Fgf9 is expressed in SEMFs and Fgf10 in PDGFRALo cells from all sites, while Fgf7 is especially high in antral SEMFs. Nrg1, an EGF-family factor implicated in ISC regeneration after injury34 and corpus pit cell differentiation48, is also uniquely higher in gastric (especially antral) than in intestinal SEMFs and PDGFRALo cells (Fig. 2g).
Transcriptional features of antral and corpus mesenchyme
Having identified differences in sub-epithelial structure and signaling capacity, we examined cellular heterogeneity by mRNA profiling of whole gastric mesenchyme (manually depleted of external smooth muscle) at single-cell resolution. A total of 34,445 mesenchymal cells (20,624 from corpus and 13,821 from antrum; epithelial contamination was negligible) provided information on at least 900 transcripts each (2700 transcripts for antrum Rep.1, Supplementary Fig. 4a). Consistent with the structures and cells revealed by fluorescence microscopy, graph-based clustering identified substantial fractions of Cd31+ endothelial cells from corpus, Acta2hi Myh11hi myocytes, Acta2lo Myh11lo Rgs5+ pericytes, and PDGFRA+ cells that lack these markers (Fig. 3a). Less than 10% of whole isolates were Ptprc+ immune cells, smaller than the 45% fraction present in whole SI mesenchyme33, only ~1% of cells were glial, and <1% showed signs of ongoing cell replication (Fig. 3a). Despite structural differences in corpus and antral blood vessels and muscle fibers (Fig. 1), transcriptomes of their constituent cells showed few regional differences. Significant cluster distinctions between corpus and antrum mapped exclusively to Pdgfra+ cells (Fig. 3b and Supplementary Fig. 4b), which express more candidate niche factors than other mesenchyme (Supplementary Fig. 4c). As all other cell types from corpus and antrum resembled each other similar Pdgfra+ cell dissimilarities are unlikely to represent a batch effect, as we confirmed additionally with AUGUR analysis49 (Supplementary Fig. 4d). These findings justify our preceding attention and subsequent focus on the 5896 antral and 6594 corpus Pdgfra+ cells from our scRNA-seq study.
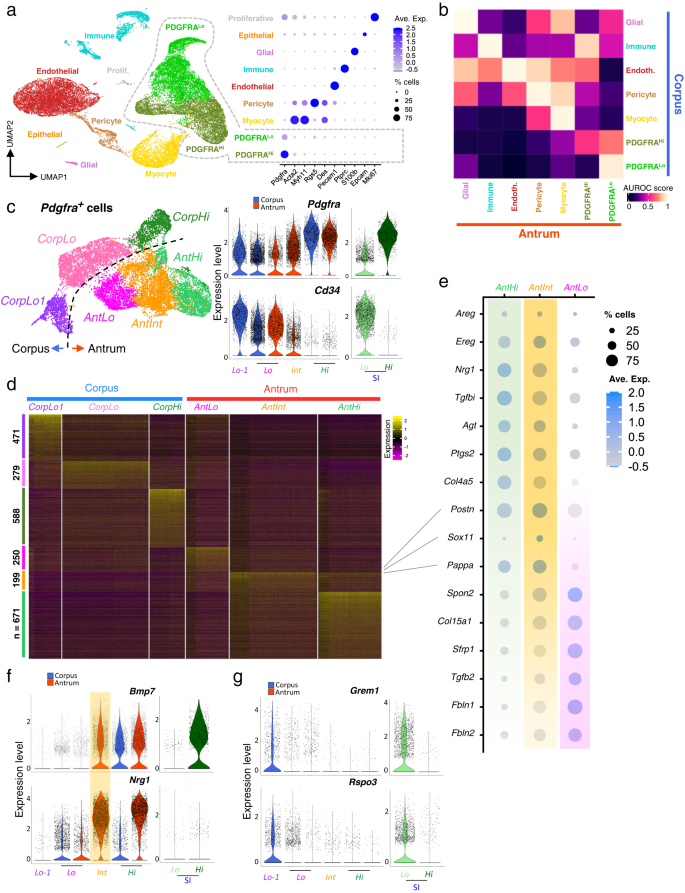
a Left: Uniform manifold approximation and projection (UMAP) plot of mRNA profiles from 34,445 single cells isolated from corpus (20,624 cells) and antral (13,821 cells) mesenchyme. Right: Relative expression of known cell-restricted genes in the UMAP cell clusters. Circle diameters represent the cell fraction expressing a gene and shades of purple represent normalized average expression within the population. b MetaNeighbour AUROC (area under the receiver operating characteristic) analysis shows high similarity between corresponding antral and corpus mesenchymal cells of each type other than the PDGFRAHi and PDGFRALo cell populations. c Left: UMAP identification of distinct populations of Pdgfra-expressing cells extracted from scRNA analysis of unfractionated mesenchyme. Right: Relative expression of Pdgfra and Cd34 in the identified Pdgfra-expressing populations and the corresponding SI cells. Blue, corpus; red, antrum; green, SI. The 3 corpus populations are more distinct than the 3 antral populations. d Differential genes expressed among the six PDGFRA+ mesenchymal cell types (Wilcoxon Rank Sum test, logfc.treshold = 0.25). The genes are listed in Supplementary Data 2. e Relative expression of marker genes from the three antral PDGFRA+ subpopulations identified by scRNA-seq. Circle sizes represent the percentage of cells expressing a gene, fill colors represent normalized average expression. AntInt shows distinct intermediate patterns. f Expression of niche genes Bmp7 and Nrg1 in each population compared with Pdgfra-expressing SI mesenchymal cells. AntInt expression levels are comparable to those in antral PdgfraHi cells (AntHi). Nrg1 expression in corpus and SI is significantly lower than in antral cells. g Grem1 and Rspo3 expression in each population compared with Pdgfra-expressing SI cells. Both genes are restricted to PdgfraLo populations and expressed at lower levels in the stomach than in SI.
Graph-based analysis limited to these cells identified 6 clusters: PdgfraHi and two related but distinct PdgfraLo cell populations from each gastric segment (Fig. 3c and Supplementary Fig. 2b—note that Cd34 marks intestinal PdgfraLo but not PdgfraHi cells33). Two PdgfraLo cell types in the corpus, CorpLo and CorpLo1, were separated on UMAP graphs but, consistent with bulk RNA profiles (Fig. 2e), antral cells separated less well. UMAP distinguished antral PdgfraHi (AntHi) and PdgfraLo (AntLo) cells and a substantial (44% of Pdgfra+ cells) third pool, AntInt, with intermediate Pdgfra and Cd34 levels and a distinctive RNA profile (Fig. 3c, d); this profile includes enriched expression of the transcription factor (TF) gene Sox11, contractile genes Acta2 and Myh11, and prostaglandin synthase Ptgs2 (Fig. 3e and Supplementary Data 3). Some features resemble AntHi (e.g., EGF-family genes Ereg, Areg and Nrg1, the TGF-ß inhibitor Tgfbi, and Col4a5) and others resemble AntLo (e.g., Tgfb2, Wnt antagonist Sfrp1, and extracellular matrix factors Spon2, Col15a1, Fbln1 and Fbln2). Notably, Bmp2/5/7 and non-canonical Wnt4 transcript levels approach those in antral and intestinal SEMFs (PdgfraHi cells), while other signals (e.g., Wnt5a, Fgf7) are lower than in SEMFs (Fig. 3e, f and Supplementary Fig. 4c, e). Because flow cytometry separated PDGFRAHi and PDGFRALo cells from PdgfraH2BeGFP mouse corpus better than the antrum (Supplementary Fig. 3a), we infer that AntInt segregates between these two populations in FACS isolation. The above differences, however, mark them as distinct cells and we show below that they differ from AntLo in niche activity.
Differences between corpus and antral PdgfraLo subpopulations also include expression of known niche factors. Low levels of intestinal niche factors Grem1 and Rspo3 apparent in bulk RNA profiles of stomach PDGFRALo cells (Fig. 2g) are largely limited to the distinct CorpLo1 cluster and AntLo, albeit at levels lower than intestinal PdgfraLo cells (Fig. 3g). CorpLo1 also expresses a different spectrum of extracellular matrix genes (high Has1, Dpt and Col14a1—Supplementary Data 3) compared to CorpLo, suggesting that these cells may localize in different anatomic domains. Of note, BMP agonist mRNA levels diverge less between PdgfraHi and other Pdgfra+ cells in the stomach than in the intestine and BMPi express at lower levels (Supplementary Fig. 4f), affirming ostensibly higher BMP tone in the stomach. MetaNeighbor showed that AntInt most resembles AntLo (Supplementary Fig. 4g). In summary, we identify distinct gastric PDGFRA+ populations from each region and below we address their properties systematically.
Molecular and spatial heterogeneity of antral SEMFs
We first considered PdgfraHi cells (SEMFs), which occupy a specific anatomic compartment and have unique mRNA profiles (Figs. 1–3). Gastric and intestinal SEMFs differ in high Fgf7 (antrum) and Fgf9 (corpus) expression and in profiles of the TF genes Foxl1 and Gli1 (Fig. 2g and Supplementary Figs. 4c and 5a). Considered apart from other mesenchymal cells, they divided into one corpus and two antral subpopulations, all of which express canonical BMP ligand genes (Fig. 4a and Supplementary Fig. 5b). Notably, one antral cluster expresses high Fgf7 and the EGF ligand Nrg1, while the other is marked by high Bmp3 and Ctgf (candidate non-canonical BMPi)50,51 and low levels of Nrg1, a profile similar to corpus SEMFs (Fig. 4a, b); Fgf7 and Bmp3 are largely SEMF-restricted, while the other genes are enriched in SEMFs but also expressed in other PDGFRA+ cells (Supplementary Fig. 4c, f). In situ hybridization localized antral Fgf7+ Nrg1+ SEMFs to the tops of antral glands, adjacent to foveolae, whereas Bmp3 and Ctgf localize primarily in SEMFs that abut the zone of epithelial cell replication in the lower gland (Fig. 4c). As antral SEMF density is higher at gland tops than at the base (Supplementary Fig. 1e–g), the proportions of SEMF subpopulations (Fig. 4a) further support that molecularly distinct antral SEMF subpopulations are spatially segregated.
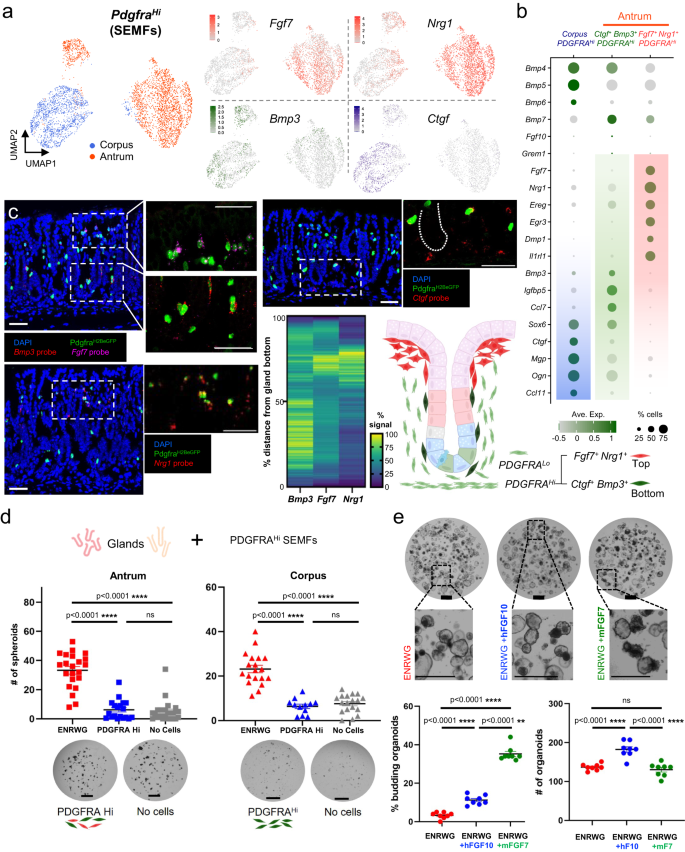
a In isolation, corpus and antral SEMFs are distinct and antral SEMFs divide further into two cell populations. Right: Fgf7, Nrg1, Bmp3, and Ctgf mRNA densities projected on the UMAP plot. b Relative expression of scRNA-seq markers from the three SEMF populations. Circle diameters and fill colors represent the fraction of cells expressing a gene and normalized average expression levels. The two antral SEMF populations differ in expression of Fgf7, Nrg1, Bmp3, and other factors; corpus SEMFs resemble the smaller antral Bmp3+ cluster more than the larger population of antral Fgf7+ Nrg1+ cells. c Fluorescence in situ hybridization (RNAscope) on antral tissue sections localizes Fgf7– and Nrg1-expressing PDGFRAHi SEMFs near gland pits and Bmp3– and Ctgf-expressing cells in the lower half of glands. Images represent fields examined in three independent experiments with each probe. Scale bars 50 μm. Heatmap: average fluorescence signal quantified along 16–25 individual glands (Ctgf probe quantification is shown in Fig. 6a). Source data are provided as a Source Data file. Right: schematic representation of antral SEMF distribution. d Co-culture of antral and corpus glands with unfractionated PDGFRAHi cells, which fail to induce spheroids in the absence of rNOG and RSPO1. Glands cultured in ENRWG medium serve as controls. Scale bars 400 μm. Bars represent mean ± SEM. Antrum: +ENRWG n = 22, +PDGFRAHi n = 19, No cells n = 22; Corpus: +ENRWG n = 19, +PDGFRAHi n = 12, No cells n = 18. n: number of culture wells analyzed over six independent experiments. Significance of differences determined by one-way ANOVA coupled with Sidak’s multiple comparison test. ****p < 0.0001, ns not significant. Source data are provided as a Source Data file. e Antral glands exposed to recombinant rFGF7 or rFGF10 in addition to complete ENRWG medium. Budding of spheroid structures increased upon treatment with rFGF7 without affecting spheroid numbers (n = 8 independent experiments). Bars represent mean ± SEM. Significance of differences determined by one-way ANOVA coupled with Dunnett’s multiple comparison test. ns not significant. Scale bars 400 μm. Source data are provided as a Source Data file.
Because Bmp3 and Ctgf may have BMPi activity50,51 and SEMFs expressing those genes lie near proliferative epithelial cells, we asked if they might support antral gland growth in vitro; to optimize the assay for BMPi activity, we reduced RSPO and Wnt3 concentrations 5-fold. In these conditions, rNOG readily supported antral spheroids, but the same concentration of human rBMP3 or rat rCTGF lacked that activity (Supplementary Fig. 5c). No surface marker reliably separated Bmp3+ Ctgf+ from Fgf7+ Nrg1+ SEMFs. When co-cultured with gastric glands in the absence of any recombinant factor, unfractionated FACS-sorted antral or corpus PDGFRAHi cells (GFPHi cells from PdgfraH2BeGFP mice) did not induce spheroid growth from the corresponding glands, in contrast to the stimulation by ENRWG medium (Fig. 4d) or by bulk PDGFRALo cells (Fig. 2b). Together, these findings reveal spatial and molecular asymmetry of antral SEMFs that fail to support corpus or antral gland growth in vitro, much as intestinal SEMFs lack discernible support function in organoid assays33. To better define SEMF contributions in those assays, we co-cultured gastric glands with SEMFs in complete ENRWG medium, in medium lacking EGF and Noggin, or in medium containing RSPO1 as the only supplement. In the presence of these factor combinations, SEMFs did not reduce the number of resulting spheroids (Supplementary Fig. 5d).
In cultured antral glands, recombinant human FGF10 induces buds, which are presumed to reflect epithelial maturation3. Because Fgf7 is abundant in peri-foveolar antral SEMFs, belongs in the same clade as Fgf10, and their common receptor, Fgfr2, is expressed in antral epithelium52, we considered a function for FGF7 in epithelial differentiation. Addition of murine rFGF7 to ENRWG medium increased budding substantially without affecting organoid numbers (Fig. 4e). Although constitutive Fgf7 gene disruption has no reported effects on mouse gastric development or function53 subtle differentiation defects could have been masked. To assess possible gastric functions in adult mice, we used CRISPR gene editing to flank exon 2 of the Fgf7 locus with LoxP sites (Supplementary Fig. 6a), then introduced the floxed allele onto the PdgfraCre(ER-T2) background41. PdgfraCre(ER-T2);Rosa26LSL-tdTomato mouse stomachs revealed robust Cre recombinase activity in PDGFRAHi and, at lower efficiency, in PDGFRALo cells (Supplementary Fig. 6a, see also Fig. 1e and Supplementary Movies 5 and 6). PCR genotyping verified the expected null allele in Tomato+ cells isolated from antral PdgfraCre(ER-T2);Fgf7Fl/Fl;Rosa26LSL-TdTomato mesenchyme (Supplementary Fig. 6a). We observed no overt histologic defects or perturbed distribution of antral epithelial proliferative or differentiation markers (Supplementary Fig. 6b) and scRNA profiles of purified wild-type (WT) and Fgf7−/− antral epithelium showed intact proportions and expression characteristics of proliferative and differentiated cells (Supplementary Fig. 6c), with only subtle differences in foveolar cell transcripts between Fgf7−/− and WT mice (Supplementary Data 3). Thus, despite the abundance and specificity of Fgf7 expression in a spatially discrete subpopulation of antral SEMFs and its budding effect in vitro, its essential, non-redundant role in maintaining antral epithelium in vivo is at most minor.
Spatially and molecularly distinct corpus and antral PDGFRALo cell populations
Next, we examined gastric Pdgfra+ cell clusters other than PdgfraHi (Fig. 3). Considered separately from SEMFs, PdgfraLo and PdgfraInt resolved into 5 sub-groups within 3 clusters; the smallest and most distinct cluster corresponds to CorpLo1 and few antral PdgfraLo cells, while the remaining cells cluster by corpus and antral origins (Fig. 5a). Within the large corpus cluster, one sub-group, CorpLo2, shares expression of a panel of niche factor genes with AntLo, while the other sub-group, CorpLo3, expresses genes (e.g., Pappa, Sox11, Postn, Nrg1—see Fig. 3e) that mark AntInt (Fig. 5a). These populations selectively express BMPs, which inhibit ISCs, and non-canonical Wnts, which lack known niche function (Fig. 5a, b). Conversely, factors known to constitute the ISC niche, such as Grem1 and Rspo3, are selectively enriched in AntLo, CorpLo2, and the isolated corpus cluster CorpLo1 (Fig. 5a, b). Thus, scRNA data separate gastric PdgfraLo cells into fractions that superficially resemble cells active in the ISC niche (AntLo, CorpLo1, CorpLo2) and those that express distinct, potentially opposing factors (AntInt and CorpLo3).
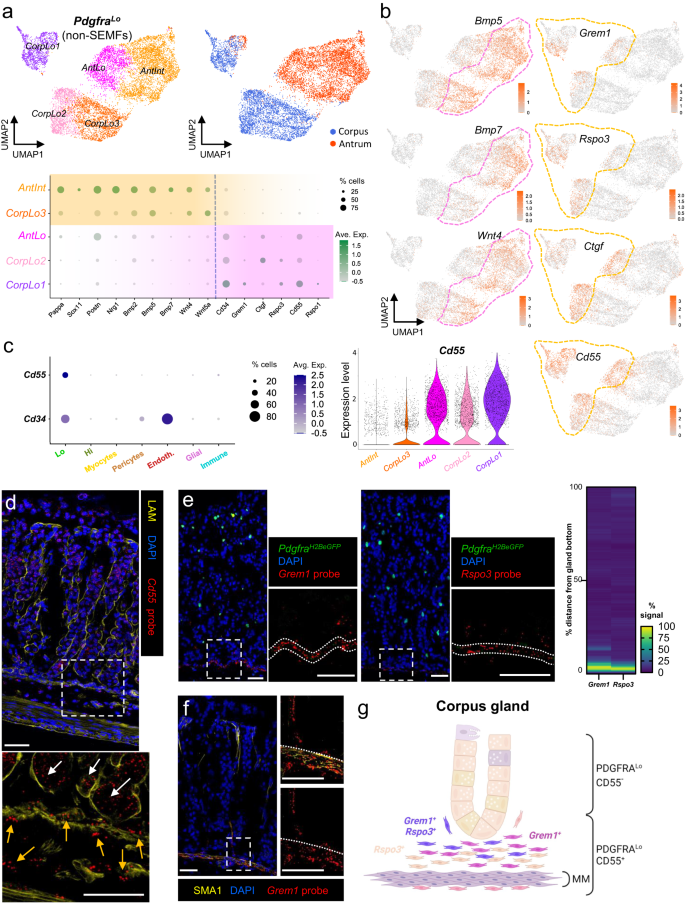
a In isolation, gastric PDGFRA+ mesenchyme other than SEMFs resolves into five subpopulations: previously identified AntInt, AntLo and CorpLo1 (Fig. 3) and two CorpLo subpopulations, CorpLo2 and CorpLo3. Relative expression of selected scRNA-seq markers is plotted below. Circle diameters: cell fraction expressing a gene, fill shades: normalized average expression. CorpLo3 shares markers identified in AntInt (see Fig. 3e). b Bmp5, Bmp7, Wnt4, Grem1, Rspo3, and Ctgf transcript densities projected on the UMAP plot of resolved non-SEMF cell clusters. CorpLo3 and AntInt express BMPs and Wnt4, while AntLo, Corp1, and Corp2 express Grem1, Rspo3, and Ctgf. Dashed lines mark the distinct populations. c Left: Relative Cd55 and Cd34 expression in sub-epithelial cell fractions from scRNA-seq analysis. Circle diameters and fill colors represent the parameters defined in (a). Middle: Relative Cd55 expression in PDGFRALo subpopulations. Right: Projection of Cd55 density on the PDGFRALo UMAP, showing nearly exclusive expression in CorpLo1, CorpLo2 and AntLo cells. d In situ hybridization (RNAscope) of corpus tissue sections, together with LAM immunostaining, localizes Cd55 in the epithelium (white arrows) and in PDGFRALo mesenchymal cells (orange arrows) near the gland base, on both sides of muscularis mucosae. The area within the dashed box is magnified below. Images represent scores of fields examined in two independent experiments. Scale bars 50 μm. e In situ hybridization (RNAscope) of corpus tissue sections localizes Grem1 (left) and Rspo3 (middle) near the gland base. Images represent scores of fields examined in two independent experiments. Scale bars 50 μm. Dotted lines mark the muscularis mucosae. In the heatmap, fluorescence signal strength is quantified along 50–52 individual glands. Source data are provided as a Source Data file. f In situ hybridization (RNAscope) of corpus tissue localizes Grem1 in the SMA1-immunostained muscularis mucosae, demarcated by dotted lines, and in the space corresponding to PDGFRALo cells near the gland base (n = 2 independent experiments). Scale bars 50 μm. g Schematic illustration of the distribution of CD55+ PDGFRALo cells relative to corpus glands and the muscularis mucosae (MM). Grem1– and Rspo3-expressing cells lie largely beneath glands.
To assess niche cell functions in isolated gastric cell populations, we sought a cell surface marker that could separate PdgfraLo cell fractions expressing Grem1, Rspo3 or Ctgf (to varying degrees—shaded pink in Fig. 5a) from those expressing BMP and non-canonical Wnts (shaded orange). In scRNA analysis, two cell surface marker genes, Cd34 and Cd55, showed selective expression in AntLo, CorpLo2, and especially CorpLo1 cells (Fig. 5a). Cd34, a known marker of trophocytes and other intestinal PDGFRALo cells, is also abundant in endothelial cells33,54 (Fig. 5c). In contrast, Cd55, which encodes the tetraspanin CD55 and marks SI mesenchymal cells that support in vitro expansion of SI crypts35, is additionally expressed only in a small fraction of gastric immune cells (at levels lower than in PdgfraLo cells—Fig. 5c) and in the foveolar epithelium (Supplementary Fig. 7a). Flow cytometry of epithelial (EpCAM+, Supplementary Fig. 7b) and PDGFRAneg non-immune (CD45−/PTPRC−) cells from PdgfraH2BeGFP mice showed negligible surface CD55 expression, but reliably purified corpus and antral CD55+ PDGFRALo cells (Supplementary Fig. 7c, d) and traced CD55 expression in CD45+/PTPRC+ cells mostly to B lymphocytes (Supplementary Fig. 7e). In fact, ~90% of B lymphocytes from each region expressed CD55 against 60% of myeloid cells and 70% of T lymphocytes. Whereas immunohistochemistry with multiple CD55 antibodies gave high background signals, in situ hybridization (ISH) with Cd55 probe showed that extra-epithelial Cd55 expression is restricted to sub-glandular mesenchymal cells located below and just above the muscularis mucosae, into the bottom ~1/6 of corpus gland height (Fig. 5d).
To better define this mesenchymal Cd55+ population, we used ISH probes for Grem1 and Rspo3, which scRNA-seq detected in CorpLo1 or in CorpLo1 and CorpLo2, respectively (Fig. 5a—high Ctgf ISH signals in corpus SEMFs occluded Ctgf-expressing PDGFRALo cells). In PdgfraH2BeGFP mouse corpus, Grem1 and Rspo3 localized in adjacent sub-glandular mesenchymal cell layers (Fig. 5e). SMA1 (smooth muscle actin1, Fig. 5f) immunostaining placed the dense ISH signals in a tissue layer where PDGFRALo cells intermingle with muscularis mucosae, while sparser signals localized to PDGFRALo cells located between the muscularis and the corpus gland base (Fig. 5f). This distribution resembles that of Cd55 but the latter extends farther below the muscularis mucosae than Rspo3 and especially Grem1 (Fig. 5d–f). Taken together with scRNA-seq, which showed broader expression of Cd55 than the other markers (Fig. 5a), these findings indicate that CorpLo1 cells lie within and above the muscularis, CorpLo2 cells extend below the muscularis, and the largest subpopulation, CorpLo3 which lacks Grem1 or Rspo3, surrounds the top and middle zones of corpus glands (Fig. 5g).
Extra-epithelial Cd55 in the antrum also localized in sub-glandular mesenchyme (Fig. 6a). Consistent with low Rspo3 expression in scRNA-seq data (Fig. 5a), ISH signals for Rspo3 were weak, but Grem1 and Ctgf localized confidently in sub-glandular mesenchyme, overlapping with Cd55 (Fig. 6b, c): Grem1+ PdgfraLo cells are mixed with muscularis mucosae and Ctgf+ PdgfraLo cells reside between the muscularis and antral gland bottoms. Thus, Cd55+ PdgfraLo cells are restricted to the space beneath both corpus and antral glands. ISH and scRNA-seq data were consistent in indicating that Rspo3, when present, is co-expressed with Grem1, but the overlap between Ctgf and Grem1 is limited in both stomach regions (Supplementary Fig. 8a). The CD55+ fraction therefore represents a sub-glandular mix of Grem1+ Rspo3+ and Grem1− Ctgf+ cells.
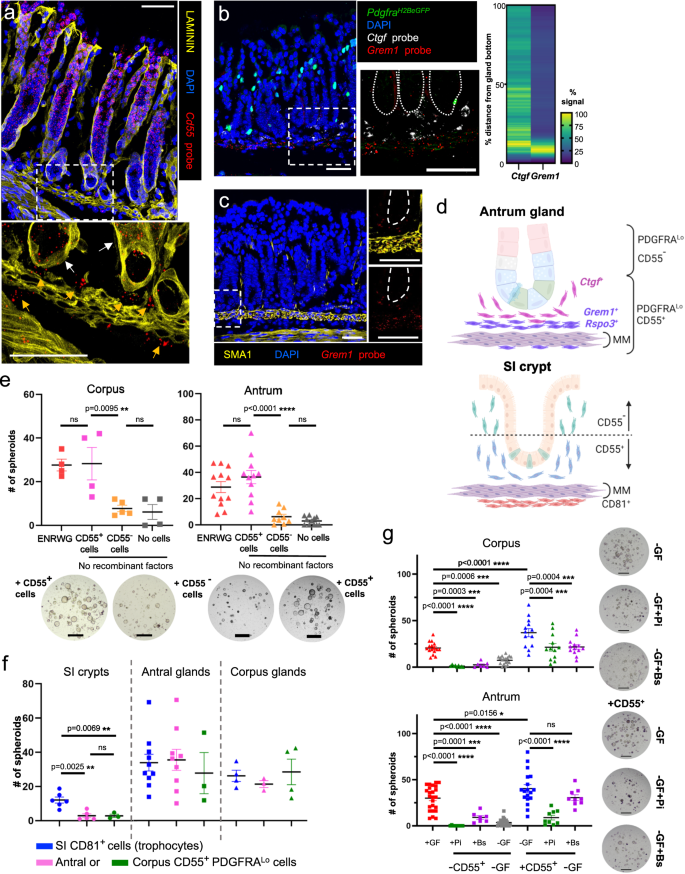
Antral in situ hybridization localized (a) Cd55 to the epithelium (white arrows) and PDGFRALo mesenchymal cells (orange arrows) near gland bottoms; (b) Grem1 and Ctgf near the gland base (dotted lines demarcate glands, heatmaps: fluorescence along individual glands, n = 35 to n = 39, Source data provided as a Source Data file); and (c) Grem1 in SMA1+ muscularis mucosae, extending into sub-glandular PDGFRALo cells (dashed lines demarcate glands). Dashed boxes are magnified below (a) or to the right (b, c). Images represent fields examined in 2 (a, c) or 3 (b) independent experiments. Scale bars 50 μm. d Schema of mesenchymal cell distributions. MM muscularis mucosae. e Co-culture of gastric glands with CD55+ or CD55− PDGFRALo cells from each region. ENRWG corpus n = 4, antral n = 12; CD55+ corpus n = 4, antral n = 11; CD55− corpus n = 5, antral n = 9; No cells corpus n = 4, antral n = 11. Bars: mean ± SEM. Significance: one-way ANOVA and Tukey’s multiple comparison test. ns not significant. Source data provided as a Source Data file. Scale bars 400 μm. f Spheroid formation from SI crypts and antral or corpus glands co-cultured with CD55+ (gastric) or CD81+ (SI trophocyte) fractions from each region. SI crypts: CD81+ n = 6, Antral CD55+ n = 5, Corpus CD55+ n = 3; Antral glands: SI CD81+ n = 12, Antral CD55+ n = 11, Corpus CD55+ n = 3; Corpus glands: SI CD81+ n = 4, Antral CD55+ n = 3, Corpus CD55+ n = 4. n: independent experiments, each with ≥2 technical replicates. Bars: mean ± SEM. Significance: one-way ANOVA and Tukey’s multiple comparison test. ns not significant. Source data provided as a Source Data file. g Co-culture of gastric glands with or without corresponding CD55+ PDGFRALo cells, growth factors (+GF or −GF), and Porcupine inhibitor Wnt-C59 (Pi) or BMP2/4/7 cocktail (Bs). Bars: mean ± SEM. No cells+GF corpus n = 16, antral n = 24; −CD55++Pi corpus and antral n = 9, −CD55++Bs corpus n = 8, antral n = 7; −GF corpus n = 18, antral n = 25; +CD55+ corpus n = 13, antral n = 18; +CD55++Pi corpus n = 12, antral n = 8; +CD55++Bs corpus n = 13, antral n = 9. Significance: one-way ANOVA and Sidak’s multiple comparison test. ns not significant. Source data provided as a Source Data file. Scale bars 400 μm.
These findings highlight similarities and differences between corpus, antral, and SI PdgfraLo mesenchyme. Antral PdgfraLo cells express less Grem1 or Rspo3 than their SI counterparts (Fig. 2g), but the transcripts show substantively similar distribution in both sites, near proliferative and Lgr5+ stem cells at the base of antral glands and SI crypts (Fig. 6d). The apparent gradient of high to low Grem1 and Rspo3 expression (from muscularis to epithelium) in sub-glandular corpus PdgfraLo cells also resembles a self-organized gradient recently described in the SI35 (Fig. 5g). However, proliferative and presumptive stem cells in the isthmus of corpus glands lie far from Grem1– and Rspo3-expressing cells. Therefore, sub-glandular CD55+ cells may drive isthmus cell replication from a distance, may act principally on nearby facultative stem cells in the gland base, or may affect epithelial differentiation more than cell replication per se. BMP signaling, for example, is implicated not only in exit from the stem-cell compartment55,56,57 but also in intestinal endocrine58 and gastric foveolar (pit) cell25 differentiation.
PDGFRALo cell populations that affect epithelial growth in vitro and differentiation in vivo
Gastric mesenchymal PDGFRALo cells support gastric spheroid, but not intestinal organoid, growth in vitro (Fig. 2a, b). To define the niche activities of the sub-glandular fraction, we used flow cytometry to isolate CD55+ and CD55− cells from PdgfraH2BeGFP mice (Supplementary Fig. 7b, c), then co-cultured gastric glands with one cell fraction or the other in media lacking recombinant factors. While glands cultured with no mesenchymal cells or with CD55− cells from antral or corpus mesenchyme generated at most a few tiny spheroids, those cultured with CD55+ cells robustly stimulated spheroid growth (Fig. 6e). Like unfractionated gastric PDGFRALo cells (Fig. 2a), neither fraction induced organoid formation from SI crypts, but both CD81+ SI trophocytes and CD55+ gastric PDGFRALo cells induced spheroid growth from isolated corpus and antral glands (Fig. 6f). To define the signaling pathways most pertinent in the cellular effect of CD55+ cells, we added the Porcupine inhibitor Wnt-C59, which impairs secretion of all Wnts59, or a cocktail of recombinant BMPs 2, 4 and 7, to gastric gland co-cultures. While Wnt-C59 attenuated CD55+ cell effects on corpus and antral glands, BMP2/5/7 inhibition was significant on corpus, but statistically insignificant on antral glands (Fig. 6g). Thus, only the CD55+ fraction of PDGFRALo cells can elicit gastric spheroids, owing in part to functions that BMPs and impaired Wnt secretion can override.
Spheroid growth from gastric glands may reflect an experimental feature (close apposition of mesenchymal cells to epithelium) that differs from the native tissue structure, at least in the corpus where CD55+ PDGFRALo cells localize far from the isthmus. In the absence of a means to test the function of the full CD55+ cell fraction in vivo, Grem1DTR mice35 provided a path to deplete at least the minority Grem1+ subpopulation. Ablation of intestinal Grem1+ cells, including PDGFRALo CD81+ trophocytes, rapidly depletes overlying ISCs and progenitors33; in line with this finding, treatment of Grem1DTR mice with Diphtheria toxin resulted in >90% and ~50% depletion of Grem1 and Rspo3 transcripts (Fig. 7a) and in arrested SI epithelial replication within attenuated crypts (Supplementary Fig. 8b). In contrast, KI67 immunostaining revealed no compromise of corpus or antral epithelial proliferation (Fig. 7b); the only consistent defect was near absence of antral UEAI staining (Fig. 7b), signifying absent or defective basal mucous cells (see also Supplementary Fig. 1b). Ablation of gastric Grem1+ cells elicited minor reductions in antral RNA levels of Lgr5 and the proliferative isthmus cell marker Stmn114, altered Muc6 levels in corpus and antrum, and reduced Troy mRNA in the corpus (Fig. 7b). These findings identify selective and modest effects of Grem1+ cells on corpus and antral basal cell markers, implying that most of the CD55+ cell effect on gastric spheroids reflects Grem1− (Ctgf+) cell activity.
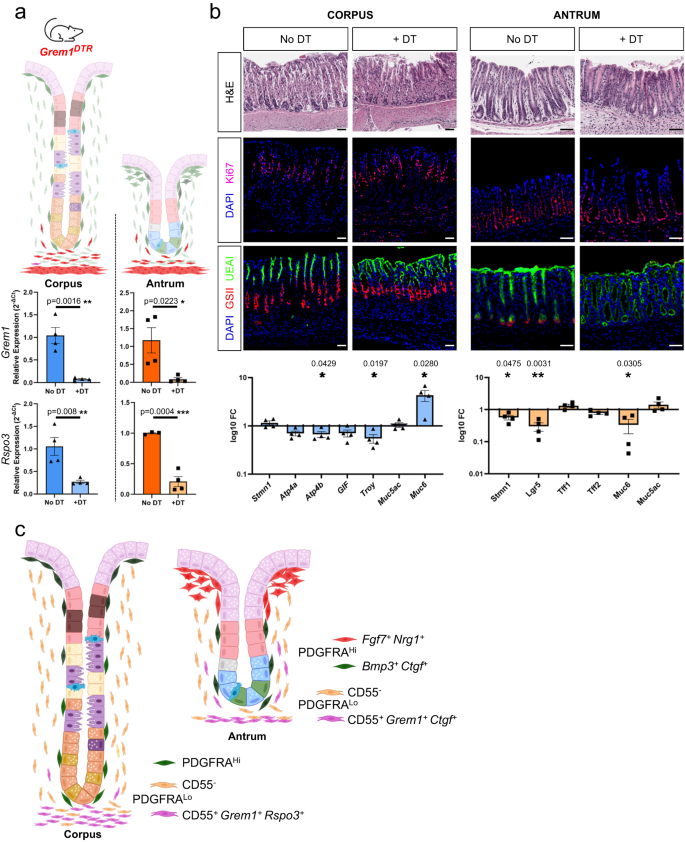
a Grem1DTR mice treated with Diphtheria toxin (DT) and untreated control mice were used to assess the effects of partial (Grem1+ fraction) ablation of the CD55+ PDGFRALo cell compartment. Grem1 and Rspo3 mRNA levels were significantly reduced 72 h after DT treatment (n = 4). Bars represent mean ± SEM values. Significance of differences was determined by two-tailed unpaired Student’s t test. *p < 0.05; **p < 0.01; ****p < 0.0001. b Top: histology (H&E), KI67 immunofluorescence, and staining with fluorescent GSII and UEAI lectins to highlight proliferative and distinct mucous cell types in the corpus and antrum of DT-treated mice and untreated (No DT) controls. Scale bars 50 μm. Blue, DAPI; magenta, KI67; red, GSII; green, UEAI. Bottom: qRT-PCR analysis of corpus and antral epithelial cell markers (relative to Gapdh and to untreated controls, no DT) in tissues harvested 72 h after treatment (n = 4). Bars represent mean ± SEM values. Significance of differences determined by two-tailed unpaired Student’s t test. Source data are provided as a Source Data file. c Schematic representation of all antral PDGFRA+ cell types in relation to glandular epithelium.
- SEO Powered Content & PR Distribution. Get Amplified Today.
- PlatoData.Network Vertical Generative Ai. Empower Yourself. Access Here.
- PlatoAiStream. Web3 Intelligence. Knowledge Amplified. Access Here.
- PlatoESG. Carbon, CleanTech, Energy, Environment, Solar, Waste Management. Access Here.
- PlatoHealth. Biotech and Clinical Trials Intelligence. Access Here.
- Source: https://www.nature.com/articles/s41467-023-43619-y