Mice and in vivo models
Animals were housed in a specific pathogen-free conditions and fed standard mouse chow. All animal experiments were carried out in compliance with China laws and regulations. The local institutional animal ethics board (Institutional Animal Care and Use Committee of Westlake University) approved all mouse experiments (permission numbers: 19-001-2-CS). Experiments were performed in accordance with government and institutional guidelines and regulations. All mice are housed at 20–24 °C with 40–60% humidity, and 12 h cycle of light/darkness (7 a.m. – 7 p.m.).
The Bcl11bflox/flox mice (C57BL/6 background) were generously provided by Mark Leid’s lab and the B6N.Cg-Tg (KRT14-cre)1Amc/J (stock number 018964) were purchased from Jackson Laboratory. mTmG mice (B6.129(Cg)-Gt(ROSA)26Sortm4(ACTB-tdTomato,-EGFP)Luo/J, 007676) were purchased from The Jackson Laboratory (The Jackson Laboratory, Bar Harbor, Maine, USA). Female C57BL/6 mice, 2–6 months old were purchased from Jackson Laboratory, and were maintained till 29 months.
Tissue processing and flow cytometry
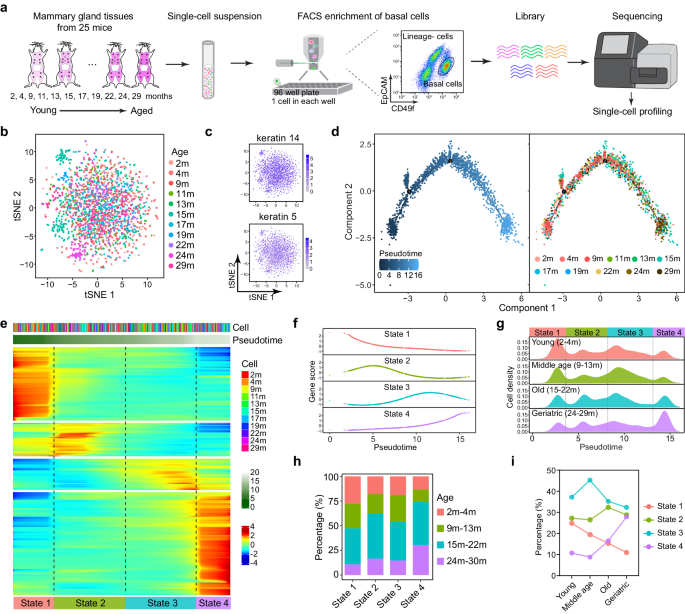
Mammary glands were collected from 2nd, 3rd, 4th pair of mammary glands of C57/BL6 mice, and were dissected and processed according to the published protocol86 with minor revision. Mammary glands were minced into 1 mm3 size using a tissue cutting blade and digested with 0.5 mg/mL Collagenase type III (Worthington, LS004182) and 50 U/mL hyaluronidase (Worthington, LS002592) for 2 h with gentle pipetting every 30 min. Digested mammary homogenate was collected and treated with ACK lysing buffer for 5 min on ice, then was digested using 0.25% Trypsin-EDTA (GIBCO) for 5 min, followed by DNase I (Worthington, LS002139) digestion. After filtered by 70 μm strainer, the dissociated mammary cells were stained with CD45 (560501, BD, 1:200), CD31 (562939, BD, 1:200), Ter119 (560504, BD, 1:200), EpCAM (118220, BioLegend, 1:200), CD49f (313606, BioLegend, 1:200) for 20 min on ice. Cells were washed and resuspended in HBSS + 2% FBS + 1% PSA + DAPI (1 μg/mL), then were sorted using FACS Aria II (BD Bioscience). FACS data was analyzed by FlowJo (V10).
Transplantation
For transplantation assay of young and aged mammary gland, 3 month-old and 18 month-old WT C57BL/6 mice were lineage depleted using Mammary Epithelium Enrichment Kit (Stem Cell Technologies) and resuspended in injection media (HBSS + 2% FBS + 1% PSA + 50% Matrigel) to 50 k/5 μL, and serially diluted to 20 k/5 μL, 5 k/5 μL and 2 k/5 μL. Cells were subjected to limiting dilution transplant to the cleared fat pad of 3 week-old recipient mice (C57BL/6). Briefly, the recipient mice were anesthetized with pentobarbital sodium at a dose of 70 mg/kg. The inguinal rudimentary tree was removed and 5 μL of cell suspension was injected onto the residual fat pad using 25 μL Hamilton Syringe. 7 weeks later, the recipient mice were analyzed using mammary gland whole mount carmine staining. The MRU frequency and confidence interval were determined by ELDA.
For transplantation of Bcl11b knockout cells, mammary cells from 4 month-old wild-type and Krt14-cre Bcl11bflox/flox mice were resuspended in injection media (HBSS + 2% FBS + 1% PSA + 50% Matrigel) to 200 k/5 μL. Cells were injected into the cleared fat pad of 3 week-old recipient mice (C57BL/6). 7 weeks later, the recipient mice were subsequently mated with WT male mice for 3 rounds. Mammary Tissues were collected at designated time points and subjected to whole mount analysis.
For transplant assay of IKKb overexpression cells, CD49fhighEpCAMlowLin– cells from 2 month-old C57BL/6 WT mice were sorted using FACS and resuspended in culture media (DMEM/F12 + 2% FBS + 1% PSA + 2% B27) supplemented with EGF (10 ng/ mL, BD Bioscience), Rspo1(250 ng/mL, R&D), ROCK inhibitor Y27632 (10 uM, Sigma) to 100 k/200 μL/well in 96-well non-adherent culture plate (Corning). Cells were transduced with lentivirus-pCDH or lentivirus-pCDH-IKKb at MOI 20 overnight. The next day, cells were seeded on top of the Matrigel to do the colony culture. One week later, colonies were digested using DispaseII 1 mg/mL (Sigma, D4693) for 1 h followed by treatment of 400 μL TrypLE™ Select (GIBCO)/eppendorf tube at 37 °C for 5 min. Dissociated cells were neutralized with HBSS + 2% FBS + 1% PSA and stained with DAPI. GFP+ cells were sorted and then resuspended with injection media (HBSS + 2% FBS + 1% PSA + 50% Matrigel) to 2.5k/5 μL, and serially diluted to 500 cells/5 μL, 100 cells/5 μL and 50 cells/5 μL. Cells were subjected to limiting dilution transplant to recipient mice. Mice were maintained in aseptic sterile condition for 7 weeks before whole mount analysis. For secondary transplant, mammary fat pad at 2.5 k/5 μL dilution, which exclusively gave rise to full tree, were collected and digested to single cell suspension. Cells from one fat pad of 2.5k/5 μL dilution group were divided equally to six parts and transplanted to 6 cleared fat pad of recipient mice, respectively. Mice were maintained for 7 weeks before whole mount analysis. The mammary gland area percentage was determined by the outgrowth area divided by cleared fat pad area. The area was measured by Image J software.
Colony formation assay
For colony formation assay, 35 μL/well growth factor reduced Matrigel (Corning, 356231) was overlaid on the 96-well plate and solidified at 37 °C for 10 min. CD49fhighEpCAMlowLin– cells were collected from FACS and cultured in 200 μL culture media (DMEM/F12 + 2% FBS + 1% PSA + 2% B27) supplemented with 10 ng/ mL EGF (BD Bioscience), 250 ng/ mL Rspo1(R&D), 10 μM ROCK inhibitor Y27632 (Sigma), and then were plated on top of the Matrigel. Cells were cultured at 37 °C incubator with 5% CO2 for 7 days.
For colony formation ability test of aging CD49fhighEpCAMlowLin– cells, CD49fhighEpCAMlowLin– cells were sorted from 2–4 months, 12-13 months and 22–29 months mice, seeded on Matrigel in 96-well plates, 3000 cells per well, three replicates for each mouse sample. Colony number was counted after 7 days culture.
For colony formation assay of IKKb overexpression cells, mammary CD49fhighEpCAMlowLin– cells were sorted from 2–4 months WT or K14-Cre Bcl11bfl/fl mice and transduced with pCDH and pCDH-IKKb virus for 7 days. 9000 GFP positive cells were sorted and seeded to 3000 cells/200 μL/well equally in three wells in the culture medium. Colony number was counted after 7 days culture. Each group was repeated with three biological replicates.
Mammary gland whole mount carmine staining
Mammary gland was dissected and fixed in Carnoy’s solution (60% Ethanol, 30% CHCl3,10% Acetic Acid) for 4hrs, washed with 70% ethanol and ddH2O, and then stained with carmin-alum staining solution (0.2% wt/vol carmine (Sigma, C1022), 0.5% wt/vol aluminum potassium sulfate (Sigma, A7176) and 0.01% wt/vol thymol in ddH2O) overnight. Tissue was dehydrated through 75%, 95% and 100% ethanol, and then placed in xylene to remove the fat tissue. For long-term preservation, tissue was mounted by Permount® (Fisher Scientific). Images were obtained using a stereomicroscope (Nikon, SMZ18).
β-Galactosidase staining
Mammary gland was dissected and immediately fixed by 2% formalin containing 0.25% glutaraldehyde for 1.5 h followed by 30% sucrose infiltration overnight, and then was embedded in O.C.T. compound (Tissue-Tek) and frozen at −80 °C. Frozen tissue was sectioned to 14 μm using Cryostat Leica CM3050 S (LEICA). Frozen sections were hydrated with PBS for 10 min at RT and stained using Senescence β-Galactosidase staining kit according to manufacturer’s instructions (Cell signaling technology, 9860). The sections were incubated at 37 °C in a dry incubator (no CO2) for 48 h and photographed.
Western blot
Comma D beta cell line87 was kindly provided by Dr. Medina, and was described previously. Comma D beta cell line was cultured in DMEM-F12 (Invitrogen) supplemented with 2% of Fetal Bovine Serum (Hyclone), 1% PSA (Invitrogen), 10 ng/mL EGF(BD) and 5 μg/mL Insulin (Sigma), at 37 °C with 5% CO2. Comma D beta cells were harvested and lysed using 2X Laemmli SDS sample buffer (100 mM Tris pH6.8, 10% glycerol, 4% SDS, 0.01% Bromophenol Blue), and boiled on heat block at 100°C for 15 min. Samples were loaded to 4%–20% precast gradient gel (Bio-Rad) and electrophoresed at 200 v for 45 min, and transferred to Odyssey® nitrocellulose membrane (LI-COR). After being blocked by PBS + 0.1% tween 20 + 5% Non-fat dry milk for 1 h at RT, the membrane was subjected to primary antibody staining beta Actin (Santa Cruz), Rat anti-Bcl11b (abcam, ab18465, 1:1000), Rb anti-IKKβ (Cell signaling technology, 2370, 1:1000), Rb anti-p-IKKα/β (Cell signaling technology, 2697, 1:1000), Rb anti-p-p65 (Cell signaling technology, 3033, 1:1000), Rb anti-p65 (Cell signaling technology, 8242, 1:1000), Mouse anti-IκBα (Cell signaling technology, 9247, 1:1000) at 4 °C overnight. Membrane was washed using PBST (PBS + 0.1% Tween 20) 3 × 10 min, and stained with secondary antibodies HRP-Donkey anti mouse (Cell signaling technology, 7076 S, 1:10000), HRP-Donkey anti rat (Cell signaling technology, 7077 S, 1:1000) or rabbit (Cell signaling technology, 7074 S, 1:1000) at RT for 1 hr. Membrane was subsequently washed 3 × 10 min by PBST and developed using SuperSignal® West Dura Extended Duration Substrate (Thermo Scientific, 34094) and imaged by Gel imaging system (GE, AI680RGB).
RNA extraction and Real-Time PCR
For the TNFα and LPS treatment assay, after starvation for 12 h, pInducer-Bcl11b Comma D beta cells were treated with 50 ng/mL doxycycline for 12 h to induce Bcl11b expression. Cells were then treated 20 ng/mL TNFα or 103 EU/mL LPS-EB for 10 h before lysed by 400 μL Trizol (Life Technologies),. RNA was extracted according to the manufacturer’s instruction with addition of ultrapure glycogen (Thermo Scientific, R0551) as carrier. RNA was reverse transcribed to cDNA using PrimeScriptTM RT reagent kit (TaKaRa, RR037A) according to the manufacturer’s instructions. cDNA was then subjected to the real time PCR for specific gene target by TB Green Premix Ex Taq (TaKaRa, RR420B) according to manufacturer’s instructions using Real Time PCR system (SIS-PCR005, Jena).
For the drug screening assay, Comma D beta cells were treated with Rapamycin (0.1 μM, 1 μM, 10 μM, Selleck, S1039), Dactolisib (0.1 μM, 1 μM, 10 μM, Selleck, S1009), LY2409881 (0.1 μM, 1 μM, 10 μM, Selleck, S7697), BMS-345541 (0.01 μM, 0.1 μM, 1 μM, Selleck, S8044), QNZ (0.01 μM, 0.1 μM, 1 μM, Selleck, S4902), Asprin (1 μM, 10 μM, 100 μM, Selleck, S3017), C188-9 (0.1 μM, 1 μM, 5 μM, Selleck, S8605), SH-4-54 (0.01 μM, 0.1 μM, 1 μM, Selleck, S7337), TPCA-1 (1 μM, 5 μM, 25 μM, Selleck, 2824), Scutellarin (1 μM, 5 μM, 25 μM, Selleck, S3810), IWR-1-endo (0.1 μM, 1 μM, 5 μM, Selleck, S7086), LY411575 (0.1 μM, 1 μM, 10 μM, Selleck, S2714), Vismodegib (0.1 μM, 1 μM, 5 μM, Selleck, S1082) and Sonidegib (0.1 μM, 1 μM, 10 μM, Selleck, S2151) for 24 h. For primary mammary cell validation experiment, CD49fhighEpCAMlowLin- cells from 4 month-old, 14 month-old, 24 month-old WT mice and 4 month-old K14-Cre Bcl11bfl/fl mice were sorted into the 96-well Ultra-Low attachment culture plate (Corning, 3474) (10,000 cells/200 μL/well) and cultured in the culture media (DMEM/F12 + 2% FBS + 1% PSA + 2% B27 + 10 ng/mL EGF + 250 ng/ mL Rspo1 + 10 μM Y27632) with 25 μM TPCA-1 or DMSO for 24 h. DAPI negative cells were then sorted to perform RT-PCR assay.
Data was analyzed by Excel and GraphPad Prism 7.00. The relative gene expression was normalized by β-actin expression. Target gene Sybrgreen primers were designed by IDT (Integrated DNA Technologies) and the primers are listed below: Bcl11b (Exon1-2): Forward ATGCCAGAATAGATGCCGG, Reverse CTCTATCTCCAGACCCTCGTC; Bcl11b (Exon2-4): Forward AGGAGAGTATCTGAGCCAGTG, Reverse GTTGTGCAAATGTAGCTGGAAG; Irak2: Forward TGTCACCTGGAACTCTACCG, Reverse TTTCTCCTGTTCATCCTTGAGG; Tnfrsf1b: Forward ACTCCAAGCATCCTTACATCG, Reverse TTCACCAGTCCTAACATCAGC; β-actin: Forward ACCTTCTACAATGAGCTGCG, Reverse CTGGATGGCTACGTACATGG.
Luciferase assay
Comma D beta cell line which was stably expressed pInducer Bcl11b plasmid and NFκB-inducible Luciferase reporter plasmid was used for this experiment. After starvation for 12 h, cells were treated with Doxycycline (Sigma, D9891) at various doses followed by 20 ng/mL TNFα (Biolegend, 575204), 1 μg/mL LPS-PG (Invivogen, tlrl-ppglps), 103 EU/mL LPS-EB (Invivogen, tlrl-3pelps), and 100 ng/mL PMA (InvivoGen, tlrl-pma) treatment, as indicated. Cells were washed with 1 × PBS and lysed with PLB according to the manufacturer’s instruction for 15 min (Promega, E1910). Cells were transferred to a 96-well plate, 20 μL/well. After added with 100 μL/well LAR II, the sample was measured by the luciferase activity using the microplate reader (Thermo, Varioskan LUX).
Immunofluorescence
For frozen section, mammary gland was dissected and immediately fixed using 4% formalin for 2 hrs followed by PBS washing and 30% sucrose infiltration overnight. The fixed mammary tissue was then embedded in O.C.T. compound (Tissue-Tek) and frozen at −80 °C. Frozen tissue block was sectioned to 14 μm at −35 °C using Cryostat Leica CM3050 S (LEICA). For immunofluorescence assay, frozen sections were rehydrated with PBS for 10 min at RT. Sections were blocked with TBS + 0.1% Triton X-100 + 2% BSA + 10% Donkey serum for 1 hr at RT, and then stained with primary antibody mouse anti-p16Ink4a (Santa Cruz, sc-1661), Rb anti-p65 (Cell signaling technology, 8242), Rat anti-Bcl11b (Abcam, ab18465) 1:200 overnight at 4 °C. After washed by TBST (TBS + 0.1%Triton X-100) three times, sections were stained with secondary antibody Donkey anti-mouse, rat, rabbit 1:200 (Jackson ImmunoResearch) for 1 hr at RT. After 3 × TBST washing and brief 1 μg/mL DAPI staining, sections were mounted with Antifade Mounting Medium (Beyotime).
Immunohistochemistry and HE staining
Mammary tissue was collected and immediately fixed using 4% formalin overnight at 4 °C and dehydrated by gradient ethanol solution (70%, 85%, 95%, 100%). Dehydrated tissue was infiltrated by Xylene solution and embedded with paraffin. Tissue block was sectioned to 5 μm using Rotary Microtome Leica RM2255 (LEICA). Paraffin section was de-paraffinized using Xylene and rehydrated followed by gradient ethanol solution (100%, 95%, 85%, 70%, 0%) and subjected to immunohistochemistry staining according to the Histostain-Plus IHC Kit (NeoBioscience, ENS003.120, ENS004.300). Antigen was retrieved in citrate buffer (10 mM Sodium Citrate, 0.05% Tween 20, pH 6.0) for 20 min at 100 °C in microwave. The sections were treated with 3% H2O2 for 10 min, washed and blocked for 1 h, sections were incubated with Rb anti-p-p65 (Abcam, ab131100, 1:50), Rb anti-Il-6 (NOVUS, NB600-1131, 1:100), Mouse anti-Ssea1 (Abcam, ab16258, 1:200) and Rb anti-Oct4 (Abcam, ab19857, 1:200) overnight at 4 °C. Then sections were washed using TBST, secondary antibody incubation, HPR incubation, DAB incubation, Hematoxylin dyeing, gradient dehydration and mounted by CV5030 CoverSlipper (LEICA). Images were obtained using Eclipse Ti2 inverted microscope (Nikon).
For the HE staining assay, after de-paraffinize and rehydration, paraffin section was stained using ST5020 muti-stainer (LEICA) and mounted by CV5030 CoverSlipper (LEICA).
ChIP-seq
8 × 10⁷ pInducer Bcl11b Comma D beta cells were treated with 100 ng/mL Doxycycline overnight and harvested. Rabbit anti-IgG (Abcam, ab172730) and rabbit anti-Bcl11b (Benthyl laboratories.inc, A300-384A) were used for ChIP-seq pull-down. Briefly, after cross-linked by 1% (wt/vol) formaldehyde solution, cells were quenched by glycine (0.12 M), washed one time with PBS and resuspended in PBS. Cells were lysed using SDS lysis buffer (50 mM Tris-HCl 8.0, 5 mM EDTA 8.0, 0.1%SDS and 1 × protease/phosphatase Inhibitor Cocktail (CST, 5872 S)). Then chromatins were sheared with AFA Focused-ultrasonicator using Covaris ME220 with 70 peak power, 20% duty factor, 14 average power for 3 min at 1 × 10⁷ cells/tube. Add 9 × ChIP dilution buffer (50 mM Tris-HCl 8.0, 167 mM NaCl, 0.11% Triton X-100, 0.11% Sodium Deoxycholate and 1 × protease/phosphatase Inhibitor Cocktail) to the sonicated chromatin. 10% of the slurry was taken as input and 90% sonicated chromatin were divided equally to two parts. The sonicated chromatin was incubated in the cold room overnight with 50 μL protein G-Dynabeads (Invitrogen,10004D) which had been conjugated with 50 μg appropriate IgG or Bcl11b antibody. Beads were then washed with RIPA buffer 1(50 mM Tris-HCl 8.0, 150 mM NaCl, 1 mM EDTA, 1% Triton X-100, 0.1% SDS, 0.1% Sodium Deoxycholate and 1 × protease/phosphatase Inhibitor Cocktail), RIPA buffer 2 (50 mM Tris-HCl 8.0, 500 mM NaCl, 1 mM EDTA, 1% Triton X-100, 0.1% SDS, 0.1% Sodium Deoxycholate and 1 × rotease/phosphatase Inhibitor Cocktail), LiCl buffer (100 mM Tris-HCl 8.0, 250 mM LiCl, 1 mM EDTA, 0.5% NP-40, 0.5% Sodium Deoxycholate and 1× protease/phosphatase Inhibitor Cocktail) and TE buffer (10 mM Tris-HCl 8.0, 1 mM EDTA), and were eluted into 200uL of ChIP direct elution buffer (10 mM Tris-HCl 8.0, 300 mM NaCl, 5 mM EDTA, 0.5% SDS, 0.2% Sodium Deoxycholate). Samples were reverse cross-linked at 65 °C overnight, treated with 4uL RNase A (1 mg/mL) at 37 °C for 30 min, incubated with 1 uL proteinase K (10 mg/mL) at 55 °C for 1 h, and extracted by phenol/chloroform. ChIP DNA library was constructed by VAHTS Universal DNA Library Prep Kit for Illumina V2 (Vazyme, ND606). Briefly, samples were subjected to adapter ligation, ChIP DNA was then amplified 12 cycles and purified using AMpure XP beads (Beckman, A63881) twice and then were submitted for150 bp paired-end sequencing on an Illumina novaseq 6000 platform (Novogene).
Single cell RNAseq library preparation and sequencing
A modified Smart-seq2 protocol was applied for single-cell RNA-seq45,46 according to previously reported protocol. Briefly, single CD49fhighEpCAMlowLin– cell from various age (2,4,9,11,13,15,17,19,22,24, 29 months old) mice or DMBA tumors were directly sorted into 96-well plate containing lysis buffer (0.05 uL RNase Inhibitor (40 U/μL), 0.095 uL 10% Triton X-100, 0.5 uL dNTP (10 mM), 0.1 uL ERCC (3 × 10⁵) and 0.555 uL Nuclease-free water) using FACS. Single cell was immediately lysed at 70 °C for 3 min in the PCR system (TAdvanced 96SG, analytikjena). The sample was reverse transcribed to cDNA using SuperScriptIIreverse transcriptase (invitrogen, 18064-071) with a template switch oligo (TSO) primer and a sample-specific 25 nt oligo dT reverse transcription primer (TCAGACGTGTGCTCTTCCGATCTXXXXXXXX-NNNNNNNN-T25, X representing sample-specific barcode and N representing unique molecular identifier (UMI)). Then the cDNA was amplified by 18 cycles of PCR with 3’P2 primer and IS primer using KAPA HiFi HotStart Ready Mix (Kapa Biosystem, KK2602). After being pooled together and purified by AMpure XP beads (Beckman, A63881) twice, the barcoded DNAs were amplified using biotinylated pre-index primers by 4 cycles of PCR to introduce biotin tags to the 3′ ends of the amplified cDNAs. After purified by AMpure XP beads, cDNA was sonicated to ~300 bp fragments using Covaris ME220. 3’ terminal of the cDNA was enriched using Dynabeads® MyOne Streptavidin C1 beads (Invitrogen, 65001). The RNAseq libraries were constructed using the Kapa Hyper Prep Kit (Kapa Biosystem, KK8504) according to the manufacturer’s instructions. Briefly, after end repair and A-tailing, Streptavidin conjugated DNA was ligated to the appropriate concentration adapter (1:10) (NEB, 7335 L). Then, after USER enzyme treatment and post-ligation cleanup, DNA was amplified with QP2 primer and short universal primer by 6 cycles of PCR and released from the streptavidin beads. Finally, AMpure XP beads were used to purify the DNA and DNA library quality was verified by Fragment Analyzer-12/96 (AATI) and then the DNA library was submitted to 150 bp paired-end sequencing on an Illumina NovaSeq 6000 platform (Novogene).
In vivo ageing clock rescue assay
To test TPCA-1’s (GW683965) (Selleck, S2824)75,76 effect on mammary ageing, 12 month-old virgin female WT mice or 3 month-old K14-cre Bcl11bfl/fl mice were treated by 10 mg/kg TPCA-1 or 4% DMSO in PBS intraperitoneally every day for 30 days. Mammary cells were then dissociated and harvested for single cell RNAseq and pseudotime analysis.
To test BMS-345541 (Selleck, S8044)88 effect on mammary ageing, 3 month-old K14-cre Bcl11bfl/fl mice were gavaged with 35 mg/kg BMS-345541 or 4% DMSO in PBS. Mammary cells were then dissociated and harvested for single cell RNAseq.
DMBA induced tumor formation
Mouse mammary tumors induced by MPA and DMBA assay were performed according to the previous published paper55,56 with minor modifications. Briefly, the cleared fat pad of 3 week-old female mice (C57BL/6) were transplanted with WT or K14-cre Bcl11bfl/fl cells according to the transplantation assay methods described above in the Transplantation session. The recipient mice were implanted subcutaneously with a 50 mg 90 day-release MPA pellet (Innovative Research of America, NP-161-50 mg). Three weeks later, DMBA (200 μL, 5 mg/mL) (Sigma-Aldrich, D3254-1G) was administered by oral gavage 4 times throughout the following 5 weeks at -4, -3, -1, 0 weeks. Tumors were determined by manual palpation. Cancer incidence was calculated by the number of tumor cases within a designated latency period. The latency time was calculated from the last DMBA treatment day. Mice were euthanized before the tumor size reaching 2 cm in diameter according to our animal protocol 19-001-2-CS approved by IACUC (Institutional Animal Care and Use Committee of Westlake University).
To test TPCA-1’s effect on DMBA induced tumor formation, female mice induced by MPA and DMBA, then followed by treatments with 10 mg/kg TPCA-1 or 4% DMSO in PBS intraperitoneally every day for 7 weeks. Tumors were determined by manual palpation. Cancer incidence was calculated by the number of tumor cases within a designated latency period. The latency time was calculated starting from the last DMBA treatment day.
To test the vulnerability of ageing mammary cells to cancer, we transplanted 3 month old young mixed with old mammary cells to syngeneic recipient mice. Briefly, to avoid the influence of the environmental stromal cells, we transplanted 2 month old young mammary cells (wt) with 24 month old mammary cells (with GFP reporter) to syngeneic recipient mice (n = 11) at equal MRUs and induced cancer formation by DMBA treatment. We repeat this experiment with 2 month old young mammary cells (with tdTomato reporter) and 12 month old mammary cells (wt). The recipient mice number is 22.
To test whether basal cells could be the origin of DMBA induced cancer using Krt14rtTA-TetOcre-mTmG mice (n = 33). We first labeled basal cells with doxycycline induction, and then treat mice with DMBA.
Single cell RNA-seq analysis
Raw reads were first processed using TrimGalore (Ver.0.6.7) (https://github.com/FelixKrueger/TrimGalore) to remove adapter sequences with paired end mode and default parameter. Quality control was evaluated with FastQC (Ver.0.11.9) (https://www.bioinformatics.babraham.ac.uk/projects/fastqc/). For each sequencing batch, the top 100 barcode ranked by read counts were retained using whitelist tool in UMI-tools (Ver.1.1.1)89. Then barcode and UMI information were extracted from read2 using extract tool in UMI-tools and added to read1. Subsequently, read1 were aligned to the mm10 genome using STAR aligner with default parameter except for the outFilterMultimapNmax = 1. Mapped reads were assigned to genes using featureCounts89. Finally, we used count tools in UMI-tools to generate count matrix, which the number of UMIs represents the transcript number of each gene within each individual cell.
After getting the count matrix, we applied four criterions to further exclude cells with low data quality: first, cells with barcode not included in the barcode sequence list were removed; second, cells with ERCC percentage larger than 10% or mitochondria percentage larger than 5% were filtered out; third, cells with gene number less than 200 or more than 6000 were removed; lastly, cells with stromal gene (Pecam1, Ptprc, Lyve1, Col1a1) expression level higher than 0.1 were removed. As for gene, we removed those detected in less than 10 cells. Finally, for young and aged single cell RNA-seq assay, 1981 cells passed the quality control. The same filtering criterion was used for K14-Cre Bcl11bfl/fl, tumor and TPCA-1 treatment single cell RNA-seq assay. 149 K14-Cre Bcl11bfl/fl CD49fhighEpCAMlowLin–cells, 310 CD49fhighEpCAMlowLin– tumor cells, 373 DMSO treated and 367 TPCA-1 treated CD49fhighEpCAMlowLin– cells were used for analysis.
We used the Seurat (Ver 4.2.0)90 to carry out the abovementioned filtering, data normalization, and all downstream analysis including dimensionality reduction, clustering, tSNE plot overlaying, and differential gene expression. More specifically, UMI counts in each cell were normalized with NormalizeData function with default parameter and vars.to.regress parameter was used to regress out the cell cycle, ERCC percentage, mitochondria percentage, batch and gene number effect. For dimension reduction, RunPCA function was used and the top 10 principal components were passed to tSNE analysis by RunTSNE function. Finally, clustering was performed by FindNeighbors and FindClusters functions with original Louvain algorithm and the resolution was set to 1.
Single cell trajectory analysis
Single cell trajectory was inferred by Monocle2 (Ver 2.24.1)91. Count matrix was input to Monocle2 and negative binomial distribution was used for building statistical distribution for read counts with lower detection limit set as 0.5. PhenoData was exported from Seurat object. Dimension reduction was done with DDRTree and the effect of Size_Factor, num_genes_expressed, ERCC percentage, mitochondria percentage, cell cycle and batcheffect were regressed out. The root of the pseudo-time trajectory was selected as the most abundant cell state in the cells from the 2 month-old batch. Genes significantly changed along pseudo-time were selected using differentialGeneTest function with qval < 0.05, resulting in 1932 differentially expressed genes. A new count matrix was generated from the original to include only differentially expressed genes. The count matrix was then smoothed using genSmoothCurves function, log transformed using a base of 10 and pseudo-count of 1 to prevent logarithm of zero value. All elements in the transformed count matrix were further truncated by a straightforward way that all elements larger than 3 or smaller than -3 were set as 3 or -3 respectively. Gene hierarchical clustering was performed on the transformed matrix with Heatmap in ComplexHeatmap package92. Genes were clustered into 4 clusters according to gene expression in cells along with pseudo-time increasing. Based on intersecting point of the average expression of genes in each cluster, cells were separated into 4 states. The same pipeline for combined aging & Bcl11b ko data and aging & TPCA-1 treatment data.
Pathway enrichment analysis
All gene symbols were mapped to their Entrez gene ids using biomaRt93,94. Then, both GO and KEGG pathway enrichment analysis were performed by clusterProfiler95. For simplicity, only biological process (BP) terms in GO were used for enrichment analysis. To do GSEA analysis, genes ordered according to decreased foldchange were fed to GSEA function. To do GSEA enrichment of Bcl11b-KO vs WT tumor CD49fhighEpCAMlowLin– cells on 4 state marker genes, marker genes of each state were considered as one pathway. For enriched results from enrichGO, enrichKEGG or GSEA, only pathways with BH-adjusted p-value <0.05 were retained. Pathway activity of each cell was got with AddmoduleScore function in Seurat package90. When showing pathway activity along with pseudotime, the activity was also smoothed with genSmoothCurves function in monocle package91.
Cell cycle state determination
We re-implemented the method previously used in Kowalczyk et al.49 to determine the cell cycle state for each cell. First, filtered count matrix after Seurat was transferred into TPM using calculateTPM function in scater package96 and then log-transformed by log2(TPM + 1). The cycle gene list in human was taken from the previously published paper by Whitfield97. All human gene symbols were transformed to mouse using biomaRt package93,94. Genes were filtered by the correlation with the average gene expression of corresponding cell cycle stage. To retain mammary gland specific cell cycle genes, the correlation threshold was set to 0.25. Finally, we got 14, 13, 21, 19, 13 genes for G1/S, G2, G2/M, M/G1 and S phase, respectively. The average cell cycle gene expression of each stage was calculated. We identified cells with G1/S score < 0 & G2/M < 0 as G0 cells. Other cells were defined as the corresponding stage according to gene maximum expression.
SASP gene score calculation
The SASP gene list in human was taken from the previously published paper by Coppe et al.11. All human gene symbols were mapped to mouse symbols by biomaRt package93,94. Then, the SASP score for each cell were calculated using AddModuleScore function in Seurat package90.
Pathway score and transcription factor activity score calculation in human BRCA
BRCA fpkm data was downloaded with TCGAbiolinks98, in which we only used the paired samples, then pathway score was calculated as mean expression of pathway genes. The result was shown with ggplot2 (https://ggplot2.tidyverse.org). Statistical analysis was performed using two-tailed paired t-tests. To calculate transcription factor activity, we used the transcription factor target genes from Transcription Factor Target Gene Database99.
scEntropy analysis
We compute single cell entropy according to the public paper58,100. Briefly, single cell count expression profile from R was exported as.mat format which can be loaded into MATLAB. For calculating the entropy of cells from different ages, we constructed the gene co-expression network and apply it to Bcl11b ko cells. After computing the entropy of each cell, we visualize these results in R with ggplot2.
Transcription factor activity analysis
We got transcription factor target genes from the following three public databases: ENCODE101, ChEA102, and TRRUST v2103. For each cluster of genes changing along with pseudo-time, TFs were enriched with hypergeometric test which was implemented with phyper function in R. Transcription factor activity was calculated with transcription factor target genes from the combined databases using AddModuleScore function in Seurat package90. To calculate Bcl11b activity score, we did ChIP-seq assay for Bcl11b to find Bcl11b target genes. Based on scRNA-seq of wild type CD49fhighEpCAMlowLin– cells and Bcl11b ko CD49fhighEpCAMlowLin– cells from 4 month-old mice, we got Bcl11b positively regulated genes (genes with pval<0.05, ko <wt intersect with Bcl11b targets) and negatively regulated genes (genes with pval < 0.05, ko > wt intersect with Bcl11b targets). Then Bcl11b activity was computed as weighted average expression of the negatively regulated genes.
ChIP-seq data processing
ChIP-seq reads were trimmed with TrimGalore(https://github.com/FelixKrueger/TrimGalore) with paired end mode and default parameter and QC was done with FastQC(https://www.bioinformatics.babraham.ac.uk/projects/fastqc/). Trimmed reads were aligned to the mm10 mouse genome with bowtie2 (Ver.2.4.2) (https://github.com/BenLangmead/bowtie2) with default parameter. Then, the alignment was filtered using samtools104 with the following parameter: -F 1804 -f 2 -q 30. Duplicated reads were marked with MarkDuplicates in picard-tools (http://broadinstitute.github.io/picard/) and filtered out with samtools. Finally, we found bcl11b binding sites on the genome based on input signal by MACS2 (Ver.2.2.7.1) using following parameter: -f BAMPE -g mm –keep-dup all –nomodel. Bcl11b binding sites were analyzed using ChIPseeker package105. ChIP-seq signals were visualized using Integrative Genomics Viewer (IGV) software106.
Quantification and statistical analysis
Log-rank test was used between WT and K14-Cre Bcl11bfl/fl group tumor formation kinetics by GraphPad Prism 7.00. For limiting dilution analyses, the frequency of mammary repopulating unit was calculated using ELDA software107. Statistical analyses were performed using GraphPad Prism 7.00 with unpaired or paired two-tailed Student’s t-test, as indicated in the figure legends. Bar graphs represent mean ± SD or mean ± SEM, as indicated. The box plots in Figs. 2b, e, f, 3b, l, r, 4k, l, 5i, 7e–g, and Supplementary Fig. 3a–b, 4a–c, 8e, 11d, 12b, 13b–d, 14 show the center line corresponds to the median, the lower and upper lines correspond to the first and third quartiles, and the whiskers extend to 1.5 times IQR (interquartile range), and each dot represents one cell. For Supplementary Fig. 1d–1g, stat_smooth was used to get non-linear regression with method set to loess. Pvalue was added by stat_regline_equation. For Supplemental Data 4, Supplemental Data 5, and Supplemental Data 6, pathways with p.adjust(BH-adjusted) < 0.05 were considered as significantly enriched.
Reporting summary
Further information on research design is available in the Nature Portfolio Reporting Summary linked to this article.
- SEO Powered Content & PR Distribution. Get Amplified Today.
- PlatoData.Network Vertical Generative Ai. Empower Yourself. Access Here.
- PlatoAiStream. Web3 Intelligence. Knowledge Amplified. Access Here.
- PlatoESG. Carbon, CleanTech, Energy, Environment, Solar, Waste Management. Access Here.
- PlatoHealth. Biotech and Clinical Trials Intelligence. Access Here.
- Source: https://www.nature.com/articles/s41467-024-49106-2