Derivation of pESCs using the 4FIXY culture medium
Before generating porcine blastoids, we derived pESCs from parthenogenetic (PA) blastocysts using the new culture medium called 4FIXY. Based on the transcriptomic datasets from porcine early embryonic development29 and published culture medium23,24,25,26, we tested four cytokines activin A, IGF1, IL-6, and sIL-6 Receptor α, and together with some small chemical inhibitors, including WNT signal inhibitors XAV939 and IWR1, and ROCK inhibitor Y27632 to culture pESCs. The resulting pESCs can be passaged at single cells by enzymatic dissociation every 3–4 days at a ratio of 1:3 and form dense colonies with smooth and clear edges (Fig. 1a). Immunofluorescent staining demonstrates that pESCs express pluripotent markers, including POU5F124,25, SOX224,25, NANOG24,25, OTX225,29, and E-Cadherin30,31,32 (Fig. 1b). During long-term culture, pESCs retain positive alkaline phosphatase (AP) staining signal and normal karyotypes (Fig. 1c, d). Furthermore, pESCs can form embryonic bodies (EBs) and differentiate into three germ layers in vitro (Fig. 1e, f). In immunodeficient mice, pESCs formed teratomas with derivatives of endoderm, mesoderm, and ectoderm germ layers in vivo (Fig. 1g). These results indicate that we have successfully derived pESCs under the 4FIXY culture condition.
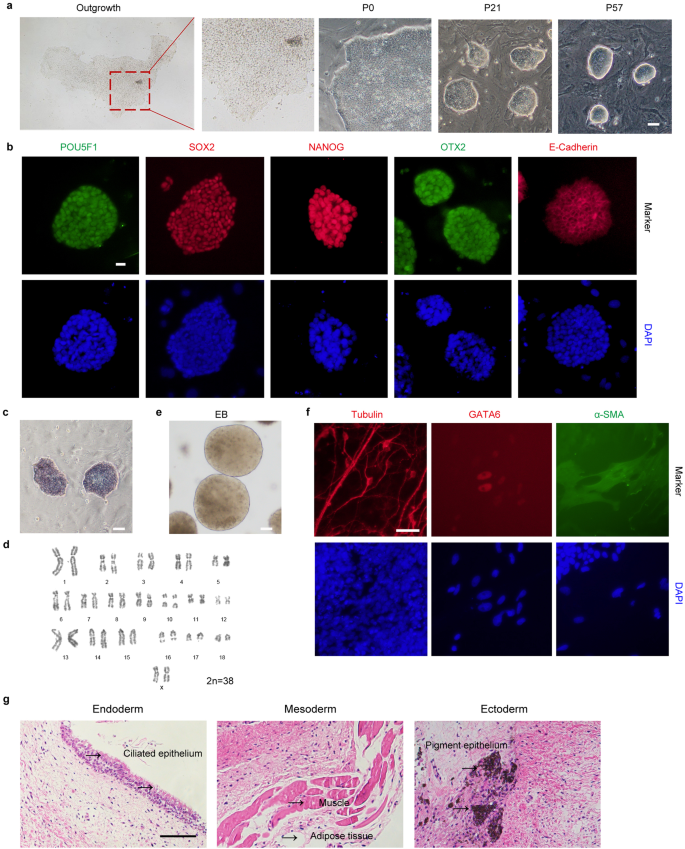
a Representative morphology of porcine outgrowths and pESCs. Scale bar, 50 μm. b Representative immunofluorescent staining for pluripotency markers, including POU5F1, SOX2, NANOG, OTX2, and E-Cadherin. Scale bar, 20 μm. c AP staining of pESCs. Scale bar, 50 μm. d Karyotypes analysis of pESCs. e Representative morphology of EB. Scale bar, 50 μm. f Representative immunofluorescent staining for the ectoderm marker Tubulin, mesoderm marker α-SMA, and endoderm marker GATA6. Scale bar, 50 μm. g Hematoxylin and eosin staining of pESCs-derived teratomas. Scale bar, 100 μm.
We also performed bulk RNA-sequencing (RNA-seq) of pESCs and compared these cells to those in the single-cell data during early embryogenesis (oocyte–E14). The results show that pESCs are close to a cluster of E9–E11 cells, which highly express epiblast markers (POU5F1 and SOX2) (Supplementary Fig. S1a). We then performed real-time quantitative PCR to examine the gene expression profile of the core, primed, and naïve pluripotent markers. The results show that core (i.e., POU5F1, SOX2, and NANOG) and primed (i.e., OTX2, DNMT3A, LIN28A, and NODAL) pluripotency marker genes are expressed in pESCs, while naïve pluripotent marker genes (i.e., TBX3, TFCP2L1, STAT3, and KLF17) are minimally expressed (Supplementary Fig. S1b). These data indicate that the pESCs are in the primed pluripotent state.
Efficient generation of blastoids with pESCs
To test whether pESCs can be assembled in vitro into blastoids, we first examined their ability to differentiate into extra-embryonic lineages, including trophectoderm (TE) and hypoblast (HYPO). To this end, we established a new culture condition (hence called induced blastoid (iBlastoid) medium) to culture pESCs for 3 days. We found that EPI-, TE- and HYPO-like cells (ELCs, TLCs, and HLCs) gradually emerged (Supplementary Fig. S2a). Immunofluorescent staining showed that GATA3- and GATA6-positive cells representing TLCs and HLCs, respectively, can be identified (Supplementary Fig. S2b). GATA3- and GATA6-positive cells are both observed in the same view with SOX2-positive cells (ELCs) (Supplementary Fig. S2b). These results indicate that pESCs possess the potential to differentiate in vitro into extra-embryonic lineages, a prerequisite for blastoid generation.
We then attempted to reconstruct porcine blastoids in a 3D culture condition (Supplementary Fig. S2c). First, we prepared the iBlastoid medium, including cytokines LIF, activin A, IGF1, IL-6, and sIL-6 Receptor α based on the expression dataset of porcine early embryonic development29. We also used CHIR99021, SB431542, TSA, and BMP4 to support the derivation of TLCs24,33. Additionally, activin A, bFGF, and CHIR99021 were applied in the medium as they contribute to the differentiation of HLCs11. In a one-step process, pESCs were digested into single cells and directly seeded into ultra-low attachment multiple well plates at the indicated cell numbers under the iBlastoid medium. We showed that porcine blastoids containing a blastocele-like cavity, an EPI-like compartment, and an outer TE-like layer merged gradually on days 5–7 (Supplementary Fig. S2d). Immunofluorescent staining showed the expression of three major lineage markers, including EPI marker SOX2, HYPO marker GATA6, and TE marker CDX2 in these blastoids (Supplementary Fig. S2e). The proportion of SOX2-positive blastoids is between 18.4% and 34% (Supplementary Fig. S2f).
To improve the efficiency of porcine blastoid generation, we modified and developed a more robust 3D two-step method (Fig. 2a; Supplementary Fig. S2f). In this two-step induction process, pESCs dissociated into single cells were seeded into ultra-low attachment multiple well plates in 4FXY medium (4FIXY minus IWR1) to form cell clusters on days 1–2; cell clusters were then maintained in iBlastoid medium for the following 3–5 days (Fig. 2a). The proportion of SOX2-positive blastoids ranges from 25.9% to 55% (Supplementary Fig. S2f). In iBlastoid medium, cell clusters gradually formed the blastocele-like cavity, EPI-like cells, and TE-like layers (Fig. 2b). In vitro-derived blastoids on day 6 are morphologically similar to porcine PA blastocysts at E6 and E7 (Fig. 2c). The efficiency of porcine blastoid formation ranges from 4.95% to 29.68% (Fig. 2d). Additionally, the diameters of porcine blastoids (mean, 183 μm) are similar to porcine PA blastocysts at E6 (mean, 192 μm), which are both smaller than E7 blastocysts (mean, 224 μm) (Fig. 2e). The X/Y ratio of porcine blastoids is approximately equal to 1, which indicates the round shape of blastoids and is equivalent to that of porcine blastocysts at E6 and E7 (Fig. 2f). Taken together, we show that porcine blastoids can be generated efficiently from pESCs in a 3D system.
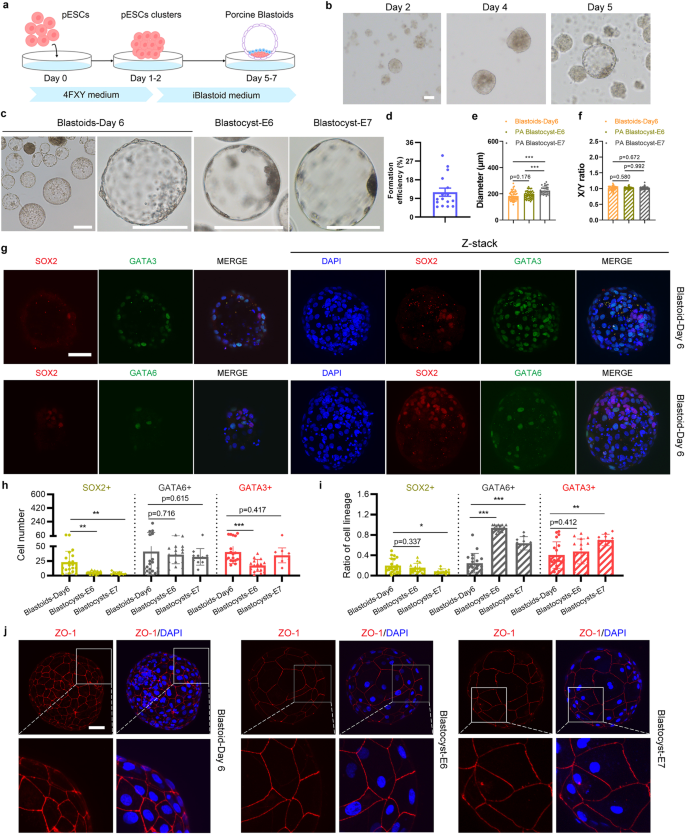
a Schematic of porcine blastoid formation from pESCs using a 3D two-step method. b Representative images of cell clusters and blastoids at the indicated time points during porcine blastoid formation. Scale bar, 50 μm. c Representative images of porcine E6 and E7 PA blastocysts and blastoids generated from pESCs on day 6 using a 3D two-step method. Scale bars, 200 μm. d Formation efficiency of pESCs-derived blastoids (n = 16). Formation efficiency indicates the ratio of blastoids over all aggregates. e The diameter of porcine blastoids (n = 53) and porcine PA blastocysts at E6 (n = 50) and E7 (n = 33). The diameter was calculated by ImageJ. f The X/Y ratio of porcine blastoids (n = 53) and porcine PA blastocysts at E6 (n = 50) and E7 (n = 33). g Representative immunofluorescent staining for EPI marker SOX2, TE marker GATA3, and HYPO marker GATA6 in pESCs-derived blastoids. Scale bars, 50 μm. h Cell numbers of the individual lineage of per porcine blastoid (n = 19) and porcine PA blastocysts at E6 (n = 16) and E7 (n = 10). i The ratio of the individual lineage of per porcine blastoid (n = 19) and porcine PA blastocyst at E6 (n = 16) and E7 (n = 10). j Representative immunofluorescent staining for tight junction marker ZO-1 in porcine blastoid and porcine PA blastocysts at E6 and E7. Scale bar, 50 μm. *P < 0.05; **P < 0.01; ***P < 0.001. The P values were calculated using unpaired t-tests.
Porcine blastoids exhibit characteristic features of blastocysts
To explore whether reconstructed porcine blastoids contained the characteristic three lineages of blastocysts, we performed immunofluorescent staining to detect markers for EPI (SOX2)25,29, HYPO (GATA6)25,29, and TE (GATA3)25,29 and showed that porcine blastoids contain these cells (Fig. 2g). We also confirmed additional markers for EPI (POU5F1)25,29, HYPO (GATA4)25,29, and TE (CDX2)25,29 in porcine blastoids (Supplementary Fig. S3). Notably, EPI (SOX2, POU5F1) and HYPO (GATA6, GATA4) markers were mainly expressed in the inner cells, and TE markers GATA3 and CDX2 were expressed in the outer cells (Fig. 2g; Supplementary Fig. S3). Then, we calculated the cell numbers and ratio of these three cell lineages in porcine blastoids. The blastoids contain more cells than E6 and E7 PA blastocysts. Compared to E6 blastocysts, these porcine blastoids contain more ELCs and TLCs, while the proportions of ELCs and TLCs are comparable to E6 blastocysts (Fig. 2h, i). The numbers of HLCs are similar, while the ratio of HLCs in blastoids is lower than that in E6 blastocysts (Fig. 2h, i). Compared to E7 blastocysts, cell numbers and proportions of ELCs are both higher. HLCs and TLCs numbers are similar while their ratio is lower than that in E7 blastocysts (Fig. 2h, i). Intercellular tight junctions between the TLCs of blastoids can be detected by immunofluorescent staining of ZO-1 (Fig. 2j). Taken together, our data demonstrate that the pESCs-derived blastoids display characteristics similar to porcine blastocysts.
Single-cell transcriptomics of porcine blastoids
To determine the transcriptional profiles of porcine blastoid-derived cells, we performed single-cell RNA sequencing (scRNA-seq) from two samples (Fig. 3a). Uniform manifold approximation and projection (UMAP) analysis revealed that porcine blastoid-derived cells were divided into 13 clusters (Supplementary Fig. S4a). We identified ELCs, HLCs, and TLCs using known signature markers such as SOX2 and POU5F1 for ELCs; GATA6 and GATA4 for HLCs; and GATA3 and GATA2 for TLCs (Fig. 3b, c; Supplementary Fig. S4b). Clusters were assigned to the most likely cell type based on two key criteria: the percentages of cells expressing the marker genes within the cluster and the scaled average expression level. Cell clusters revealed specific expressions of different lineage markers. Cluster 5 expresses SOX2 and POU5F1 and represents ELCs; clusters 7 and 10 express GATA6 and GATA4 and are regarded as HLCs; seven clusters (0–4, 6, 12) express GATA3 and GATA2 and are annotated as TLCs (Fig. 3b; Supplementary Fig. S4a). For clusters 8, 9, and 11, where the percentages were < 50% and the scaled average expression level was below 0.1 for all the marker genes, and determining the most likely cell type was challenging. Thus, these clusters were excluded. Each of the porcine blastoid lineages showed distinct gene expression patterns that are similar to their corresponding lineage in porcine embryos (Fig. 3d, e; Supplementary Fig. S4c). For instance, known EPI genes25,29 (DNMT3B, ETV5, ZIC2) are specific to the ELC cluster. HYPO gene NID225,29 is specific to the HLC cluster; another HYPO gene COL4A125,29, is highly expressed in the HLC cluster. Known TE genes25,29 (KRT8, SFN) are most highly expressed in TLC clusters (Supplementary Fig. S4d, e). We then assessed the resolving power by clustering with different parameter combinations. Except for a few combinations where the resolution is too low to distinguish some small cell populations, most parameter combinations consistently produce results in defining cell types (Supplementary Fig. S5). These results confirm the presence of EPI-, HYPO-, and TE-like lineage cells in the porcine blastoids.
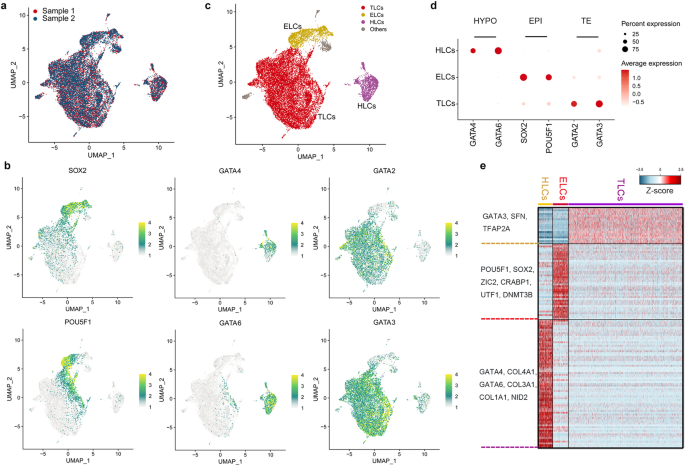
a UMAP representation of two sample distributions for porcine blastoids. b UMAP showing expression of EPI markers (SOX2, POU5F1), HYPO markers (GATA4, GATA6), and TE markers (GATA2, GATA3). c Cells derived from porcine blastoids are colored by origin: ELCs (yellow), HLCs (purple), and TLCs (red). d Dot plot indicating EPI markers (SOX2, POU5F1), HYPO markers (GATA4, GATA6), and TE markers (GATA2, GATA3). e Heatmap representing the expression of cell lineage-specific genes in ELCs, HLCs, and TLCs.
Next, we asked whether the porcine blastoids derived from pESCs resemble porcine blastocysts at the transcriptome level. We carried out integrated analysis with single-cell transcriptomes derived from porcine oocytes and embryos at different stages25. Principal component analysis (PCA) revealed that blastoid-derived cells can be mapped close to blastocyst cells (Fig. 4a). To further evaluate the similarities between lineage cells from blastoids and blastocysts, we employed two comparison methods for integrated analysis, which can unbiasedly and quantitatively benchmark the blastoid-derived cells. In pig early embryonic development, the first lineage segregation is initiated at E5; the second lineage segregation begins at E6 and ends at the E7 stage25,29; EPI then transits to ectoderm from E10 to E1125, demonstrating that three lineage cells, including EPI, TE, and HYPO, are well segregated at E7, E8, and E9. Therefore, to investigate the correlation between blastoids and blastocyst-derived cells for all three lineages (ELCs with EPI, TLCs with TE, and HLCs with HYPO), single-cell transcriptomes of porcine embryos at E7, E8, and E9 were chosen to perform integrated analysis (Fig. 4b). We identified EPI, HYPO, and TE using markers SOX2 and POU5F1 for EPI; GATA6 and GATA4 for HYPO; and GATA3 and GATA2 for TE (Fig. 4c–e; Supplementary Fig. S6a). We then performed UMAP analysis and showed that ELCs, TLCs, and HLCs in blastoids overlap with their EPI, TE, and HYPO counterparts from blastocysts, respectively (Fig. 4f). Additionally, we utilized scPred34, an accurate supervised cell-type classification method to classify blastoid-derived cell types based on E7–E9 embryo datasets. Blastoid-derived cells were projected onto the E7–E9 embryo datasets that were classified into lineages of EPI, HYPO, TE, and undefined clusters. scPred predicted that 91%, 85%, and 54% of blastoid-derived cells possessed EPI, HYPO, and TE lineage characteristics, respectively, in their corresponding lineage group (Supplementary Fig. S6b). Overall, these results suggest that pESCs-derived blastoids possess the three characteristic lineages and, thus, very similar transcriptomic features to in vivo physiological embryos, i.e., blastocysts.
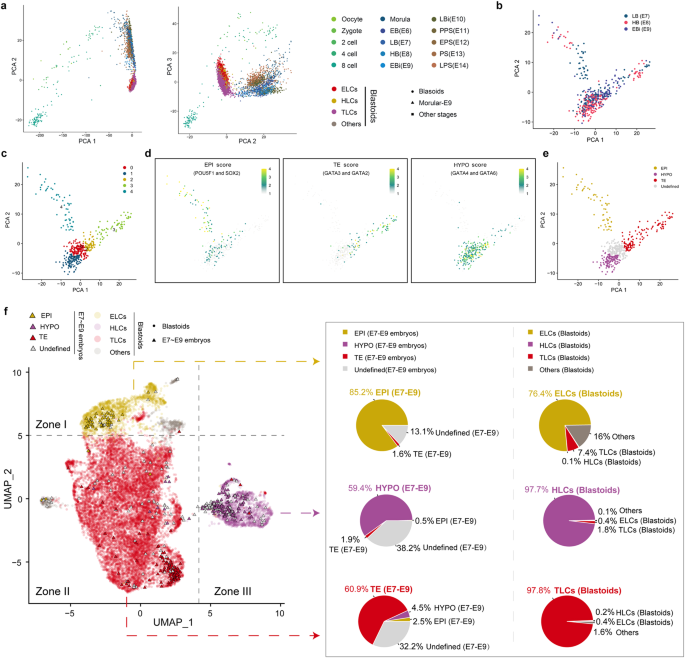
a PCA of porcine blastoids and embryos25. EB (early blastula, E6), LB (late blastula, E7), HB (hatched blastula, E8), EBi (early bilaminar embryo, E9), LBi (late bilaminar embryo, E10), PPS (pre-primitive streak embryo, E11), EPS (early primitive streak embryo, E12), PS (primitive streak embryo, E13), and LPS (late primitive streak embryo, E14). b PCA of LB, HB, and EBi. c PCA analysis showing that porcine embryos25 at E7–E9 included five clusters. d Expression scores of EPI (POU5F1 and SOX2), TE (GATA2 and GATA3), and HYPO (GATA4 and GATA6). e Cells derived from porcine embryos are colored by origin: EPI (yellow), HYPO (purple), and TE (red). f UMAP plot of porcine blastoid cells integrated with published porcine embryo cells25 and a pie chart showing the percentages of three lineage cells. The percentages 85.2%/59.4%/60.9% are calculated by dividing the number of EPI/HYPO/TE lineage cells by the number of embryo-derived cells in zone I/II/III, respectively. Similarly, the percentages 76.4%/97.7%/97.8% are calculated by dividing the number of ELCs/HLCs/TLCs by the number of blastoid-derived cells in zone I/II/III, respectively.
Derivation of stem cells from porcine blastoids
We then ask whether we can derive stem cells from these blastoids as we did from blastocysts, as shown in Fig. 1a. To this end, we show that porcine blastoids support de novo derivation of ESCs in the same culture condition and TSCs in the indicated medium (Fig. 5a). The outgrowths from blastoids can be formed and pESCs generated with compact colonies (Fig. 5b) that are positive for AP staining and express pluripotent markers, including POU5F1, E-Cadherin, SOX2, NANOG, SSEA4, and β-Catenin (Fig. 5c, d). Using a TSC medium, porcine TSCs (pTSCs) can also be established and express TE marker GATA3 (Fig. 5e, f). Collectively, these results suggest that these blastoids are amenable to stem cell derivation as blastocysts.
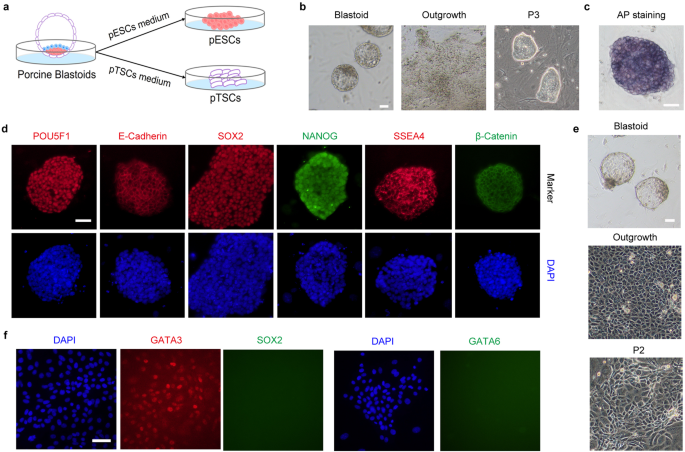
a Illustration of the establishment of pESCs and pTSCs from blastoids. b Representative morphology of outgrowth and pESCs derived from blastoids. Scale bar, 50 μm. c AP staining of pESCs derived from blastoids. Scale bar, 50 μm. d Representative immunofluorescent staining for pluripotent markers POU5F1, SOX2, NANOG, SSEA4, β-Catenin, and E-Cadherin in blastoids-derived pESCs. Scale bar, 50 μm. e Representative morphology of outgrowth and pTSCs derived from blastoids. Scale bar, 50 μm. f Representative immunofluorescent staining for GATA3, SOX2, and GATA6 in TSCs. Scale bar, 50 μm.
Prolonged culture of porcine blastoids
We then explore the possibility of these blastoids growing and developing in vitro. To the best of our knowledge, the IVC approach of porcine embryos has not been established. According to IVC systems of bovine and ovine embryos22,35, we modified these culture conditions and developed N2B27 + AY medium for blastoid culture. The iBlastoid medium was also used for in vitro prolonged culture. Porcine blastoids on day 6 (denoted as porcine blastoid IVC day 0) with EPI-like cells and apparent cavity were chosen for in vitro prolonged culture. When IVC of porcine blastoids continues to day 18, we can see cavities of blastoids that continue to survive and expand, accompanied by an increased size of blastoids (Fig. 6a, b). The diameters of porcine blastoids range from 234 to 1707 μm (mean, 722 μm) in N2B27 + AY medium, compared to 171 to 1234 μm (mean, 384 μm) in iBlastoid medium on day 18 (Fig. 6c). The survival ratios of blastoids are 27.31% and 49.07% in N2B27 + AY and iBlastoid medium, respectively, on day 6, and decline to 1.72% and 2.96%, respectively, on day 18 (Fig. 6d). As controls, porcine PA blastocysts grow for about 6 and 8 days in N2B27 + AY and iBlastoid medium, respectively, before becoming smaller as IVC days progress (Fig. 6e–g), indicating that the culture conditions are not yet to be optimal for pig embryos.
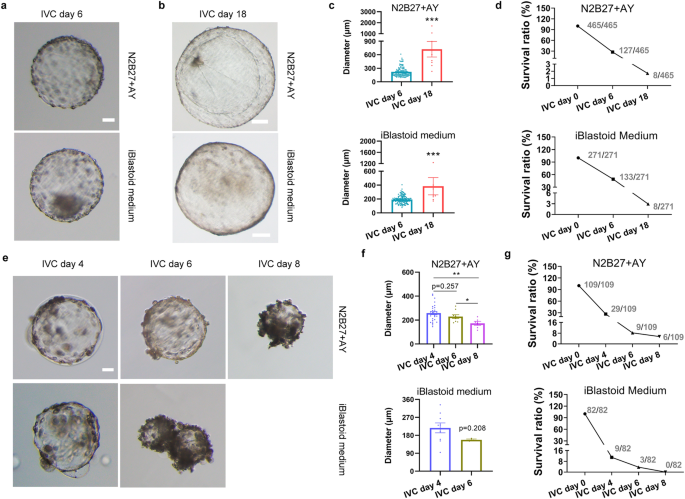
a Representative morphology of in vitro cultured blastoids on day 6. Scale bar, 50 μm. b Representative morphology of in vitro cultured blastoids on day 18. Scale bars, 200 μm. c The diameters of in vitro cultured blastoids. The diameter was calculated by ImageJ. ***P < 0.001. The P values were calculated using unpaired t-tests. d The survival ratio of in vitro cultured blastoids. e Representative morphology of in vitro cultured porcine PA blastocysts on days 4, 6, and 8. Scale bar, 50 μm. f The diameters of in vitro cultured porcine PA blastocysts. The diameter was calculated by ImageJ. *P < 0.05; ** P < 0.01. The P values were calculated using unpaired t-tests. g The survival ratio of in vitro cultured porcine PA blastocysts.
Generally, mouse and human embryos undergo a series of developmental stages, including pre-implantation, implantation, and gastrulation. Implantation starts before gastrulation36. However, in porcine early embryo development, conceptus TE first initiates elongation and rearrangement on days 11–12 of gestation. Gastrulation then starts, followed by implantation, which is very different in mice and humans36. The elongation is characterized by trophoblast morphological rearrangement and transition through four distinct morphological stages, including spherical, ovoid, tubular, and filamentous forms37. In this study, IVC blastoids exhibit spherical shapes (Fig. 6a, b, e), indicating that the developmental stage occurs on days 8–10 of gestation before elongation. As embryos on days 8–10 of gestation contain three lineage cells (EPI, HYPO, and TE), we performed immunofluorescent staining of the three lineage markers (SOX2 for EPI, GATA6 for HYPO, and GATA3 for TE) in IVC blastoids. The results show that IVC blastoids on day 18 contain SOX2, GATA3, and GATA6-positive cells (Supplementary Fig. S7). Overall, these results indicate that the blastoids have the potential to survive and expand in vitro prolonged culture.
- SEO Powered Content & PR Distribution. Get Amplified Today.
- PlatoData.Network Vertical Generative Ai. Empower Yourself. Access Here.
- PlatoAiStream. Web3 Intelligence. Knowledge Amplified. Access Here.
- PlatoESG. Carbon, CleanTech, Energy, Environment, Solar, Waste Management. Access Here.
- PlatoHealth. Biotech and Clinical Trials Intelligence. Access Here.
- Source: https://www.nature.com/articles/s41421-024-00693-w