Genetically engineered mouse models
All mouse strains are reported: aP2-Cre69, R26-tdTomato (#7914), The Jackson Laboratory (JAX)70, Pax3Pax3-Foxo1 26, Cdkn2aFlox (Nabeel Bardeesy71), Fabp4-Cre (#5069, The Jackson Laboratory)72, Tek-Cre35, Myf6-Cre73. For Kaplan-Meier survival analysis, animals were observed from birth and sacrificed at humane endpoints, such as showing signs of obvious tumor burden or other distress. Maximal tumor size/burden permitted by the SJCRH Institutional Animal Care and Use Committee is 2 cm3, maximal tumor size/burden was not exceeded in this study. Full necropsies were performed. All mice had consistent access to food and water and were housed at ambient temperature (20–25 C) and humidity (40–60%) with 12-h light/12-h dark cycles. All animal experiments were reviewed and approved by the SJCRH Institutional Animal Care and Use Committee.
Cell lines
293T (Martine Roussel, SJCRH) cells were maintained in DMEM (#SH32043, HyClone) supplemented with 10% fetal bovine serum (FBS, HyClone) and 1% antibiotic/antimycotic. HUVECs (LifeLine Cell Technologies, FC-0044) were maintained in VascuLife VEGF Endothelial Medium Complete Kit (LifeLine Cell Technologies, LL-0003). Primary HUVECs were immortalized by retroviral transduction with large T (genomic) antigen (#1778, Addgene, Bob Weinberg) and telomerase reverse transcriptase (pBABE-hygro-hTERT) (#1773, Addgene)74. BJFF.6 Human iPSCs were maintained in mTeSR Plus (Stemcell Technologies, 100–0276) on growth factor reduced Matrigel basement membrane matrix (Corning, 354230). All cell lines were maintained in a humidified incubator at constant 37 °C and 5% CO2.
Molecular cloning and viral transduction
pSIN-EF2-IRES-mCherry was generated by PCR amplifying mCherry from pmRi-mCherry (Clontech, #631119) using oligonucleotides adding 5’ NdeI (5’-GGGCATATGGTGAGCAA GGGCGAGG-3’) and 3’ ClaI (5’-GGGGATCGATCTAGTTTCCGGACTTGT-3’) restriction sites digesting the PCR product with NdeI and ClaI and ligating to similarly digested pSIN-EF2-IRES-Blast75. pcDNA-PAX3-FOXO1 (Rene Galindo) was subcloned into the pSIN-EF2-IRES-mCherry lentiviral vector. Plasmids encoding shRNAs were generated by ligating annealed overlapping oligonucleotides targeting the breakpoint of PAX3;FOXO1 (shP3F) (5’- CCGGTCTCACCTCAGAATTCAATTCCTCGAGGAATTGAATTCTGAGGTGAGATTTTTG-3’ and 5-’AATTCAAAAATCTCACCTCAGAATTCAATTCCTCGAGGAATTGAATTCTGAGGTGAGA-3’) and Firefly Luciferase (shLuc) (5’- CCGGCTTACGCTGAGTACTTCGACTCGAGTCGAAGTACTCAGCGTAAGTTTTTG-3’) and (5’- AATTCAAAAACTTACGCTGAGTACTTCGACTCGAGTCGAAGTACTCAGCGTAAG-3’) to AgeI and EcoRI digested pLKO.1-puro (#8453, Addgene) to generate pLKO.1-shP3F-puro and pLKO-shLuc-puro. The resulting plasmids were digested with KpnI and SpeI to excise the puromyocin resistance gene and ligate to a similarly digested EGFP fragment from pLKO.3G (#14748, Addgene) generating the pLKO-shP3F-EGFP and pLKO-shLuc-EGFP plasmids. The pLKO-shP3F-EGFP and pLKO-shLuc-EGFP plasmids were co-transfected with packaging plasmids pMD2.G VSV-G envelope (#12259, Addgene) and psPAX2 packaging vector (#12260, Addgene) into 293 T cells with FuGENE6 (Promega #E2691) according to manufacturer’s protocol. iPSCs were transduced with conditioned EGM Bullet Kit media containing viral particles after filtering (0.22 µM).
Generation of p53KO BJFF.6 iPSCs
hTP53-/- BJFF.6 iPSCs were generated using CRISPR-Cas9 technology. Briefly, BJFF.6 iPSCs were pretreated for 1 h in StemFlex (Thermo Fisher Scientific) supplemented with 1X RevitaCell (Thermo Fisher Scientific). Approximately 1X10⁶ cells were nucleofected (Lonza, 4D-Nucleofector™ X-unit) with precomplexed ribonuclear proteins (RNPs) consisting of 150 pmol of chemically modified sgRNA (5’ UCCUCAGCAUCUUAUCCGAG 3’; Synthego), 50 pmol of Cas9 protein (St. Jude Protein Production Core), and 500 ng of pMaxGFP (Lonza) in a small (20 µl) cuvette using solution P3 and program CA-137 according to the manufacturer’s recommended protocol. Cells were sorted five days post nucleofection for single cells by FACS at the Flow Cytometry and Cell Sorting Shared Resource (St. Jude) for transfected (GFP+) cells and plated into prewarmed (37C) StemFlex media supplemented with 1X CloneR (Stem Cell Technologies) into Vitronectin XF (Stem Cell Technologies) coated 96-well plates. Clones were screened for out-of-frame indels via targeted deep sequencing on a MiSeq Illumina sequencer as previously described76. Briefly, gene specific primers (TP53.F-5’ CTACACGACGCTCTTCCGATCTGGC GCTGCCCCCACCATGAG 3’ and TP53.R- 5’ CAGACGTGTGCTCTTCCGATCTCTGGAGGG CCACTGACAACCACCCT 3’) with partial Ilumina adaptors (upper case) were used to amplify the region flanking the gRNA target site and then indexed by nested PCR with primers containing the remainder of the Ilumina adaptors (Indexing primer F- 5’ AATGATACGGCGA CCACCGAGATCTACACX6ACACTCTTTCCCTACACGACGCTCTTC 3’ and Indexing primer R-5’ CAAGCAGAAGACGGCATACGAGATX10GTGACTGGAGTTCAGACGTGTGCTC 3’; indexes shown as “X”s). Samples were demultiplexed using the index sequences, fastq files were generated, and NGS analysis of clones was performed using CRIS.py77. Knockout clones were identified, expanded, and sequence confirmed. Cell identity was authenticated using the PowerPlex® Fusion System (Promega) performed at the Hartwell Center (St. Jude) and tested negative for mycoplasma by the MycoAlertTMPlus Mycoplasma Detection Kit (Lonza).
Histology and IF
Dissected tissues were submerged in ice cold PBS. Frozen sections were prepared by fixing tissues 2 h in 4% paraformaldehyde (PFA) at 4 °C and cryoprotecting in 30% Sucrose, 2 mM MgCl2. Muscle and tumors were snap frozen in 2-methyl-butane cooled in liquid nitrogen prior to sectioning using a conventional cryostat. Formalin-fixed paraffin-embedded (FFPE) sections were prepared by fixing tissues in 10% neutral-buffered formaldehyde (NBF) prior to paraffin embedding. Hematoxylin and eosin (H&E) and immunohistochemistry staining were performed using standard procedures. Antibodies and antigen retrieval conditions are listed in Supplementary Data 1. Images captured on Leica DMi Thunder Imager inverted fluorescent microscope.
Myogenic differentiation assay
Mononuclear cells were isolated from SCM of adult (>8-week-old) mice as previously described22 and plated on 0.1% gelatin then grown until confluent in DMEM (#SH32043, HyClone) supplemented with 10% FBS (HyClone) and 1% PSA (#A5955, Sigma). Once confluent, cells were rinsed twice with PBS then cultured with DMEM (#SH32043, HyClone) supplemented with 2% horse serum and 1% PSA (#A5955, Sigma). Differentiated iPSCs were plated on 0.1% gelatin then grown until confluent in EGM BulletKit (CC-3124, Lonza) supplemented with 20 ng/mL bFGF (AF-100-18B, PeproTech), 1 µM CHIR-99021 (13122, Cayman Chemical), and 20 ng/mL VEGF (100-20, PeproTech) then transferred to LHCN diff media. Following differentiation, cells were fixed in 4% PFA for 15 min and immunofluorescence was performed according to standard techniques previously described22 using antibodies listed in Supplementary Data 1. Images captured on Leica DMi Thunder Imager inverted fluorescent microscope.
Flow cytometry and fluorescence-activated cell sorting
Muscle was dissected and digested as previously described22, then stained for flow cytometry prior to analysis with a BD Biosciences Symphony analyzer for flow cytometry analysis and a BD Biosciences Aria cell sorter for cell sorting. In brief, muscle was mechanically and enzymatically digested in a solution of 2 U/mL Collagenase B (#11088831001, Roche), 2 U/mL Dispase II (#04942078001, Roche), 50 mM HEPES/KOH pH 7.4, and 150 mM NaCl for one hour at 37 °C, and cultured cells were lifted and dissociated with accutase (A1110501, ThermoFisher) for 5 min at 37 °C. Cells were then sterile filtered to single-cell suspensions and stained in 5%FBS/PBS on ice using antibody dilutions provided in Supplementary Data 1. DAPI was used as a live/dead cell marker. Flow cytometry analysis for endothelial differentiation markers shown in Supplementary Fig. 9f was performed on a Cytek Aurora spectral analyzer and was analyzed with SpectroFlo. All other flow cytometry analyses were collected using a BD Biosciences Symphony analyzer and analyzed with FlowJo.
Cardiotoxin Muscle Injury
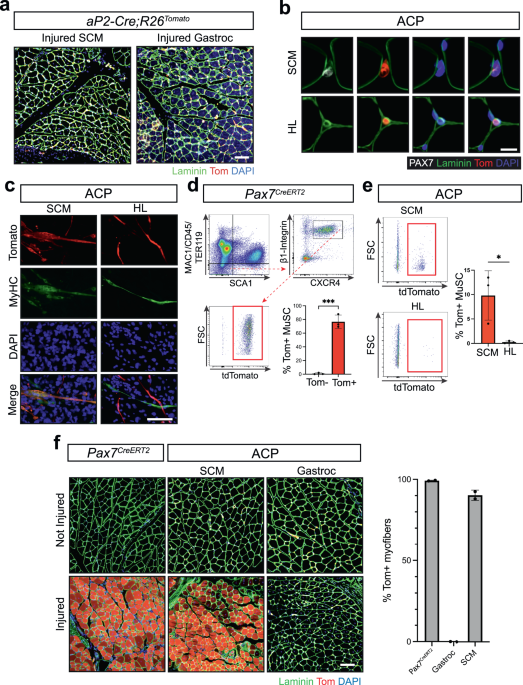
Gastrocnemius and SCM of 8-week-old mice was injured by injection with a 27 gauge needle with 100 µl and a 30 gauge needle with 50 µl of 10 µM cardiotoxin from Naja mossambica mossambica (C9759-5MG, Sigma), respectively. Muscle was dissected 28 days post injury then fixed and stained as described above. Antibody information listed in Supplementary Data 1.
Immunoblotting
SDS-PAGE and subsequent immunoblotting were performed with standard procedures previously described in30. Briefly, protein lysates of cells and tissues were prepared using RIPA lysis buffer with 1X PPIC (#11697498001, Roche and #4906845001, Roche). Protein concentration was determined using a BCA (#23225, Pierce) and equally loaded lysates were resolved using SDS-PAGE. Blot were incubated overnight at 4 °C using primary antibodies listed in Supplementary Data 1. Membranes were then washed and proved with the species-specific secondary antibody conjugated to HRP. Protein bands were visualized using chemiluminescent luminol (sc-2048, Santa Cruz Biotechnology).
RNA isolation and gene expression analysis
Total RNA was isolated from tissues or cells using miRNEasy mini kit (#217004, Qiagen) and from sorted cell populations using a miRNEasy micro kit (#217084, Qiagen) according to the manufacturer’s instructions. Superscript III First Strand Synthesis using random hexamer primers (#18080051, ThermoFisher) was used to synthesize first-strand cDNA. Real-time PCR was performed utilizing SYBR primers listed in Supplementary Table 1 and normalized to 18S ribosomal RNA control (#4308329, ThermoFisher Scientific). Relative quantity of genes of interest was determined using the ΔΔCT. RNA sequencing was performed on purified RNA using the Illumina NovaSeq6000 genome sequencing system. Paired end sequencing was used for 100 base pair reads.
Bulk RNAseq data analysis
(Sequence alignment, differential gene expression analysis, GSEA)
Mouse and human sequences were mapped to the mm10 and hg38 genomes, respectively, using the STAR aligner78. Gene level quantification was determined using RSEM79 and based on GENCODE annotations M22 (for mouse samples) or Human Release 31 (for human samples), respectively. Non-coding and GENCODE level 3 genes were excluded. Differential gene expression was modeled using the voom method80, available in the Limma R software package. Normalization factors were generated using the TMM method. Voom normalized counts were analyzed using the lmFit and eBayes functions in Limma. The false discovery rate (FDR) was estimated using the Benjamini-Hochberg method. Gene set enrichment analysis (GSEA) was performed using curated signatures from MSigDB. Ranking of genes was calculated using negative log10(p-value)*log2(fold change), and a P-value for each gene set was estimated by comparing the observed enrichment score to that obtained from a null distribution computed from 1000 permutations of genes within gene sets. FDR was estimated as previously described81. For gene ontology (GO) in Tek-Cre;R26-tdTom RNA-seq (Supplementary Fig. 2f), Enrichr was used to determine JENSEN tissue terms82,83,84. Functional annotation clustering by the Database for Annotation, Visualization, and Integrated Discovery (DAVID, 2021 version) was used for GO analyses. We used GOTERM_BP_FAT selection for functional annotation clustering and present the top ten unique GO terms visualized and represented as the -log10Pvalue.
Single-cell RNAseq
Mononuclear cells were dissociated from muscle or tumor and live tomato-positive cells collected by FACS in ice-cold 0.04% BSA (#A7159, Sigma-Aldrich) in PBS. Single cells were washed with 0.04% BSA in PBS and counted on a Countess II automated cell counter (ThermoFisher). 16,000 cells were loaded per lane on the 10x Chromium platform and processed using manufacturers protocol for cDNA synthesis and library preparation. Quality checks were performed using the Agilent 4150 TapeStation and Agilent Bioanalyzer before sequencing with NovaSeq6000 (Illumina).
Single-cell RNAseq analysis
We used Cell Ranger v.4.0.1 pipeline (10x Genomics) with default parameters to aligned raw reads to the GRCm38 Ensembl 97 genome (mm 10) and to generate raw gene-barcode matrices. We use Seurat (version 4.0.6, R version 4.1.0) to perform merging, thresholding, normalization, principal component analysis, non-linear multidimensional reduction, clustering analysis, visualization and differential gene expression analysis85. Quality filtering was conducted by excluding low-quality or doublet outlier cells with values beyond 3x Median Absolute Deviation (MAD) from the median in the QC metrics of nFeature_RNA, nCount_RNA or mitochondria count per cell and removing genes expressed in less than 3 cells. To identify the integration of anchor genes among the samples, the FindIntegrationAnchors function was used with default parameters. Using Seurat’s IntegrateData function, samples were combined into one object. Data were normalized using the SCTransform function and then principal component analysis (PCA) was used to reduce the dimensionality of this dataset. The number of relevant dimensions was determined by ElbowPlot function, and these PCs were summarized further using Uniform Manifold Approximation and Projection (UMAP). For cell clustering, we used highly variable genes selected using FindVariableFeatures function with default parameters. In addition, nCount_RNA and percentage of mitochondrial genes were considered as the source of unwanted variability and were regressed out. Clustering was conducted using the FindNeighbors and FindClusters functions with original Louvain algorithm and a resolution parameter of 0.2. Differential gene expression analysis was performed by the FindAllMarkers function in Seurat. Clusters were annotated using markers genes found in the literature in combination with differentially expressed genes. We used PanglaoDB Augmented 2021 and CellMarker Augmented 2021 through Enrichr to assign cell cluster identity82,83,84. We use Seurat methods (DimPlot, FeaturePlot, VlnPlot, DoHeatmap etc.) or custom functions for data visualizations including UMAP, feature plot, violin plot and heatmap. Additional Note: Due to suboptimal QC metrics in some samples/analyses, performed additional manual cell filtering with arbitrary cutoffs.
Supplementary Fig. 1j: CAB-2829, retain cells with minimum 1000 detectable genes per cell and at least 2500 UMI counts per cell. Supplementary Fig. 1m: CAB-3347, retain cells with minimum 1000 detectable genes per cell per cell.
Gene lists used for conserved RMS cell states displayed in Fig. 4 and Supplementary Fig. 5 are mouse orthologs of the genes listed in Supplementary Table S2 of Wei et al.43. This list of murine genes is provided as Supplementary Data 22.
Cell dynamics were analyzed using scVelo (version 0.2.4)41 package implementation in Scanpy (version 1.7.2)86. The spliced / unspliced count matrix was generated by Velocyto (version 0.17.17)87 and was import to Scanpy_AnnData object. Then cell barcodes, clusters and UMAP embeddings were imported from Seurat object. Then the data was then processed using default parameters following Scanpy scVelo implementation. In short, the samples were pre-processed using scVelo functions for filtering and normalization using scv.pp.filter_and_normalise and followed by scv.pp.moments function. We used scv.tl.recover_dynamics function to recover the full splicing kinetics of specified genes. The gene specific velocities were then calculated using scv.tl.velocity with dynamic mode, and scv.tl.velocity_graph functions and visualized using scv.pl.velocity_graph function. For Partition-based graph abstraction (PAGA) analysis88, we used Scanpy scVelo implementation function scv.tl.paga with default parameters and scv.pl.paga function for velocity-driven PAGA analysis and plotting PAGA graph with velocity-directed edges.
Nuclei isolation and cleavage under targets and release using nuclease (CUT&RUN)
Live tumor cells were isolated from bulk TCP and MCP tumors by enzymatic digestion and FACS as described above. Nuclei were isolated by incubating cells in Nuclear Extraction Buffer (NEB) which consists of 20 mM HEPES KOH pH7.9, 10 mM KCl, 0.1% Triton X-100, 20% Glycerol, EDTA-free Protease Inhibitor (11836170001, Roche) and water for 10 min on ice. Aliquots of 250,000 nuclei were spun down then resuspended in nuclear extraction buffer and slowly frozen at −80 °C in a Mr. Frosty freezing container (C1562, Sigma-Aldrich).
CUT&RUN was performed using the CUTANA ChIC/CUT&RUN kit (14-1048, EpiCypher) and each reaction used 250,000 nuclei. All buffers except for the bead activation buffer, which was from the CUTANA ChIC/CUT&RUN kit, were made by our lab. In brief, concanavalin A beads (ConA, 14–1048, EpiCypher) were activated with bead activation buffer (14–1048, EpiCypher). Frozen nuclei were quickly thawed at 37 °C and bound to activated ConA beads then transferred to antibody buffer, which is comprised of 20 mM HEPES pH 7.5, 150 mM NaCl, 0.5 mM Spermindine, EDTA-free Protease Inhibitor (11836170001, Roche) 0.0008% Digitonin (#16359, Cell Signaling), and 2 mM EDTA in water. Antibodies were added and incubated on nutator overnight at 4 °C. Next, nuclei were washed with cold digitonin buffer, 20 mM HEPES pH 7.5, 150 mM NaCl, 0.5 mM Spermindine, EDTA-free Protease Inhibitor (11836170001, Roche) 0.0008% Digitonin (#16359, Cell Signaling), and CUTANA pAG-MNase was added then washed with digitonin buffer. 100 mM CaCl2 was added to activate MNase to cleave target chromatin. After two hours, stop buffer comprised of 340 mM NaCl, 20 mM EDTA, 4 mM EGTA, 50ug/ml RNAse A, and 50 ug/ml Glycogen in water, was added. CUT&RUN-enriched DNA was then purified using CUTANA ChIC/CUT&RUN kit (14–1048, EpiCypher). Libraries were prepared with the xGen ssDNA & Low-Input DNA Library Prep Kit (#10009859, IDT) and quantified using the Agilent 4150 TapeStation and Agilent Bioanalyzer before sequencing with NovaSeq6000 (Illumina).
CUT&RUN analysis
Paired-end CUT&RUN-seq reads were aligned first to the E. coli reference genome using bowtie89(version 1.2.2) in paired-end with parameters -k 1 –best and –un to retain unmapped reads. Because of nonbiological variability among samples, the numbers of E. coli reads were not used for cell-number-normalization hereafter. Retained non-E. coli reads were then mapped to the mouse reference genome (mm10) or human reference genome (hg38) using bowtie in paired-end mode with parameters -p 20 -k 2 -m 2 –best. A BAM file containing CUT&RUN-seq fragments was computationally created from each aligned read-pair using samtools sort -n, bedtools bamToBed -bedpe, a manual conversion from BEDPE to BED3, and bedtools bedToBam. For display, the reference genomes were binned into 50 bp windows using bedtools makewindows, and coverage of those bins by fragments was calculated using bedtools intersect -c. Fragment coverage was normalized per million mapped fragments, converted to bedGraph using bedGraphToBigWig, converted to wiggle using bigWigToWig, converted to TDF using igvtools toTDF, and then visualized in the IGV90(version 2.16.2.) browser in hg38 for human samples.
MACS1.491 was used to identify regions significantly enriched in CUT&RUN-seq reads. Prior to peak-calling, individual reads from each paired-end alignment were discarded if they overlapped the ENCODE-defined Problematic Regions list92 corresponding to the reference genome in use, and further filtered in mouse if they overlapped the region chr1:24611436-24616256, because of an observed genomically amplified region in all samples near the Col19a1 gene. Retained reads were used for peak-calling against each sample’s corresponding, identically processed, control IgG. In mouse, parameters –keep-dup = auto and –p 0.001 were used; in human, parameters –keep-dup=auto and -p 1e-9 were used. To compare TCP vs. MCP coverage at regions of interest, we collapsed peaks called separately in each sample (N = 3 TCP and N = 4 MCP in mouse) using bedtools merge. Bedtools closest -t first was used to annotate each peak with the name of the gene whose transcript has the nearest transcription start site from mm10_refGene.gtf downloaded from the UCSC Genome Browser. Individual read coverage in each of the seven samples was separately quantified using bedtools intersect -c. For comparative analyses (Fig. 5c), read coverage in each sample was normalized to the millions of mapped reads (RPM), and the average RPMs from each condition were calculated. For statistical analysis (Fig. 5d) of differential coverage, raw reads from the three TCP samples and three representative MCP samples (MCP20_1, MCP20_2, and MCP_38) were used as input for DEseq2. Peaks were considered differentially covered if they had DEseq2 adjusted log2 fold-change >1 or <−1 and adjusted p value of 0.05.
We used ROSE51 (https://bitbucket.org/young_computation/rose) to separately identify super-enhancers from each sample of MCP, TCP, Day 15 Untransduced p53KO iPSC, and Day 15 Lenti-P3F transduced p53KO iPSC CUT&RUN-seq data targeting H3K27ac, as previously described93. Each sample was separately processed with its corresponding IgG. For each sample, we used MACS1.4 to identify two sets of peaks from each read set filtered as above. In mouse, we used parameter sets –keep-dup=auto –p 0.001 and –keep-dup=all –p 0.001; in human, we used parameter sets –keep-dup=auto -p 1e-9 and –keep-dup = all -p 1e-9. These two peak sets from each sample were collapsed into a per-sample set of peaks using bedtools merge; these collapsed peaks were used as input for ROSE with parameters -s 12500 -t 1000.
Regions displayed in Fig. 5e and f were created from the collapsed union of super-enhancers for MCP (n = 4) and TCP (n = 3). Coverage of these collapsed regions in each condition was separately quantified using bedtools intersect -c. For comparative analyses, we followed the same strategy described in peak-based comparative analyses to normalize read coverage in each sample to the millions of mapped reads (RPM), and the average RPMs from each condition were calculated. The DESeq2 package48 and its standard parameters was used to identify statistically differential coverage of super-enhancers between TCP and MCP replicates, by using three TCP samples and three representative MCP samples (MCP20_1, MCP20_2, and MCP_38). Significantly differentially covered super-enhancers met two thresholds: adjusted P-value = 0.05 and absolute log2Fold change (MCP/TCP) > 1. After collapsing, super-enhancers were assigned to the single gene with a transcript whose start site from the mm10_refGene.gtf gene list is nearest the center of the collapsed super-enhancer using bedtools closest.
To determine if enhancers or super-enhancers were specifically activated to drive specific gene sets of known function, we performed Gene Set Enrichment Analysis (GSEA). DESeq2 log2FC(MCP/TCP) tables associated with collapsed enhancers (Fig. 5d) or collapsed super-enhancers (Fig. 5f) were used as raw table for preparing inputs for GSEA Preranked (version 4.3.2)94. Each enhancer/super-enhancer is associated with a gene, so a single gene could have multiple ranked loci associated with it on the raw DESeq2 log2FC(MCP/TCP) tables mentioned above. The single representative enhancer/super-enhancer for each gene was selected as the one with the highest absolute DESeq2 log2FC(MCP/TCP). These ranked genes were analyzed for their enrichment using the Gene Ontology hallmarks collection in MSigDB95. We used parameters minSize=15, maxSize = 500, nperm=1000 for collapsed peaks GSEA Preranked analysis, and minSize=1, maxSize = 2500, nperm=1000 for pre-ranked log2FC(MCP/TCP) from collapsed Super-Enhancers GSEA Preranked analysis.
Motif enrichment analysis
We performed a motif enrichment analysis in putative enhancers using AME (Analysis of Motif Enrichment)96. A list of transcription factors associated with the endothelial lineage was built from literature analysis and is available as (Supplementary Data 29). We selected the Mus musculus-sourced endothelial TF motifs PWMs (Position-Weight Matrix) from the CIS-BP 2.00 database97 corresponding to these TFs. Coordinates of putative enhancers were defined as above using CUT&RUN-Seq from MCP or TCP cells with only the parameter set -p 0.001 –keep-dup=auto. For each transcript from mm10_refGene.gtf, its putative promoter region was defined as +/− 2 kb from the TSS (Transcription Start Site); we used bedtools subtract to remove sections of H3K27ac peaks defined as above that overlap these promoters because H3K27ac marks both active promoters and enhancers. The sequences of these remaining regions were acquired using bedtools getfasta and the mm10 reference genome. AME was then used to identify the statistically enriched TF motif hits within the sequences of these putative enhancer regions, with the command ‘ame –control –shuffle– –method fisher’.
HiC
Live tumor cells were isolated from bulk TCP and MCP tumors by enzymatic digestion and FACS as described above. HiC and library preparation was performed on 500,000 cells per replicate using reagents and protocol from the Arima-HiC Kit (#A510008, Arima). Libraries were quantified and quality check was performed using the Agilent 4150 TapeStation and Agilent Bioanalyzer before sequencing with NovaSeq6000 (Illumina).
HiC Analysis
For display of HiC interaction frequencies, paired-end reads of 150 bp were processed by Juicer (v1.5, default parameters)98 based on mm10 and Arima fragmentation (cut sites GATC or GANTC). Each replicate was processed separately using default parameters (every replicate got >500 M pairs as >360 M contacts). We required MAPQ score greater than 30 for generating.hic file and downstream analysis. Reproducibility have been confirmed by visual inspection.
For genome-wide comparisons of contact frequencies, we applied HiC-Pro (v 2.11.1)99 to perform read alignment, read filtering, quality check, and contact matrix building as described with default parameters unless otherwise specified below. The two replicate paired-end FASTQ files from each condition were separately pooled, and to achieve improved performance, we split these pooled FASTQ files into multiple subsets, each with a maximum of 10 million read pairs, which were used as input for HiC-Pro in parallel mode. HiC-Pro was configured so that each end of the read pair was mapped independently to the mm10 reference genome using bowtie2 (v2.3.5.1)100. For global and local alignment, we used the options “bowtie2 –very-sensitive -L 30 –score-min L,−0.6,−0.2 –end-to-end –reorder” and “bowtie2 –very-sensitive -L 20 –score-min L,−0.6,−0.2 –end-to-end –reorder” respectively. For read mapping, we used MAPQ threshold=10 and removed multi-mapped reads (RM_MULTI = 1) and duplicated read pairs (RM_DUP = 1). Taking the final valid read pairs generated from HiC-Pro as input, we used the “hicpro2juicebox.sh” utility script to create a HiChIP contact map in “.hic” format. The bin intervals files fastq.matrix from HiC-Pro outputs were combined as RelevantBins matrices between TCP and MCP at 5Kb, 10Kb, 100Kb, and 1 Mb bin sizes. The TCP and MCP connectivity RelevantBins combined matrices were used for generating the scatterplot of TCP and MCP in Fig. 5a.
Scatterplots comparing MCP vs. TCP connectivity were assembled from aligned HiC data utilizing the ggplot2 package in R101. All bin-pairs with at least one read connecting them were used as an input for a matrix that describes connectivity across experiments. Reads connecting pairs of bins (bin-pairs) were plotted. A subset of points was highlighted if either of the bins comprising a bin-pair overlapped a preselected gene of interest by at least 1 bp. Hoxa9 and Hoxa11 are within both the same 1MB bin and the same 10 kb bin, so they are assigned the same color.
Endothelial Differentiation Assay
We generated high-purity endothelial cells from patterned mesoderm from p53KO BJFF.6 human induced pluripotent stem cells following the protocol described by the Murry laboratory102. Here, iPSCs were directed to differentiate to hemogenic mesoderm with the addition of RPMI based media supplemented with 50 ng/mL activin A (#338-AC, R&D Systems) and 1xB-27 without insulin (#A18956-01, Life Technologies). The next day, cells were transferred to RPMI media with 40 ng/mL BMP4 (#314-BP, R&D Systems), 1 µM CHIR-99021 (#13122, Cayman Chemical), and 1xB-27 without insulin (#A18956-01, Life Technologies). To differentiate the cells to the endothelial lineage, media was transferred to StemPro-34 (#10639-011, Life Technologies) supplemented with 4×10⁻⁴ M 1-Thioglycerol (MTG, #M6145-25 mL, Sigma-Aldrich), 2mM L-glutamine (#25030-081, Life Technologies), 50ug/mL L-Ascorbic acid 2-phosphate sesquimagnesium salt hydrate (#A8960-5G, Sigma-Aldrich), 10 ng/mL BMP4 (#314-BP, R&D Systems), 5 ng/mL bFGF (AF-100-18B, PeproTech), and 300 ng/mL VEGF (#100-20, PeproTech) and left for 72 h. The end of this incubation is designated as day 5, and cells were transduced with a lentiviral vector with P3F or empty in EGM BulletKit (#CC-3124, Lonza) supplemented with 20 ng/mL VEGF (#100-20, PeproTech), 20 ng/mL bFGF (AF-100-18B, PeproTech), and 1 µM CHIR-99021 (#13122, Cayman Chemical) containing 8ug/mL polybrene (#TR-1003, Sigma-Aldrich) and 10 µM Y27632 (#1254, Tocris Bioscience). Lentiviral media was changed on transduced cells 18 h after. Non-transduced cells are referred to as control (CNTL). Cells were maintained on 0.1% porcine gelatin (#G1890-500G, Sigma) coated plates in supplemented EGM from day 5 to day 14. A modification to the published protocol, we used accutase (#A1110501, ThermoFisher Scientific) instead of 2.5% (vol/vol) trypsin, to improve cell viability after plating.
Endothelial tube formation assay
12-well cell culture plates (#3513, Corning) were coated with 250 µl matrigel basement membrane matrix (#354234, Corning) and hardened in incubator at 37 °C for 30 min. Endothelial differentiated p53KO iPSCs were dissociated with accutase (#A1110501, ThermoFisher Scientific) and resuspended in supplemented EGM 100,000 cells were plated per well and monitored for tube formation from 4 h to 8 h after plating.
Viability assay
Viability of endothelial differentiated CNTL, +empty and +P3F iPSCs was assessed with CellTiterGlo assays (#G7570, Promega) performed according to the manufacturer’s protocol. Luminescence was measured on a BioTek Synergy 2 with BioTek’s Gen51.11 software.
Focus Formation
Transformed P3F expressing p53KO iPSCs were plated at a density of 1 x 10⁵ cells per well of a gelatin coated six-well dish 17 h after transduction with shP3F or shLuc expressing lentivirus. Cells were grown for 10 days in supplemented EGM and then fixed in methanol prior to staining with 0.02% crystal violet staining solution (0.2 g of crystal violet dissolved in 100 mL of a 2% ethanol solution) for 10 min at room temperature (#C581-25, Fisher Scientific). Wells were washed in deionized water 3 times and allowed to air dry overnight before imaging. Foci were counted by hand.
Teratoma Assay
p53WT and p53KO iPSCs were detached from plates and resuspended in mTeSR Plus (Stemcell Technologies, 100-0276) then counted and spun down. Cells were resuspended in matrigel basement membrane matrix (#354234, Corning) at a concentration of 4×10⁶ cells per 100 µl and kept on ice. SCID beige mice were injected with a 25-gauge needle with 100 µl iPSCs in Matrigel into their gastrocnemius.
Statistical Analyses
Data analyses were performed using Microsoft Excel, GraphPad Prism (version 9.3.1), and the R software packages. Sample size and replicates are listed in the text or Figure legends. All error bars are reported as mean ± SEM. Unless otherwise mentioned, statistical significance was determined using Students t-test for pairwise comparisons (*P < 0.05, **P < 0.01, ***P < 0.001, ****P < 0.0001). Flow cytometry analyses were performed on a BD FACSAria sorter and FlowJo 10.8.1.
Reporting summary
Further information on research design is available in the Nature Portfolio Reporting Summary linked to this article.
- SEO Powered Content & PR Distribution. Get Amplified Today.
- PlatoData.Network Vertical Generative Ai. Empower Yourself. Access Here.
- PlatoAiStream. Web3 Intelligence. Knowledge Amplified. Access Here.
- PlatoESG. Carbon, CleanTech, Energy, Environment, Solar, Waste Management. Access Here.
- PlatoHealth. Biotech and Clinical Trials Intelligence. Access Here.
- Source: https://www.nature.com/articles/s41467-023-43044-1