Production of OLFM4− cells in the early phase of organoid reconstruction from single OLFM4+ cells
To understand the cellular heterogeneity of CRC, we established PDOs from the tumor tissue developed in the ascending colon of a chemotherapy naïve patient with stage IV CRC (HCT25-1T). The organoid harbored APC (R216*), TP53 (IT123T), KRAS (G13D) and MSH6 (R1035*) mutations11. We partitioned this PDO into five clusters, including stem-like, TA-like, and differentiated cell-like clusters, using single cell RNA sequencing (scRNA-seq) analysis as described previously11. OLFM4 was identified as a stem cell marker, and OLFM4+ cells exhibited self-replication and multi-differentiation potentials. We established PDOs harboring the internal ribosome entry site-enhanced green fluorescence protein (IRES-EGFP)-P2A-inducible Caspase 9 (iCas9) cassette (EiC) in the 3’-untranslated region (UTR) of the OLFM4 locus11,12. OLFM4+ cells were identified by their EGFP expression, and BB homodimerizer, a cell-permeable ligand that dimerizes iCas9, selectively eliminates OLFM4+ cells13. The cell clusters were dissociated into single cells and sorted using fluorescence-activated cell sorting (FACS), and EGFP+ cells were embedded in Matrigel (Fig. 1a). On days 3, 6, and 9 after plating, the cells were collected and EGFP expression was analyzed. On day 3, the percentage of EGFP+ cells was reduced from 71.8% to 46.1%, which recovered to 75.7% on day 6 and decreased further to 31.0% on day 9 (Fig. 1b). Similar results were obtained with PDOs established from a different chemotherapy naïve patient with CRC, HCT45-1T (Fig. 1c), which harbored APC (R481*) and TP53 (H140HI) mutations11. It is less likely that the increased number of EGFP– cells in the early phase of the reconstitution process was caused by self-replication of EGFP– cells, because their organoid formation efficiency was approximately six times lower than that of EGFP+ cells11. These observations suggest that a subset of OLFM4− cells were produced in the early phase of organoid construction.
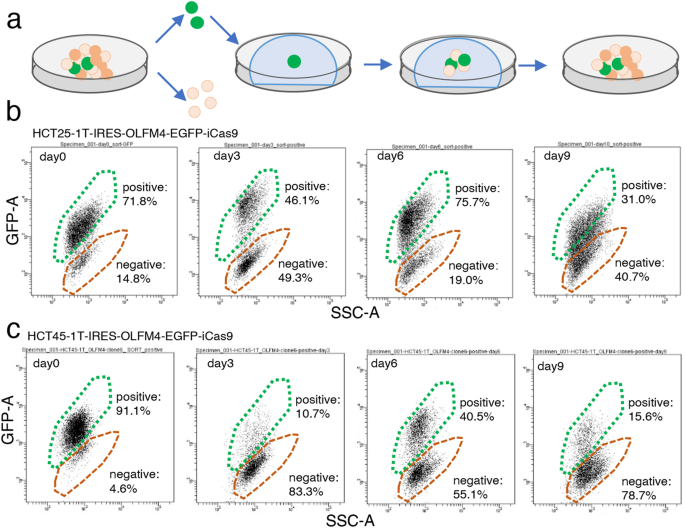
a Schematic representation of the experimental design. Patient-derived organoids (PDOs) established from a patient with advanced colorectal cancer (CRC) containing the internal ribosome entry site-enhanced green fluorescence protein (IRES-EGFP)-P2A-inducible Caspase 9 (iCas9) cassette in the 3’-untranslated region (UTR) of the OLFM4 gene were dissociated into single cells. EGFP+ cells were sorted, cultured, and collected at 3, 6 and 9 days. Fluorescence-activated cell sorting (FACS) analysis of organoid reconstruction. Two PDOs established from different patients with CRC, HCT25 (b) and HCT45 (c), were analyzed. Representative figures of three independent experiments are shown.
Cellular heterogeneity of PDOs reflects the composition of normal intestinal tissue
To analyze the cell types or states during organoid reconstitution, cells were collected on days 0, 3, 6, and 9 after plating and profiled using scRNA-seq analysis. The cells were partitioned into six groups via unbiased clustering of combined timepoint data, and visualized using uniform manifold approximation and projection (UMAP) (Fig. 2a). The majority of OLFM4+ cells were associated across two clusters, clusters 1 and 2. The cells in these clusters also expressed leucine-rich repeat-containing G-protein coupled receptor 5 (LGR5), which confirmed the presence of stem-like cell clusters (Fig. 2b). Investigation of differentially expressed genes (DEGs) for each cluster identified UBE2C and CCNA2 as marker genes for cluster 1 (Fig. 2c). Analysis of the Molecular Signatures Database revealed that gene sets related to the cell cycle and mitosis were positively and negatively enriched in clusters 1 and 2, respectively (Supplementary Fig. 1). These expression profiles indicated that OLFM4+ cells were classified into mitotically active and inactive states.
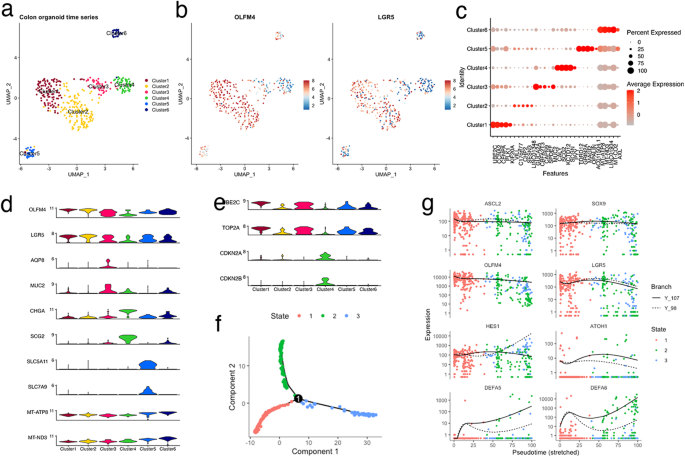
a Cell-type clusters. Fluorescence-activated cell sorting (FACS)-sorted EGFP+ cells of HCT25-1T harboring the internal ribosome entry site-enhanced green fluorescence protein (IRES-EGFP)-P2A-inducible Caspase 9 (iCas9) cassette in the 3’-untranslated region (UTR) of the olfactomedin 4 (OLFM4) locus were plated, and organoids were collected at indicated days. Media were exchanged on days 0, 3, and 6. Single-cell RNA sequencing (scRNA-seq) data on days 0, 3, 6, and 9 were combined and cell clusters were visualized using uniform manifold approximation and projection (UMAP). Colors indicate the six clusters. b Expression level of OLFM4 and LGR5 plotted on UMAP. The color key from blue to tangerine indicates the relative gene expression levels from low to high. c Average expression level of the top 5 differentially expressed genes. The color of each dot represents the average expression level, and the size of each dot represents the ratio of positive cells for each gene. d, e Violin plot showing the expression level of canonical marker genes of intestinal cells (d) and cycling and senescent cells (e). f Pseudotime trajectory analysis indicating the state of all cells from the six clusters. Predicted stem-like cells are in red, absorptive-like cells are in blue, and secretory lineage-like cells are in red. g Cells in each cluster plotted on pseudotime trajectory analysis.
To further define clusters, the expression of canonical marker genes in adult intestines and cell cycle was examined (Fig. 2d, e)4,14. The goblet cell makers, AQP8 and MUC2, and enteroendocrine cell markers, CHGA and SCG2, were specifically upregulated in clusters 3 and 4, respectively. Absorptive enterocytes were partitioned into cluster 5 based on the expression of SLC5A11 and SLC7A. Cells in cluster 6 exclusively expressed higher levels of mitochondrial genes, suggesting that they were dying or of low quality. Overall, these analyses demonstrated that OLFM4+ cells produce principal absorptive and secretory lineage cells that constitute the normal intestinal tissue.
Cellular lineage of organoids established from single OLFM4+ cells recapitulate the cell specification program of normal intestinal tissues
Trajectory inference analysis revealed three cellular states with bifurcating lineages (Fig. 2f). Cells in state 1 mainly contained clusters 1 and 2, suggesting a stem-like cell state (Supplementary Fig. 2). Cells in clusters 3 and 4 were assigned to state 2, whereas those in cluster 5 were assigned to state 3. These data suggest that the trajectory arose from stem-like cells (state 1), which separated into secretory (state 2) and absorptive enterocyte lineages (state 3). This cellular lineage faithfully recapitulates the cellular differentiation hierarchy of the normal human colon15.
Intestinal cell specification is controlled by the hierarchical expression of lineage-specific transcription factors5. ASCL2 and SOX9 are direct target genes of WNT signaling and function to maintain stem cells by repressing differentiation16. In CRC-derived PDOs, these transcription factors and the stem cell markers OLFM4 and LGR5 remained relatively constant among states (Fig. 2g), representing the constitutive activation of WNT signaling by bi-allelic APC truncation mutations of this organoid11.
HES1 and ATOH1 were upregulated in states 3 and 2, respectively (Fig. 2g), suggesting that the bilateral inhibition of Notch signaling controls cellular specification in advanced CRC. Secretory cell lineage markers and the transcription factors involved in secretory cell lineage specification were preferentially expressed in state 2 (Supplementary Fig. 3a)5,17,18. The kinetics of the endocrine cells varied (Supplementary Fig. 3b), reflecting the multiple subtypes of this lineage18. Tuft cell marker DCLK1 and its transcription factor, POU2F3, were preferentially expressed in state 3 cells (Supplementary Fig. 3c). These observations are consistent with a recent study reporting that tuft cells are specified outside the ATOH1-dependent secretory lineage19. Overall, the data from the trajectory inference analysis of reconstituting organoids provide evidence that advanced CRC-derived PDOs contain multiple cell types that resemble those observed in the normal intestine, and that key transcription factors that control cellular specification are largely conserved.
Induction of Paneth-like cells during organoid reconstitution
Subsequently, we focused on the alterations in cellular composition during organoid reconstitution from single OLFM4+ cells (Fig. 3a). Enrichment plots showed that cells in clusters 3 and 4 were rarely detected on day 0, but comprised 62.5% of the cells on day 3. DEGs between days 0 and 3 contained well established secretory lineage cell marker genes, including CHGA, INSM1, and NEUROG3 (Fig. 3b). These observations indicate that the cell fate determination program shifted toward the secretory lineage after single-cell dissociation.
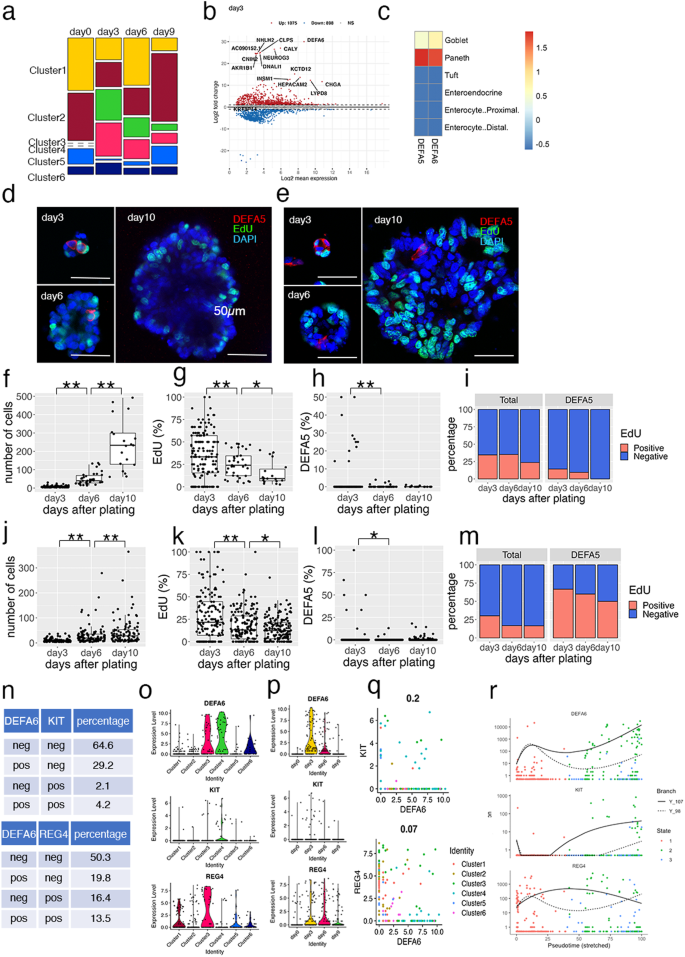
a Enrichment plot showing the altered proportions of clusters during organoid culture. Cell-type clusters were determined using uniform manifold approximation and projection (UMAP) as shown in Fig. 2a; the proportions of each cluster are shown. b MA plot showing the top 15 most significant differentially expressed genes (DEGs) between days 0 and 3 after single cell plating. c Overlap of DEGs of defensin alpha 5 (DEFA5)- and DEFA6-expressing cells and gene markers of intestinal epithelial cells. The scale indicates the scaled −log10 (p value). d, e Representative images of immunofluorescent staining of HCT25-1 (d) and HCT45-1T (e). Organoids cultured for the indicated days were fixed and stained for DEFA5 (Red). Incorporated 5-ethynyl-2′-deoxyuridine (EdU) was visualized by the click reaction (green) and nuclei were stained using 4′,6-diamidino-2-phenylindole (DAPI; blue). Three-dimensional (3D) images were obtained; a representative single plane is shown. The bar denotes 50 µm. f–m Cell number (f and j), EdU+ cells (g and k), DEFA5+ cells per organoid (h and l), and percentage of EdU+ cells in DEFA5+ cells (i and m) of HCT26-1T (f–i) and HCT45-1T (j–m) were counted in the 3D images. In box-plots, center line and upper and lower quartiles indicated median and upper and lower quartiles, respectively. Whiskers indicated 1.5× interquartile range. Combined results of three replicates are shown; **p < 0.01 and *p < 0.05 (t-test). Comparative analysis of DEFA6+, KIT+, and REG4+ cells in colorectal cancer (CRC) patient-derived organoids (PDOs). Tables show the percentage of DEFA6 and KIT or DEFA6 and REG4 (n). Violin plots showing marker gene expression across clusters (o) and culture days (p). Scattered plot showing the correlation between DEFA6 and KIT (upper panel) and that between DEFA6 and REG4 (lower panel). Correlation coefficients are shown in (q). r Pseudotime analysis showing the expression levels during organoid reconstruction. Cells were colored according to the states shown in Fig. 2f.
Notably, the canonical Paneth cell marker DEFA6 was identified as the most significant DEG (log2FC = 30, log2 mean expression=8.7), and DEFA5 was also upregulated (log2FC = 4.8, log2 mean expression=3.9). Paneth cells are located in the small intestine and are not normally found in the colon20. Thus, we characterized DEFA5- and DEFA6-expressing cells by calculating the overlaps between their DEGs and the marker genes of small intestinal epithelium cells determined by scRNA-seq of murine tissue21. Both DEFA5- and DEFA6-expressing cells shared molecular signatures with intestinal Paneth cells (Fig. 3c).
To validate the results of scRNA-seq analysis, we performed immunofluorescence staining of HCT25-1T (Fig. 3d). Owing to the lack of proven antibodies against DEFA6, we stained developing organoids with an antibody against DEFA5, and found that the total cell number per organoid increased during the observation period, whereas the number of 5-ethynyl-2′-deoxyuridine (EdU)-positive cells decreased (Fig. 3f, g). The percentage of DEFA5+ cells was 1.9% on day 3, and then decreased to 0.34% and 0.17% on days 6 and 10, respectively (Fig. 3h). Similar results were obtained using HCT45-1T (Fig. 3e, j-l). These observations support the notion that Paneth-like cells were induced in response to single-cell dissociation of organoids, although organoids were established from the colon, which lacks Paneth cells. Notably, on day 3, 14.3% of HCT25-1T and 66.7% of HCT45-1T of DEFA5+ cells were EdU+, suggesting they were not terminally differentiated but retained proliferation activity (Fig. 3i, m).
In the mouse colon, a subset of secretory lineage cells play a role equivalent to that of Paneth cells in the small intestine. These include c-Kit+ colonic crypt base secretory cells9 and Reg4+ deep crypt secretory cells10. In the human CRC-derived organoids, 4.2% and 13.5% of cells co-expressed DEFA6 and KIT or REG4, respectively (Fig. 3n). KIT+ and REG4+ cells were partitioned into clusters 3 and 4 (Fig. 3o) and their numbers increased on day 3 after plating (Fig. 3p). However, their expression profiles were not significantly correlated with that of DEFA6 (correlation coefficient = 0.2 and 0.07, for KIT+ and REG4+ cells, respectively) (Fig. 3q), and pseudotime analysis indicated that these cells were produced by a distinct differentiation process (Figs. 2g and 3r). Based on these observations, we conclude that DEFA6+ cells mainly represent a cell state distinct from those previously reported as colonic crypt base secretory cells or colon deep crypt secretory cells, although some cells co-expressed KIT or REG4.
Notch signaling controls cell fate determination in CRC organoids
Previously, we showed that OLFM4+ cells in PDOs harboring EiC in the OLFM4 locus could be reliably identified based on EGFP expression12. In this study, to analyze the temporal regulation of DEFA6+ cells developed from OLFM4+ cells, we generated PDOs in which the EiC and IRES-RFP (RFP) cassettes were integrated into the 3’ UTR of DEFA6 and OLFM4 genes, respectively (Fig. 4a and Supplementary Fig. 4a and b). FACS analysis revealed that two Notch inhibitors, dibenzazepine (DBZ) and DAPT, reduce EGFP+ cells in OLFM4-EiC by 79.3% to 24.5% and 18.2%, respectively, and increased DEFA6-EiC by 2.5% to 4.3% and 5.4%, respectively, although jagged 1, a Notch ligand, did not induce overt effects (Fig. 4b). Additionally, we inserted the RFP gene in the DEFA6 locus of PDOs carrying EiC in the OLFM4 locus, which was generated in a previous study11. A small number of DEFA6+ cells were detected in each organoid of both genetically modified PDOs (Supplementary Fig. 4c). BB homodimerizer treatment effectively removed OLFM4+ cells in OLFM4-EiC/DEFA6-RFP organoids, leading to organoid collapse. However, it did not induce overt effects on OLFM4-RFP/DEFA6-EiC organoids, demonstrating that DEFA6+ cells were dispensable for the maintenance of the established organoids.
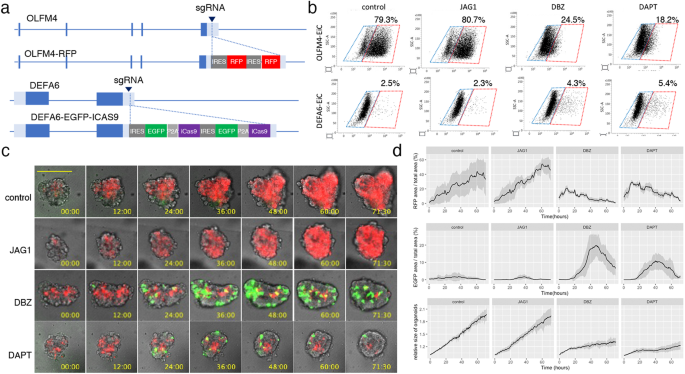
a Internal ribosome entry site (IRES)-RFP and IRES-enhanced green fluorescence protein (EGFP)-P2A-inducible Caspase 9 (iCas9) cassettes were inserted into the 3’-untranslated region of olfactomedin 4 OLFM4 and defensin alpha 6 (DEFA6), respectively, generating PDOs harboring OLFM4-RFP/DEFA6-EGFP-iCas9. b Fluorescence-activated cell sorting (FACS) analysis showing the effects of Notch ligand and inhibitors. PDOs expressing OLFM4-EGFP-iCas9 (upper panels) and DEFA6-EGFP-iCas9 (lower panels) were cultured for 24 h followed by treatment with the indicated agents for 24 h. The percentage of EGFP+ cells was analyzed using fluorescence-activated cell sorting (FACS). c Time lapse images of PDOs. OLFM4-RFP/DEFA6-EGFP-iCas9 organoids were treated with the indicated agents, and videos were recorded every 30 min for 3 days. The bar denotes 100 µm. d Quantification of fluorescence images shown in (c). Data are shown as mean intensity ± standard deviation (n = 4).
Time-lapse imaging demonstrated that the number of OLFM4+ cells continuously increased during the first 3 days after replating, indicating that these cells were actively self-replicating in the organoid expansion phase (Fig. 4c, d). DBZ and DAPT reduced the number of OLFM4+ cells and increased the number of DEFA6+ cells. The growth of organoids was impaired and the expression of DEFA6 started to decrease 48 h after replating. These data indicate that DEFA6+ cells were induced by the perturbation of Notch signaling, providing evidence that the cell fate determination program of Paneth cells in the normal intestine is maintained in advanced CRC.
Cell-cell interaction supports organoid formation
In the normal intestine, Paneth cells provide niche factors that support Lgr5+stem cells7. Thus, we investigated whether the interaction between DEFA6+ cells contributed to the growth of OLFM4+ cells because the role of cellular interactions in advanced CRC has not been well established. The efficiency of organoid formation was analyzed under two different conditions: in mini-organoids and single cells (Fig. 5a). Mini-organoids, which consisted of an average of 6.8 cells (Fig. 3d, f), were generated by culturing single cells for 3 days. Mini-organoids grew in niche factor-free basal medium, whereas organoid formation from single cells was considerably impaired (Fig. 5b). These observations support the notion that cell-cell interactions in organoids derived from advanced CRC support organoid formation by providing niche factors.
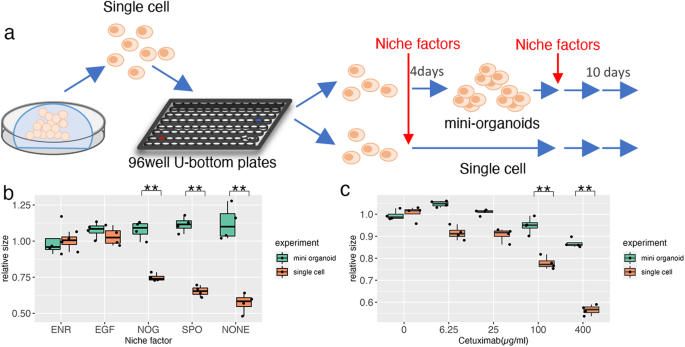
a Schematic representation of the experiment. Single cells of PDOs were cultured in media containing test niche factors (single cell) or in ENR medium for 4 days to generate small clusters of cells followed by in-test media (mini-organoids). b Comparative analysis of niche factor dependency between single cells and mini-organoids. Organoids were cultured in media supplemented with the indicated niche factors for 10 days. The size of organoids was determined by analyzing at least 800 organoids and the relative size to that of organoids cultured in ENR medium is shown; **p < 0.01 (unpaired t test, n = 4 independent experiments). c Response to cetuximab. Organoids were cultured in media containing the indicated concentration of cetuximab and the size was determined as described in (b); **p < 0.01 (unpaired t test, n = 4 independent experiments).
Notably, epidermal growth factor (EGF) supported the growth of single cells. This suggests that cell–cell interactions in tumor tissues affect the efficacy of EGFR-targeting chemotherapeutic agents, which are commonly used for CRC treatment. This was tested using the clinically used drug cetuximab (Fig. 5c), which induced more substantial effects on single cells than on mini-organoids. HCT25-1T cells have a KRAS G13D mutation11. This mutation results in incomplete impairment of NF1 function, and the cells respond to EGFR inhibition22,23. In a clinical setting, cetuximab is effective against CRC carrying the KRAS G13D mutation24. These observations shed light on cell-cell interactions as potential therapeutic targets for improving the efficacy of cetuximab.
DEFA6+ cells increase organoid formation efficiency
Considering that DEFA6 is a canonical marker for Paneth cells that supports crypt basal stem cells in the normal intestine, we investigated whether DEFA6+ cells in advanced CRC had equivalent functions equivalent to those of Paneth cells. To compare the construction efficiency of DEFA6+ organoids to that of DEFA6– organoids, HCT25-1T-OLFM4_RFP-DEFA6_EiC cells were dissociated into single cells, and organoid formation was monitored for 3 days (Fig. 6a). During this period, 17% of RFP+ cells produced EGFP+ cells in ENR medium (Fig. 6b, c). RFP+ cells also produced RFP–/EGFP– cells, indicating that OLFM4+ cells produced progenies distinct from DEFA6+ cells (Fig. 6b, lower panels).
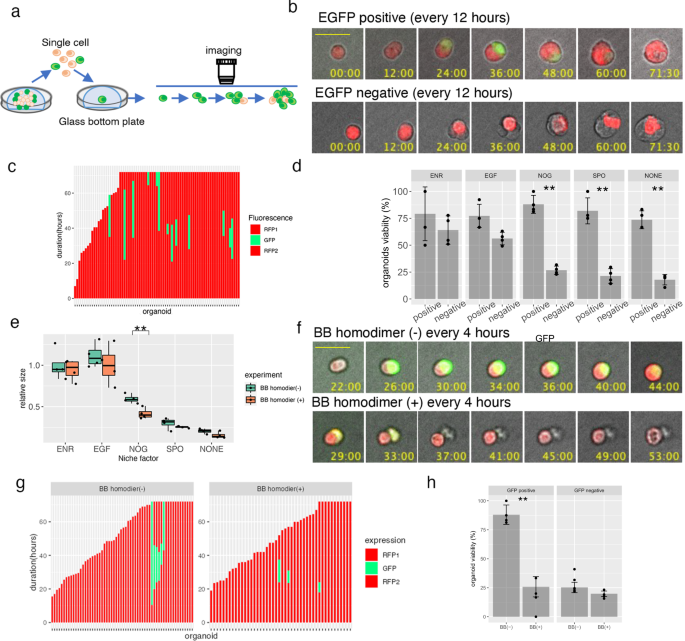
a Schematic representation of the experiment. OLFM4-RFP/DEFA6-EGFP-iCas9 organoids were dissociated into single cells and their growth was video recorded every 30 min for 3 days. b Representative video-recording of organoid reconstruction. Composite images of fluorescence and bright fields are shown. The organoid shown in the upper panel generated EGFP+ cells, while no EGFP+ cells were observed in the organoid shown in the lower panel. The bar denotes 25 µm. c Stacked bar plot showing the emergence of EGFP+ cells of OLFM4-RFP/DEFA6-EGFP-iCas9 organoids. Each bar represents one organoid generated from single RFP+ cells. Red and green indicate organoids containing RFP+ cells and RFP+/EGFP+ cells, respectively. d The percentage of alive organoids 3 days after plating of single RFP+ cells. At least 50 cells were counted in each condition. Data are shown as the mean ± standard deviation; **p < 0.01(unpaired t-test, n = 4 independent experiments). e Effect of BB homodimer on organoid growth in media containing different niche factors. Organoids were cultured in the presence (green) or absence (red) of BB homodimer in the indicated media for 10 days. The organoid size was determined by analyzing at least 800 organoids and the relative size to that of organoids cultured in ENR medium is shown; **p < 0.01 (unpaired t-test, n = 4 independent experiments). f Timelapse images of the organoids reconstituted from single OLFM4+ cells. Composite images of fluorescence and bright field are shown. The rapid elimination of EGFP+ cells by BB homodimer is evident. The base denotes 25 µm. g Stacked bar plot showing the generation of EGFP+ cells in OLFM4-RFP/DEFA6-EGFP-iCas9 organoids. Each bar represents one organoid generated from single RFP+ cells. Red and green indicate organoids containing RFP+ cells and RFP+/EGFP+ cells, respectively. h Percentage of live organoids 3 days after plating of single RFP+ cells. At least 50 cells were counted in each condition. Data are shown as the mean ± standard deviation; ** p < 0.01(unpaired t-test, n = 4 independent experiments).
We investigated the efficiency of organoid formation under different media conditions (Fig. 6d). PDOs were maintained in media supplemented with EGF, R-spondin-1, and noggin, which support organoid growth of by controlling RAS, Wnt, and bone morphogenetic protein signaling, respectively. On average, 76.6% of DEFA6+ organoids were viable, irrespective of niche factors. The viability of DEFA6– organoids was slightly reduced in the presence of ENR or EGF (60.1% and 56.2%, respectively), whereas it was dramatically reduced in medium supplemented with noggin, R-spondin-1, or in niche factor-free medium (28.7%, 21.8%, and 17.9%, respectively), consistent with the low efficiency of organoid formation of single cells in EGF-free media (Fig. 5b). These observations support the hypothesis that DEFA6+ cells support organoid formation.
Ablation of DEFA6+ cells reduces organoid formation efficiency
To directly evaluate the role of DEFA6+ cells, we selectively ablated these cells during organoid formation. HCT25-1T-OLFM4_RFP-DEFA6-EiC cells were dissociated into single cells and cultured in the presence or absence of BB homodimerizer. Consistent with the reconstruction experiment, no significant effects were observed in ENR or EGF medium (Fig. 6e). Notably, significant reduction was evident in noggin-containing medium, but not in medium supplemented with R-spondin-1 or niche factor-free medium. These findings indicate that DEFA6+ cells provide a niche environment that is not replaced by noggin.
The ablation of DEFA6+ cells in noggin-containing medium was analyzed using time-lapse imaging. BB homodimerizer treatment quickly eliminated EGFP+ cells, demonstrating the efficient ablation of DEFA6+ cells (Fig. 6f). Furthermore, the treatment reduced the duration of EGFP expression (25.9 h and 11.7 h in the presence and absence of BB homodimerizer, respectively) and the percentage of EGFP+ cells (11.5% and 7.6% in the presence and absence of BB homodimerizer, respectively) (Fig. 6g). Notably, ablation of DEFA6+ cells induced death in OLFM4+ cells (Supplementary Fig. 5) and the viability of the DEFA6+ organoids was significantly reduced (Fig. 6h). These observations indicate that DEFA6+ cells support OLFM4+ cells and contribute to organoid formation, which recapitulates the role of Paneth cells in providing the niche environment of stem cells in the normal intestine.
Identification of DEFA5/6+ cells in CRC surgical specimen
The localization of Paneth-like cells in CRC tissue was histologically analyzed in the original surgical specimen from which the PDOs were established. Tumor sections were stained with antibodies to DEFA5 and epithelial cell adhesion molecule (ECad) to evaluate the integrity of tumor tissue (Fig. 7a). DEFA5+ cells were not detected in the normal crypt or in tumor tissues where cell adhesion was maintained, but were identified in areas where the ECad signal was reduced. Hematoxylin and eosin staining of this area revealed the loss of epithelial tissue integrity, although cells morphologically resembling Paneth cells were not found (Fig. 7b). Considering that Paneth-like cells were produced by single cell dissociation of organoids, these observations provide in vivo evidence supporting their induction in response to loss of cell-cell contact.
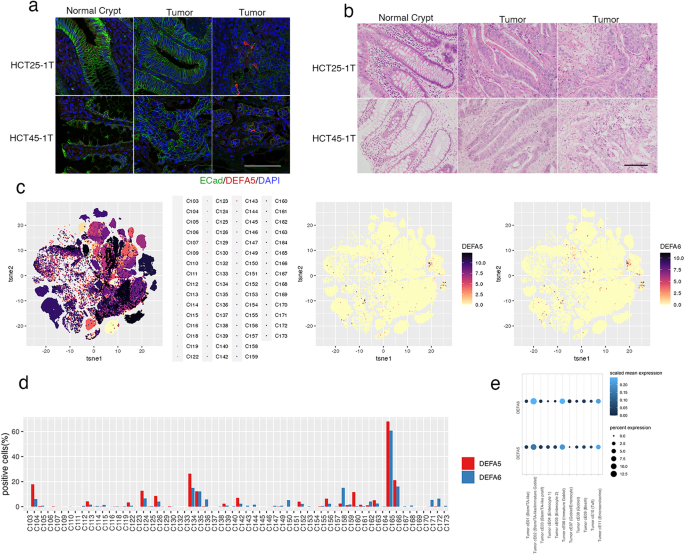
a Tissue slices of FFPE sample stained for defensin alpha 5 (DEFA5; red) and E-Cadherin (ECad; green). Nuclei are visualized using 4′,6-diamidino-2-phenylindole (DAPI; blue). ECad signals form normal crypts (left panels), tumor regions with strong (middle panels), and weak (right panels) are shown. The bar denotes 100 µm. b Hematoxylin and eosin staining of tissue slices. Normal crypt and tumor regions with (middle panels) or without (right panels) tubular structures are shown. The bar denotes 100 µm. c t-Distributed stochastic neighbor embedding of tumor cells by specimen (left panel), DEFA5+ cells (middle panel), and DEFA6+ cells (left panel). d Percentage of DEFA5+ (red) and DEFA6+ (blue) cells in each patient. e Dot plot showing scaled mean expression (color) and percent expression (dot size) of DEFA5 and six in each cluster.
To evaluate the prevalence of Paneth-like cells in patients with CRC, we explored a previously reported scRNA-seq dataset25 (Fig. 7c). Out of 62 patients, DEFA5+ and DEFA6+ cells were detected in 41 (66.1%) and 51 (82.3%) cases, respectively (Fig. 7d). In 108,497 tumor cells that were analyzed, the overall percentage of positive cells was 3.6% and 3.1%, respectively. Gene expression programs identified by consensus non-negative matrix factorization revealed that their expression levels were high in Tumor cE02 (Stem/TA-like/Immature Goblet), Tumor cE06 (Immature Goblet) and cE11 (Enteroendocrine), demonstrating the association of Paneth-like cells with secretory lineage cells (Fig. 7e).
To further characterize the cells, we analyzed the 594 colorectal adenocarcinoma (COADREAD) patients listed in TCGA PanCancer Atlas26, and found that the expression levels of DEFA5 and 6 were correlated (R2 = 0.64) (Supplementary Fig. 6a). Comparative analysis between DEFA5/6 positive and negative patients (z-score > 2) revealed that their expression levels were not correlated to the specific tumor type (adenocarcinoma and mucinous) or location (colon, rectum) (qval = 0.038 and 0.038, respectively) (Supplementary Fig. 6b). Additionally, no significant difference was observed in mutation frequencies between DEFA5/6 positive and negative groups (qval = 0.906 and = 0.721, respectively) (Supplementary Fig. 6c). These observations indicated that a substantial fraction of Paneth-like cells in CRC expresses DEFA5 and 6, and that their induction is not histologically or genetically specified.
- SEO Powered Content & PR Distribution. Get Amplified Today.
- PlatoData.Network Vertical Generative Ai. Empower Yourself. Access Here.
- PlatoAiStream. Web3 Intelligence. Knowledge Amplified. Access Here.
- PlatoESG. Carbon, CleanTech, Energy, Environment, Solar, Waste Management. Access Here.
- PlatoHealth. Biotech and Clinical Trials Intelligence. Access Here.
- Source: https://www.nature.com/articles/s42003-023-05504-8