Animals and dietary interventions
We utilized 10-week-old male C57BL/6 N mice obtained from Charles River Laboratories, Sulzfeld, Germany. The mice were housed at 22 °C with a 12-h light-dark cycle (with light starting from 6:00 a.m.). Upon arrival and prior the beginning of the experiment, all mice had unrestricted access to water and a standard chow diet provided by Ssniff Spezialdieten GmbH, Soest, Germany. At the age of 12 weeks, the mice were randomly assigned to three groups (n = 8–10, repeated in three independent experiments). The mice were then fed for a duration of 8 weeks as follows: (a) normal diet (ND) with a lipid content of 3.4% wt/wt (Rat/Mouse- Maintenance extrudate; Ssniff Spezialdieten GmbH, Soest, Germany); (b) HFD with lipid content of approximately 35% wt/wt, primarily sourced from corn oil43; and (c) HFD supplemented with omega-3 concentrate (HFD + F) (with 46% DHA, 14% EPA, wt/wt; product EPAX 1050 TG; Epax Norway AS, Ålesund, Norway), which replaced 15% wt/wt of dietary lipids to achieve a total EPA and DHA concentration of 30 mg/g diet24. The dose of omega-3 PUFAs per mouse was 0.168 g EPAX 1050 concentrate. This dose of omega-3 PUFAs in diet has been shown in the previous animal and clinical studies to prevent HFD-induced obesity complications and improve metabolic parameters24,43,44. The macronutrient composition of the experimental diets and fatty acid composition in dietary lipids are presented in Supplementary Tables 1, 2. Body weight and 24-h food intake were assessed weekly throughout the study period. After 8 weeks of dietary interventions, the mice were sacrificed in the fed state by cervical dislocation under diethyl ether anesthesia. Tissue samples and primary mouse BMSCs were collected for subsequent molecular analyses. All experiments were performed according to the Institute of Physiology of the Czech Academy of Sciences guidelines and were approved under protocol 81/2016.
Glucose tolerance test
Intraperitoneal glucose tolerance test (GTT) was performed using 1 mg of glucose/g body weight in overnight fasted mice24. Glucose (1 mg/g) was administrated by i.p. injection. Blood glucose levels were measured from the tail vein at the indicated time (0, 15, 30, 60, 90, and 120 min), and glycemia was determined using glucometer (Accu-Chek Performa, Roche).
Biochemical analysis
Blood glucose levels were measured using Accu-Chek Performa glucometers from Roche. Plasma insulin levels were assessed using the Sensitive Rat Insulin RIA Kit (Millipore, Billerica, MA, USA).
Bone histology
Tibias were collected after the dissection and fixed for 48 h in 10% formalin. After formalin fixation, bones were demineralized by EDTA 12% solution for 14 days. Tissues were embedded in paraffin and sections were used for hematoxylin eosin staining, which was further evaluated for BMA4.
Isolation of BMSCs and hematopoietic stem cells (HSCs)
BMSCs were isolated from the bones of the front and hind limbs of C57BL/6 N male mice (after 8 weeks of dietary treatments) following previous protocols with some modifications4. Intact bones containing BM were gently cleaned from muscles in the sterile hood. After bone-crushing, collagenase digestion (StemCell, Vancouver, BC, Canada) and negative selection of CD45, CD31 and Ter119 cells (Miltenyi, Bergisch Gladbach, Germany), BMSCs were isolated via several washing steps and centrifugation in order to get cell pellet for the culture. BMSCs were subcultured in growth medium (MEM alpha (Thermo Fisher Scientific, Waltham, MA, USA) + 20% FBS (Thermo Fisher Scientific, Waltham, MA, USA) + 1% penicillin/streptomycin (P/S) (Thermo Fisher Scientific, Waltham, MA, USA) + 0,5% Amphotericin B (Merck, Darmstadt, Germany) + 1% Glutamax (Thermo Fisher Scientific, Waltham, MA, USA) + 1% MEM NEAA (Thermo Fisher Scientific, Waltham, MA, USA) + 1% sodium pyruvate (Thermo Fisher Scientific, Waltham, MA, USA)) and cultivated for further analysis. The positive fraction with HSCs was divided into three samples. One was harvested for mRNA isolation with Tri-Reagent (Merck, Darmstadt, Germany), the second was harvested for proteins, and the rest was seeded and cultivated in a growth medium for further analysis.
In vitro differentiation of BMSCs
Primary BMSCs from passage two were used for analyzing their differentiation capacity.
Osteoblast (OB) differentiation
BMSCs were seeded at a density of 20,000 cells/cm2. When the cells reached 80% confluence in MEM medium (Thermo Fisher Scientific, Waltham, MA, USA) supplemented with 10% FBS (Thermo Fisher Scientific, Waltham, MA, USA) and 1% P/S (Thermo Fisher Scientific, Waltham, MA, USA) was added to control cells. The rest of the cells were cultivated with osteoblast induction media consisting of 10 mM β-glycerophosphate Merck, Darmstadt, Germany), 10 nM dexamethasone (Merck, Darmstadt, Germany), and 50 µg/ml Vitamin C (Wako Chemicals USA Inc., Richmond, VA, USA). The media was changed every second day for 7 days (ALP activity) and 11 days (Alizarin Red staining).
Alizarin red staining
Mineralization of the cell matrix at day 11 was measured using Alizarin Red S staining. Cells were fixed with 70% ice-cold ethanol for a minimum of 1 h at −20 °C, after which Alizarin Red S solution (Merck, Darmstadt, Germany) was added. Then, the cells were stained for 10 min at room temperature (RT). Excess dye was washed with distilled water, followed by PBS. The amount of mineralized matrix (bound stain) was quantified by elution of the Alizarin red stain, using 20 min of incubation of the cultures in 70% dH2O, 20% ethanol, and 10% methanol solution on a shaker (100 rpm) at RT. The absorbance of the eluted dye was measured at 500 nm using a microplate reader according to the protocol45.
Alkaline phosphatase (ALP) activity assay
ALP activity and cell viability assay were quantified at day 7 of OB differentiation to normalize the ALP activity data to the number of viable cells.
Cell viability assay was performed using Cell Titer-Blue Assay Reagent (Promega, Madison, WI, USA) at fluorescence intensity (579Ex/584Em). ALP activity was determined by absorbance at 405 nm using p-nitrophenyl phosphate (Merck, Darmstadt, Germany) as substrate46.
Adipocyte (AD) differentiation
Cells were plated at a density of 30,000 cells/cm2. For AD differentiation, DMEM media (Thermo Fisher Scientific, Waltham, MA, USA) was used, containing 10% FBS (Thermo Fisher Scientific, Waltham, MA, USA), 9% horse serum (Merck, Darmstadt, Germany), 1% P/S (Thermo Fisher Scientific, Waltham, MA, USA), 100 nM dexamethasone (Merck, Darmstadt, Germany), 0.5 uM 3-isobutyl-1-methyxanthine (IBMX) (Merck, Darmstadt, Germany), 1 µM BRL (Merck, Darmstadt, Germany), 3 µg/mL Insulin (Merck, Darmstadt, Germany). The media was changed every three days for 10 days. Horse serum supplementation of media was used for the first three days of induction.
Oil Red O staining
At day 10 of differentiation, cells were rinsed with PBS and fixed in 4% paraformaldehyde (Merck, Darmstadt, Germany) for 10 min at RT. After fixation, cells were briefly rinsed with 3% isopropanol solution (Merck, Darmstadt, Germany), and lipid droplets were stained with Oil Red O solution (Merck, Darmstadt, Germany) for 1 h at RT.
Colony forming units-fibroblast (CFU-f) assay
After BMSC isolation, cells were seeded for CFU 500 cells/60 mm Petri dish and cultivated in growth media. After 14 days in culture, colonies displaying more than 50 cells were counted using Crystal Violet staining (Merck, Darmstadt, Germany).
Short-time proliferation assay
Isolated BMSCs were plated in a 24-well plate in triplicates at a density of 1000 cells/well in a standard growth medium. Cell number was evaluated after 1, 3, 6, and 9 days. Cells were washed with PBS, detached by trypsinization, and then manually counted using a Bürker-Türk counting chamber.
Insulin and lipopolysaccharide (LPS) responsiveness of HSCs
Primary HSCs were cultured up to passage one and seeded for insulin and LPS stimulation. Cells were plated at a density of 300,000 cells/well in 12 well plates. When they reached the confluence, cells were starved for 4 h in serum-free MEM alpha medium (Thermo Fisher Scientific, Waltham, MA, USA) with 0.5 % BSA, and with 1% P/S then stimulated with 100 nM Insulin or 1 μg/ml LPS for 15 min at 37 °C and harvested for protein used in subsequent analyses.
Osteoclast (OC) differentiation
Primary mouse osteoclasts (OCs) were differentiated from total BM cells isolated from the treated mice at the end of dietary intervention47. Briefly, after flushing long bones and lysis of erythrocytes using erythrocyte lysis buffer, the BM cells were seeded in the cell culture plates for the subsequent analysis (96 well plates: 125,000 cell/well for TRAP staining/TRAP activity, 24 well plates: 500,000 cells/well for OC gene expression). The following day, the cells were differentiated with 25 ng/ml RANKL (Peprotech, Cat # 310-01) and 25 ng/ml M-CSF (R&D systems, cat # 216-MC) in alpha MEM media/10 % FBS/1% P/S, and the media was changed every 2nd day up to 5 days. Mature Ocs were defined as multi-nuclei cells with three or more nuclei.
In vitro OC differentiation with short-term treatment with omega-3 PUFAs
BM cells were isolated from C57BL/6 male mice and differentiated to OC47. During 5 days of OC differentiation omega-3 PUFAs: 100 µM EPA (Merck, Cat # E2011), 100 µM DHA (Merck, Cat # D2534) or their mix coupled with 0.5 % BSA were added to the differentiation cocktail and changed every 2nd day. After 5 days of OC differentiation TRAP staining and gene expression of OC markers were performed.
TRAcP activity and TRAP staining of mature OCs
Total BM cells were seeded in 96 well plates at the density of 125,000 cells/well and differentiated in OC according to the protocol mentioned above up to 5 days. After day 5, media from the cultured cells was collected and used for the measurement of TRAcP activity according to the manufacture’s protocol47,48. Then, the cells were fixed with 10% formalin and staining for TRAcP using TRAP kit (Sigma, cat. n. 387A-1KT). Mature OCs were defined as multi-nuclei cells with three or more nuclei. TRAcP activity was normalized to the number of OCs.
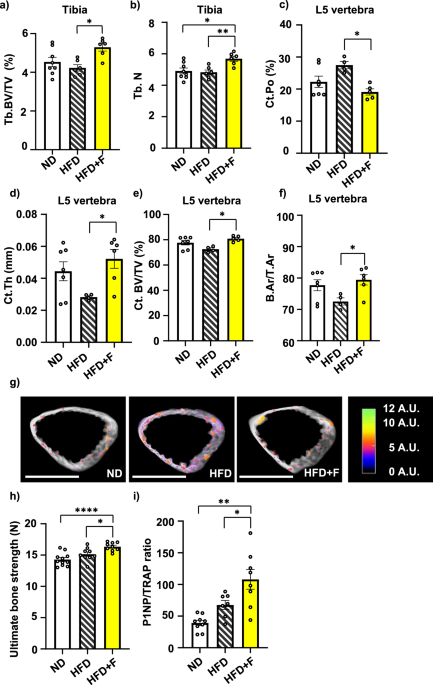
Micro‐computed Xray tomography (μCT) analysis
Proximal tibias and distal body of the 5th lumbar vertebra (L5) of mice were scanned with a high‐resolution μCT SkyScan 1272 (Bruker, Belgium) with resolution 3 μm per voxel (voltage 80 kV, current 125 μA with 1 mm aluminum filter, exposure 1300 ms, 2time averaging, and 0.21° rotation step on 360°scanning). Reconstruction of virtual slices was performed in NRecon 1.7.3.1 (Bruker, Belgium) with InstaRecon 2.0.4.0 reconstruction engine (InstaRecon, Urbana, IL, USA) with 49% beam hardening correction, ring artifact correction = 9, and range of intensities 0–0.09 AU for tibia and 0–0.11 for L5. Reconstructions were reoriented in DataViewer 1.5.6 (Bruker, Belgium). Areas of interest were selected based on the reference section and analyzed in CT Analyzer 1.18.4.0 (Bruker, Belgium) with structure separation based on Otsu’s method. Cortical and trabecular bone were analyzed in the same area for structure volume, porosity, density, and connectivity. The analysis region was defined from the first slide under the growth plate to the 230th slide and 3D microarchitecture of trabecular and cortical bone was used for the evaluation of the bone parameters49.
Contrast-enhanced computed Xray tomography (CECT) workflow
Staining procedure
The staining solution was prepared by mixing commercial Hexabrix® solution (Guerbet, 10 mL, 320 mgI/mL) with 1x PBS (phosphate-buffered saline, 40 mL, 10 mM)6. Formalin-fixed proximal tibias (right leg) of the mice were transferred to a 1.5 mL Eppendorf tube containing 1 mL of staining solution. These Eppendorf tubes were placed on a shaker plate (gentle shaking) at ambient temperature. The samples were stained for at least 3 days, after which they were scanned.
µCT image acquisition and reconstruction
For image acquisition, the samples were removed from the Eppendorf tube and wrapped in parafilm to prevent dehydration while exposed to X-rays. Samples were imaged using a Phoenix NanoTom M (GE Measurement and Control Solutions, Boston, MA, USA). A diamond-coated tungsten target was used. The system was operated with the following acquisition parameters: voltage = 60–70 kV, current = 120–140 μA, focal spot size = 1.99 µm, isotropic voxel size = 2 µm³, exposure time = 500 ms, frame averaging = 1, image skip = 0 and scan time = 20 min. The reconstruction was performed using Datos|x GE Measurement and Control Solutions software (version 2.7.0 – RTM) with a beam hardening correction of 8 and the inline median, ROI CT filter, and Filter volume algorithms implemented in the software. Subsequently, the datasets were normalized using an in-house developed Matlab script, with air and residual Hexabrix solution as references.
CECT image analysis of BMAT
After consistently aligning the datasets (DataViewer 1.5.6, Bruker MicroCT, Belgium), we analyzed the µCT data using CTAn (Bruker MicroCT, Belgium). First, we selected the volume of interest (VOI) in the proximal metaphysis of the tibia, starting 250 slices below the growth plate and covering 500 slices in the distal direction. In this VOI, binarization of the dataset was performed using a global threshold (130–255). This threshold masked both cortical and trabecular bone. Based on this selection, a denoised mask for the bone marrow combined with the trabecular bone was segmented by performing a sequence of VOI shrink-wrap, closing (2–10; increments of 2), and opening (2–10; increments of 2) operations (i.e., everything inside the cortical bone was selected). Next, the newly generated mask was projected on the gray value image, generating a new VOI. In this new VOI, the segmentation of adipocytes was performed using a global threshold (1–59). For the analysis of individual adipocytes, we used the Avizo 3D (version 2021.1, Thermo Fisher Scientific, Waltham, MA, USA) software. First, the adipocytes were binarized and leftover noise was removed using interactive thresholding (1–255) and despeckle (speckle size = 7 µm × 7 µm × 7 µm) module. This was followed by segmenting individual adipocytes using a combination of thickness map computation and the H-extrema watershed module. Next, a border kill module was applied, removing adipocytes cut by the bounding box. Then, a 3D label analysis was performed that allowed the final filtering of the data based on shape (sphericity > 0.5) and volume (>4000 µm³). Finally, sphericity, volume (µm³), area (µm²), thickness (µm), and the number of adipocytes were computed.
Bone strength analyses
The femora isolated from C57BL/6N male mice after 8-week-long treatment with HFD or HFD supplemented with omega-3 were tested in a three-point bending test using an ElectroForce testing system (TestBench LM1, EnduraTEC Systems Group, Bose Corp., Minnetonka, MN, USA). A standard protocol was used in this experiment50,51. The span length and radius of curvature of the supports were 7 mm and 2 mm, respectively. Between dissection and mechanical testing, the bones were fixed in 4% paraformaldehyde at 4 °C for the first 48 h. Then, samples were stored in PBS at 4 °C. The bones were placed with the anterior surface pointing downward and were subjected to a small stabilizing preload (1 N) and two conditioning cycles before loading until failure at a rate of 0.1 mm/s. The following parameters were derived from the load-displacement curve: (1) bone strength (N), determined as the ultimate load during the three-point bending test; (2) work-to-failure (mJ), determined as the area under the load-displacement curve, representing the energy absorbed by the bone before breaking and (3) bone stiffness (N/mm), calculated as the slope of the linear proportion of the loaded-displacement curve, representing the elastic rigidity.
Bioenergetic analysis
Parallel measurement of oxygen consumption rate (OCR) and extracellular acidification rate (ECAR) was performed using the Seahorse XFe24 Analyzer (Agilent, Santa Clara, CA, USA). Primary BMSCs were seeded in a 24-well Agilent Seahorse XF Cell Culture Microplate in 5 plicates at a density of 20,000 cells per well in growth media the day prior to the analysis. The next day, all wells were washed with 1 mL of DMEM (Merck, Darmstadt, Germany) supplemented with 10 mM glucose, 4 mM glutamine, and 2 mM pyruvate (pH 7.4; 37 °C); 500 µL of the same media was pipetted, and the microplate was incubated at 37 °C for 30 min. Meanwhile, an XFe24 sensor cartridge was prepared by injection of substrates according to the protocol52 to measure metabolic rates with endogenous substrates (basal), and after subsequent additions with a final concentration of 10 mM glucose (Merck, Darmstadt, Germany), 1 µM oligomycin (Oligo) (Merck, Darmstadt, Germany), 2 µM carbonyl cyanide-4-(trifluoromethoxy) phenylhydrazone (FCCP) (Merck, Darmstadt, Germany) and mixture of inhibitors of 1 µM rotenone (Rot) (Merck, Darmstadt, Germany), 1 µg/mL of antimycin A (AA) (Merck, Darmstadt, Germany) and 100 mM 2-deoxyglucose (2DG) (Merck, Darmstadt, Germany) (2DG + AA + Rot). The Seahorse data were analyzed using Wave Software 2.6.1. (Agilent, Santa Clara, CA, USA). The data were normalized by cell number determined by Hoechst 33342 staining of cell nuclei (final concentration 5 µg/mL) (Thermo Fisher Scientific, Waltham, MA, USA), which was performed immediately after the measurement using Cytation 3 Cell Imaging Reader (BioTek, Winooski, VT, USA) and processed by Gen5 software (BioTek, Winooski, VT, USA).
Isolation of mRNA and quantitative RT-PCR
Total RNA exptraction was carried out using TRI Reagent (Merck, Darmstadt, Germany) and the concentration of RNA was deermined using a Nanodrop spectrometer. Subsequently, cDNA synthesis was performed from 1 µg of total RNA using a High-Capacity cDNA Reverse Transcription Kit (Thermo Fisher Scientific, Waltham, MA, USA) according to the manufacturer’s protocol. Quantitative real-time PCR was conducted using Light Cycler® 480 SYBR Green I Master (Roche, Basel, Switzerland) with specific primers (GeneriBiotech, Hradec Králové, Czech Republic) as listed in Supplementary Table 3. The RT-PCR data were normalized to the expression of the housekeeping gene (36B4 for mouse).
Western blot
Protein lysates from the cells were prepared using M2 lysis buffer. Protein concentration was measured using BCA assay (Thermo Fisher Scientific, Waltham, MA, USA). Proteins with a final loading concentration of 15 µg/mL were separated in sodium dodecyl sulfate-polyacrylamide gels and transferred onto PVDF (polyvinylidene difluoride) membrane (Imobilon-P) by semi-dry electroblotting. After blotting, membranes were washed for 5 min in TBS (150 mM Tris-HCl, 10 mM NaCl; pH 7,4) and blocked in 5% (w/v) fat-free dry milk diluted in TBS-T (TBS with 1% (v/v) detergent Tween-20) for 1 h. After blocking, the membranes were washed 5 × 5 min in TBS-T. For immunodetection, the membranes were incubated with primary antibody (diluted in 5% milk) overnight in 4 °C. Next day, membranes were washed 5 × 5 min in TBS-T and then incubated with corresponding HRP-conjugated secondary antibody for 1 h at RT. The list of WB antibodies (Cell Signaling, Danvers, MA, USA) is presented in Supplementary Table 4. Protein detection was performed using ECL Clarity Max detection substrate (Bio-Rad) measured by ChemiDoc imaging system (Bio-Rad, Hercules, CA, USA), and signals were calculated by Image Lab software (Bio-Rad, Hercules, CA, USA). Densitometry analysis was normalized to signals from positive control protein lysates present in each membrane. Uncropped western blot membrane images are shown in Supplementary Fig. 9, 10.
Lipidomics and metabolomics
Global lipidomic and metabolomic profiling of BM, bone powder (BP), and plasma samples was conducted using a combined untargeted and targeted workflow for the lipidome, metabolome, and exposome analysis (LIMeX)11,53,54 with some modifications. Extraction was performed using a biphasic solvent system of cold methanol, methyl tert-butyl ether (MTBE), and 10% methanol. Four different liquid chromatography-mass spectrometry (LC-MS) platforms were used for profiling: (1) lipidomics of complex lipids using reversed-phase liquid chromatography with mass spectrometry (RPLC-MS) in positive ion mode, (2) lipidomics of complex lipids in RPLC-MS in negative ion mode, (3) metabolomics of polar metabolites using hydrophilic interaction chromatography with mass spectrometry (HILIC-MS) in positive ion mode, and (4) metabolomics of polar metabolites using RPLC-MS in negative ion mode.
Sample extraction for metabolomic and lipidomic analyses
BM and BP samples (20–25 mg) were homogenized with 275 µL methanol containing internal standards (PE 17:0/17:0, PG 17:0/17:0, LPC 17:1, Sphingosine d17:1, Cer d18:1/17:0, SM d18:1/17:0, PC 15:0/18:1-d7, cholesterol-d7, TG 17:0/17:1/17:0-d5, DG 12:0/12:0/0:0, DG 18:1/2:0/0:0, LPE 17:1, oleic acid-d9, PI 15:0/18:1-d7, MG 17:0/0:0/0:0, PS 17:0/17:0, HexCer d18:1/17:0, DG 18:1/0:0/18:1-d5, TG 20:0/20:1/20:0-d5, LPG 17:1, LPS 17:1, cardiolipin 16:0/16:0/16:0/16:0) and 275 µL 10% methanol containing internal standards (caffeine-d9, acetylcholine-d4, creatinine-d3, choline-d9, TMAO-d9, N-methylnicotinamide-d4, betaine-d9, butyrobetaine-d9, creatine-d3, cotinine-d3, glucose-d7, succinic acid-d4, metformin-d6) for 1.5 min using a grinder (MM400, Retsch, Germany). Then, 1 mL of MTBE with internal standard (CE 22:1) was added, and the tubes were shaken for 1 min and centrifuged at 16,000 rpm for 5 min.
Plasma samples (25 µL) were mixed with 765 μL of cold methanol/MTBE mixture (165 µL + 600 µL, respectively) containing the same mixtures of internal standards as before and shaken for 30 s. Then, 165 µL of 10% MeOH with deuterated polar metabolite internal standards was added, shaken for 30 s, and centrifuged at 16,000 rpm for 5 min.
For lipidomic profiling, 100 µL of the upper organic phase was collected, evaporated and resuspended using 100 µL methanol with internal standard (12-[[(cyclohexylamino)carbonyl]amino]-dodecanoic acid, CUDA), shaken for 30 s, centrifuged at 16,000 rpm for 5 min and used for LC-MS analysis.
For metabolomic profiling, 70 µL of the bottom aqueous phase was collected, evaporated, resuspended in 70 µL of an acetonitrile/water (4:1, v/v) mixture with internal standards (CUDA and Val-Tyr-Val), shaken for 30 s, centrifuged at 16,000 rpm for 5 min and analyzed using HILIC metabolomics platform. Another 70 µL aliquote of the bottom aqueous phase was mixed with 210 µL of an isopropanol/acetonitrile (1:1, v/v) mixture, shaken for 30 s, centrifuged at 16,000 rpm for 5 min, and the supernatant was evaporated, resuspended in 5% methanol/0.2% formic acid with internal standards (CUDA and Val-Tyr-Val), shaken for 30 s, centrifuged at 16,000 rpm for 5 min and analyzed using RPLC metabolomics platform.
LC-MS-based lipidomics
The LC-MS systems consisted of a Vanquish UHPLC System (Thermo Fisher Scientific, Waltham, MA, USA) coupled to a Q Exactive Plus mass spectrometer (Thermo Fisher Scientific, Waltham, MA, USA).
Lipids were separated on an Acquity UPLC BEH C18 column (50 × 2.1 mm; 1.7 μm) coupled to an Acquity UPLC BEH C18 VanGuard pre-column (5 × 2.1 mm; 1.7 μm) (Waters, Milford, MA, USA). The column was maintained at 65 °C at a flow-rate of 0.6 mL/min. For LC–ESI( + )-MS analysis, the mobile phase consisted of (A) 60:40 (v/v) acetonitrile:water with ammonium formate (10 mM) and formic acid (0.1%) and (B) 90:10:0.1 (v/v/v) isopropanol:acetonitrile:water with ammonium formate (10 mM) and formic acid (0.1%). For LC–ESI( − )-MS analysis, the composition of the solvent mixtures was the same except for the addition of ammonium acetate (10 mM) and acetic acid (0.1%) as mobile-phase modifiers. Separation was conducted under the following gradient for LC–ESI( + )-MS: 0 min 15% (B); 0–1 min 30% (B); 1–1.3 min from 30% to 48% (B); 1.3–5.5 min from 48% to 82% (B); 5.5–5.8 min from 82% to 99% (B); 5.8–6 min 99% (B); 6–6.1 min from 99% to 15% (B); 6.1–7.5 min 15% (B). For LC–ESI( − )-MS, the following gradient was used: 0 min 15% (B); 0–1 min 30% (B); 1–1.3 min from 30% to 48% (B); 1.3–4.8 min from 48% to 76% (B); 4.8–4.9 min from 76% to 99% (B); 4.9–5.3 min 99% (B); 5.3–5.4 min from 99% to 15% (B); 5.4–6.8 min 15% (B). A sample volume of 0.3 µL, 1.5 µL, and 1.5 µL was used for BM, BP, and plasma extracts, respectively, in ESI( + ). A sample volume of 5 µL for all matrices was used in ESI( – ). Sample temperature was maintained at 4 °C.
The ESI source and MS parameters were: sheath gas pressure, 60 arbitrary units; aux gas flow, 25 arbitrary units; sweep gas flow, two arbitrary units; capillary temperature, 300 °C; aux gas heater temperature, 370 °C; MS1 mass range, m/z 200–1700; MS1 resolving power, 35,000 FWHM (m/z 200); number of data-dependent scans per cycle, 3; MS/MS resolving power, 17,500 FWHM (m/z 200). For ESI( + ), a spray voltage of 3.6 kV and normalized collision energy of 20% was used, while for ESI( − ), a spray voltage of −3.0 kV and normalized collision energy of 10, 20, and 30% were set up.
LC-MS-based metabolomics
Polar metabolites were separated on an Acquity UPLC BEH Amide column (50 × 2.1 mm; 1.7 μm) coupled to an Acquity UPLC BEH Amide VanGuard pre-column (5 × 2.1 mm; 1.7 μm) (Waters, Milford, MA, USA). The column was maintained at 45 °C at a flow-rate of 0.4 mL/min. The mobile phase consisted of (A) water with ammonium formate (10 mM) and formic acid (0.125%) and (B) acetonitrile:water (95/5) with ammonium formate (10 mM) and formic acid (0.125%). Separation was conducted under the following gradient: 0 min 100% (B); 0–1 min 100% (B); 1–3.9 min from 100% to 70% (B); 3.9–5.1 min from 70% to 30% (B); 5.1–6.4 min from 30% to 100%(B); 6.4–8.0 min 100% (B). A sample volume of 0.5 µL, 0.5 µL, and 1.5 µL was used for bone marrow, bone powder, and plasma extracts, respectively, in ESI( + ). The sample temperature was maintained at 4 °C.
Polar metabolites were also separated on an Acquity UPLC HSS T3 column (50 × 2.1 mm; 1.8 μm) coupled to an Acquity UPLC HSS T3 VanGuard pre-column (5 × 2.1 mm; 1.8 μm) (Waters, Milford, MA, USA). The column was maintained at 45 °C using a ramped flow-rate. The mobile phase consisted of (A) water with formic acid (0.2%) and (B) methanol with formic acid (0.1%). Separation was conducted under the following gradient: 0 min 1% (B) 0.3 mL/min; 0–0.5 min 1% (B) 0.3 mL/min; 0.5–2 min from 1% to 60% (B) 0.3 mL/min; 2–2.3 min from 60% to 95% (B) from 0.3 mL/min to 0.5 mL/min; 2.3–3.0 min 95% (B) 0.5 mL/min; 3.0–3.1 min from 95% to 1% (B) 0.5 mL/min; 3.1–4.5 min 1% (B) 0.5 mL/min; 4.5–4.6 min 1% (B) from 0.5 mL/min to 0.3 mL/min; 4.6–5.5 min 1% (B) 0.3 mL/min. A sample volume of 5 μL was used to inject ESI( – ). The sample temperature was maintained at 4 °C.
The ESI source and MS parameters were: sheath gas pressure, 50 arbitrary units; aux gas flow, 13 arbitrary units; sweep gas flow, three arbitrary units; capillary temperature, 260 °C; aux gas heater temperature, 425 °C; MS1 mass range, m/z 60–900; MS1 resolving power, 35,000 FWHM (m/z 200); number of data-dependent scans per cycle, 3; MS/MS resolving power, 17,500 FWHM (m/z 200). A spray voltage of 3.6 kV and −2.5 kV for ESI( + ) and ESI( – ), respectively, was used. A normalized collision energy of 20, 30, and 40% for all metabolomics platforms was used.
Quality control
Quality control was assured by (i) randomization of the actual samples within the sequence, (ii) injection of quality control (QC) pool samples at the beginning and the end of the sequence and between each ten actual samples, (iii) analysis of procedure blanks, (iv) serial dilution of QC sample (0, 1/16, 1/8, 1/4, 1/2, 1), (v) checking the peak shape and the intensity of spiked internal standards and the internal standard added prior to injection.
Data processing
LC-MS data from metabolomic and lipidomic profiling were processed through MS-DIAL v. 4.70 software. Metabolites were annotated using in-house retention time–m/z library and MS/MS libraries available from commercial and open sources (NIST20, MassBank, MoNA). Lipids were annotated using LipidBlast in-built in MS-DIAL. Traces of pioglitazone (m/z 355.1116) and MSDC-0602K (m/z 370.0749) were detected in RPLC-MS lipidomics in ESI ( – ) as deprotonated molecules. Raw data were filtered using blank samples, serial dilution samples, and QC pool samples with relative standard deviation (RSD) < 30% and then normalized using a locally estimated scatterplot smoothing (LOESS) approach by means of QC pool samples injected regularly between ten actual samples followed by sample-weight and injection volume normalization. Data were exported as the detector signal intensity in arbitrary units (A.U.).
Biochemical analyses of bone turnover markers
Rat/Mouse TRAP EIA for the quantitative determination of the Tartrate-resistant acid phosphatase (TRAP) for bone resorption and Rat/Mouse P1NP EIA for the determination of the N-terminal propeptide of type I procollagen (P1NP) for bone formation (MyBioSource, San Diego, CA, USA) were measured in mouse serum samples.
Senescence-associated β-galactosidase (β-gal) activity assay
SA-β-gal Activity 96-well assay kit (Cell Biolabs, Inc-USA, Catalog Number CBA-231) was used to measure of SA-β-Gal activity coupled with cell senescence using a fluorometric substrate according to the manufacturer protocol46. Analyzed cells were seeded 48 h before the assay to a black 96-well plate with a clear bottom at a density of 15,000 cells/well. All reagents were freshly prepared on the day of assay. The cells were additionally treated with 50 µM TBHP (tert-butyl hydrogen peroxide) for 1 h at 37 °C and 5% CO2 to induce the process of senescence. Measurements were then performed in fluorescent mode (Excitation ~360 nm/Emission ~465 nm). Total protein concentration was determined by BCA protein assay kit (Merck) using absorbance mode (562 nm) in order to normalize the SA-β-Gal activity data. The results were expressed as a fold change of SA-β-gal activity.
Cellular Reactive Oxygen Species (ROS) detection assay
DCFDA (2,7-dichloro-dihydro-fluoroscein diacetate) (Abcam, Cambridge, United Kingdom) was used to measure the intracellular ROS production of primary BMSCs46. Cells were seeded to a dark, clear bottom 96-well plate at a density of 25,000 cells/well to adhere overnight. The next day, culture growth media was replaced with DCFDA Solution (25 μM) and incubated for 45 min at 37 °C and 5 % CO2. DCFDA was removed and cells were loaded with 1x Buffer supplemented with 50 µM TBHP (tert-butyl hydrogen peroxide) for 1 h at 37 °C and 5% CO2. The fluorescent intensity was detected every minute for 30 min using a fluorescent microplate reader (Excitation ~485 nm/Emission ~535 nm). The results were expressed as % of ROS production.
Statistics and reproducibility
Unless otherwise indicated, all data are collected from at least two independent experiments performed in triplicates. The statistical significance of the differences in the means of experimental groups was determined by unpaired t-test or ANOVA and Bonferroni or Tukey’s post hoc tests using GraphPad Prism 5.0a software. The data are presented as means ± SEM. P value < 0.05 was considered statistically significant.
Reporting summary
Further information on research design is available in the Nature Portfolio Reporting Summary linked to this article.
- SEO Powered Content & PR Distribution. Get Amplified Today.
- PlatoData.Network Vertical Generative Ai. Empower Yourself. Access Here.
- PlatoAiStream. Web3 Intelligence. Knowledge Amplified. Access Here.
- PlatoESG. Carbon, CleanTech, Energy, Environment, Solar, Waste Management. Access Here.
- PlatoHealth. Biotech and Clinical Trials Intelligence. Access Here.
- Source: https://www.nature.com/articles/s42003-023-05407-8