All of the experiments were performed in accordance with the relevant institutional and national guidelines and regulations.
Cell culture
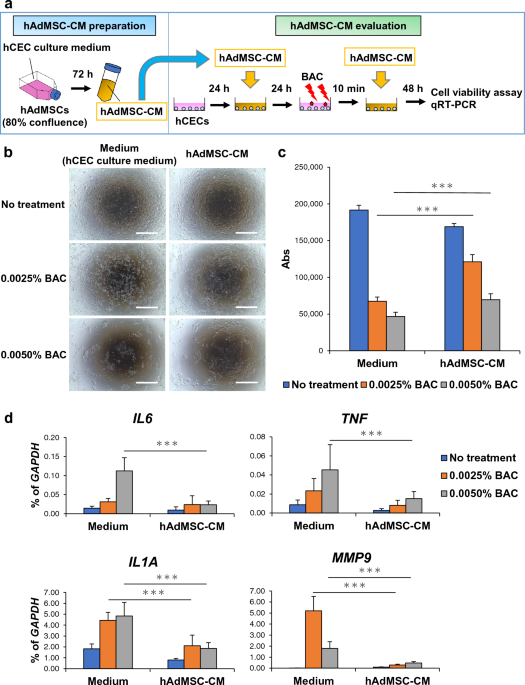
hAdMSCs were acquired from PromoCell (Heidelberg, Germany) and cultured in Cellartis MSC Xeno-Free Culture Medium (hMSC culture medium; Takara Bio, Shiga, Japan). To prepare hAdMSC-CM, hAdMSCs were expanded to 70–80% confluence in a T-75 flask. The medium was changed to hMSC or hCEC culture medium (DMEM/F12 (Thermo Fisher Scientific, Tokyo, Japan) containing 2% B-27 supplement (Thermo Fisher Scientific), 20 ng mL−1 KGF (Wako, Osaka, Japan), 10 μM Y-27632 (Wako), 100 U mL−1 penicillin potassium, and 100 μg mL−1 streptomycin sulphate). The supernatant was collected after 72 h of culture, centrifuged at 1500 rpm, and frozen at − 80 °C. hCECs were isolated using an established method and cultured in hCEC culture medium50. hCECs were handled according to the tenets of the Declaration of Helsinki. To induce cytotoxicity, inflammation, and barrier dysfunction, BAC (Sigma-Aldrich, Burlington, MA, USA) was administered to hCECs for 10 min. The concentration of BAC was based on previous reports, and most hCECs died after 10 min of treatment at a concentration of 0.01% BAC22,24. Therefore, hCECs were treated with 0.0025% BAC or 0.005% BAC for 10 min. Phase-contrast images of hCECs and hAdMSCs were acquired using an EVOS FL Auto system (Thermo Fisher Scientific) and an Axio Observer D1 microscope (Carl Zeiss, Jena, Germany).
Flow cytometry
The hAdMSCs were collected using Accutase (Thermo Fisher Scientific). Dissociated cells were stained with PE-conjugated anti-CD29 (555,443, BD Biosciences, San Jose, CA, USA), PE-conjugated anti-CD34 (343,506, BioLegend, San Diego, CA, USA), PE-conjugated anti-CD45 (304,008, BioLegend), PE-conjugated anti-CD73 (550,257, BD Biosciences), PE-conjugated anti-CD90 (IM1840U Beckman Coulter, Brea, CA, USA), and PE-conjugated anti-CD105 (560,839, BD Biosciences) for 1 h on ice (Table 2). Flow cytometry was performed using a SH800 cell sorter (Sony Biotechnology, Tokyo, Japan). The flow cytometry results were analysed using SH800 and FlowJo v10.8 Software (BD Biosciences).
Cell viability assay
hCECs were seeded at 9 × 10³ cells/well in 24-well plates. After a 24 h culture, the medium was changed as follows: 1. hMSC culture medium or hAdMSC-CM derived from hMSC culture medium (hAdMSC-CM (m)), 2. hCEC culture medium or hAdMSC-CM derived from hCEC culture medium. Following another 24 h culture, hCECs were cultured in hCEC culture medium containing 0.0025–0.0050% BAC for 10 min, and the medium was then changed as described above. After 48 h of culture, the medium was replaced with hCEC culture medium containing 10% AlamarBlue Cell Viability Reagent (Thermo Fisher Scientific) and incubated at 37 °C for 2 h. Absorbance (Abs) was read using ARVO X4 (PerkinElmer, Waltham, MA, USA) according to the manufacturer’s instructions (Thermo Fisher).
Quantitative real-time reverse transcription PCR (qRT-PCR)
The mRNA expression of hCECs and rat corneas was analysed using qRT-PCR. The rat cornea was pulverised using the TissueLyser II (Qiagen, Venlo, Netherlands) system. Total RNA was extracted using QIAzol Lysis Reagent (Qiagen), and cDNA was synthesised using the SuperScript III First-Strand Synthesis System (Thermo Fisher Scientific). Quantitative PCR was performed using the ABI PRISM 7500 Fast Sequence Detection System (Thermo Fisher Scientific), according to the manufacturer’s instructions. The primers used in this study are listed in Table 3.
Transepithelial Electrical Resistance (TER)
hCECs were seeded at 2.5 × 10⁴ cells/insert in 12-well cell culture inserts. After a 24 h culture, the medium was changed to hCEC culture medium or hAdMSC-CM derived from hCEC culture medium for the apical chamber. For the basal chamber, the medium was changed to hCEC culture medium without KGF and Y-27632. Following another 24 h culture, the medium was replaced with hCEC culture medium (containing 0.0025% BAC for the apical chamber) for 10 min. Then, for both the apical and basal chambers, the medium was changed as mentioned above. After 24 h of culture, TER was measured using MilliCell ERS-2 (Millipore, Billerica, MA, USA) according to the manufacturer’s instructions.
Immunofluorescence staining
The hCECs and rat corneas were fixed in 4% paraformaldehyde (Wako). Samples were washed three times with Tris-buffered saline (TBS; Takara Bio) and incubated with TBS containing 5% normal donkey serum (Jackson ImmunoResearch, Bar Harbor, Maine, USA) and 0.3% Triton X-100 (Sigma-Aldrich, St. Louis, MO, USA) for 1 h to block non-specific reactions. Subsequently, they were incubated with the primary antibodies listed in Table 2 at 4 °C for 24 h. Samples were then washed three times with TBS and stained with Alexa Fluor 488- and AF568-conjugated secondary antibodies (Thermo Fisher Scientific) and Hoechst 33,342 (Thermo Fisher Scientific) at room temperature for 1 h. Thereafter, the stained samples were washed with TBS three times and observed under a fluorescence microscope FV3000 (Olympus, Tokyo, Japan).
RNA sequencing analysis
cDNA library preparation from RNA and analyses were performed using a pipeline provided by Rhelixa, Inc. Briefly, the NEBNext Poly(A) mRNA Magnetic Isolation Module and NEBNext Ultra II Directional RNA Library Prep Kit were used for cDNA library preparation, and the Illumina NovaSeq 6000 system was used for sequencing in the 150-bases paired-end mode. FastQC v.0.11.7, was used for a quality check of the sequencing run, and Trimmomatic v.0.38 was used to trim the sequenced reads. HISAT2 v.2.1.0. was used to map the sequenced reads to the human reference genome sequences (hg38). The number of raw reads mapped to the exon regions was calculated using FeatureCounts v.1.6.3. The analysis of differentially expressed genes (DEGs) and heat mapping were performed using integrated Differential Expression and Pathway analysis (iDEP v.0.95).
Western blot analysis
Whole cell lysates were extracted using RIPA buffer containing a proteinase inhibitor cocktail (Nacalai Tesque, Kyoto, Japan) and PhosSTOP (Roche, Basel, Switzerland). Protein concentrations were measured using the Pierce BCA Protein Assay Kit (Thermo Fisher Scientific). Protein samples (25 µg) were loaded on NuPAGE 4–12% Bis–Tris gels (Thermo Fisher Scientific) and transferred to polyvinylidene fluoride membranes (GE Healthcare, Chicago, IL, US). Thereafter, membranes were blocked with 5% bovine serum albumin (Sigma) or 5% skim milk (Wako) in TBS with Tween-20 (TBST; Takara Bio) for 1 h. Next, membranes were incubated with the primary antibodies listed in Table 2 at 4 °C for 24 h. Subsequently, the membranes were incubated with HRP-conjugated secondary antibodies (1:5000; GE Healthcare) at RT for 1 h, and then detected with ECL Select Western Blotting Detection Reagent (GE Healthcare). Protein bands were visualised using a Molecular Imager ChemiDoc XRS + system (Bio-Rad Laboratories, Hercules, CA, USA). For stripping the protein bands, membranes were incubated at 50 °C for 30 min in stripping buffer, which was composed of 10% sodium dodecyl sulphate (Wako), 0.5 M tris (hydroxymethyl) aminomethane hydrochloride (Nacalai Tesque), and 100 mM 2-Mercaptoethanol (Sigma). Membranes were then blocked and incubated with subsequent antibodies.
Signalling pathway inhibitor experiments
SB431542 (SB; Cayman Chemical, Ann Arbor, MI, US) and ruxolitinib (ru; Cayman Chemical) were dissolved in dimethyl sulfoxide (Wako) as stock solutions. hCECs were treated with SB431542 (1, 10, and 30 µM) or ruxolitinib (0.3, 3, and 30 µM). Next, hCECs were analysed for viability, inflammation, and barrier function.
TUNEL assay
Apoptotic cells were detected using the TUNEL Apoptosis Detection Kit (Roche). Briefly, hCECs were fixed in 2% paraformaldehyde (Wako). Samples were washed three times with TBS and incubated with 0.1% Trisodium Citrate (Wako) and 0.3% Triton X-100 (Sigma-Aldrich, St. Louis, MO, USA) for 2 min to block non-specific reactions. Intracellular DNA fragments were labeled using the TUNEL reaction mixture and stained with Hoechst 33342 at room temperature for 1 h. The stained samples were then washed with TBS thrice and observed under a FV3000 fluorescence microscope.
Exorbital and intraorbital lacrimal gland excision
All animal experiments were performed in accordance with ARRIVE guidelines and the ARVO Statement for the Use of Animals in Ophthalmic and Vision Research and were approved by the animal ethics committee of Osaka University (certificate number 02–024-000). Male Slc:SD rats (body weight 200–250 g, aged 7 weeks, SLC, Inc., Tokyo, Japan) were anaesthetised with an intraperitoneal injection of 0.15 mg kg−1 medetomidine hydrochloride (Nippon Zenyaku Kogyo, Fukui, Japan), 2.0 mg kg−1 midazolam (Maruishi Pharmaceutical, Osaka, Japan) and 2.5 mg kg−1 butorphanol tartrate (Meiji Seika Pharma, Tokyo, Japan). Under deep anaesthesia, the exorbital and intraorbital lacrimal glands were excised only on the left side, after which the incisions were sutured with an 8–0 nylon thread using a stereomicroscope (Olympus). After surgery, 0.3% ofloxacin ointment (Santen Pharmaceutical, Osaka, Japan) and 0.1% betamethasone sodium phosphate ointment (Shionogi Pharmaceutical) were administered twice daily.
Ocular instillation of hAdMSC-CM, measurements of tear production, and fluorescein stain scoring
One week after exorbital and intraorbital lacrimal gland excision, the rats were anaesthetised with 3% inhalant isoflurane, and tear production was measured using Zone-Quick (Showa Yakuhin, Tokyo, Japan) for 10 s. Next, the rat cornea was stained with 2 µL 0.5% fluorescein for 1 min and washed five times with 1 mL Sterile Saline (Otsuka Pharmaceutical Factory, Tokushima, Japan). The corneal epithelial damage grade was evaluated using a slit-lamp microscope (Carl Zeiss), and fluorescein stain scoring was assessed. The cornea was divided into four quadrants, and each quadrant score was evaluated individually. Each quadrant was scored from 1 to 5: 1 = no staining; 2 = weak, fluorescence is partially dotted; 3 = weak, fluorescence is scattered throughout; 4 = strong, fluorescence is scattered throughout; and 5 = strong, fluorescence is scattered without gaps. The scores of the four quadrants were summed to arrive at the final score (minimum = 4, maximum = 20). After the rats with the highest and lowest fluorescein staining scores were excluded, they were randomly divided into four groups (1. Normal; 2. LG-Ex; 3. LG-Ex + ocular instillation for hCEC culture medium; 4. LG-Ex + ocular instillation of hAdMSC-CM). After grouping, 10 µL of hCEC culture medium or hAdMSC-CM was applied to the left eye three times per day for one week, and tear production measurement and fluorescein staining were conducted under anaesthesia. Finally, all rats were sacrificed and the cornea was used for qRT-PCR, immunofluorescence staining, and H&E staining.
H&E staining
The rat corneas were fixed with 10% formaldehyde neutral buffer solution (Nacalai Tesque) and paraffin (Thermo Fisher Scientific) using an ASP6025 Tissue Processor (Leica, Wetzlar, Germany). Samples were cut into 8 µm sections using a SM2010R microtome (Leica) and stained with H&E (Sakura Finetek Japan, Tokyo, Japan). Subsequently, the sections were imaged using an Axio Observer Z1, D1 (Carl Zeiss).
Statistical analysis
All data are presented as mean ± SD. The Student’s t-test was performed for two-group comparisons of parametric data (Fig. 4c). The Mann–Whitney U test was performed for two-group comparisons using non-parametric data (Fig. 4b). The Tukey–Kramer test was performed for multiple comparisons of parametric data (Fig. 1c, d, 2b,g, 3c,f, and Supplementary Fig. S4b, S4c). Steel–Dwass tests were performed for multiple comparisons in non-parametric data (Fig. 4d and Supplementary Fig. S7a, S7b). All statistical analyses were performed using Bell Curve for Excel v.3.20 (Social Survey Research Information Co., Ltd., Tokyo, Japan). All statistical analyses were conducted with a significance level of a = 0.05 (p < 0.05).
- SEO Powered Content & PR Distribution. Get Amplified Today.
- PlatoData.Network Vertical Generative Ai. Empower Yourself. Access Here.
- PlatoAiStream. Web3 Intelligence. Knowledge Amplified. Access Here.
- PlatoESG. Automotive / EVs, Carbon, CleanTech, Energy, Environment, Solar, Waste Management. Access Here.
- PlatoHealth. Biotech and Clinical Trials Intelligence. Access Here.
- ChartPrime. Elevate your Trading Game with ChartPrime. Access Here.
- BlockOffsets. Modernizing Environmental Offset Ownership. Access Here.
- Source: https://www.nature.com/articles/s41598-023-40136-2