PCs as the origin of intestinal tumors in the context of inflammation
We first reported on the ability of PCs to re-enter the cell cycle and dedifferentiate upon irradiation and inflammation to acquire stem cell-like features and contribute to the tissue regenerative response11,12,13. Consequently, we questioned whether PCs could be the origin of intestinal cancer in the context of inflammation. We bred mice carrying lox alleles at the tumor suppressors and oncogenes most frequently mutated along the adenoma-to-carcinoma sequence, namely Apc14, Kras15 and Trp53 (encoding p53)16, each combined with Cre specific for Lgr5+ ISCs (Lgr5CreERT2-EGFP)17 or for PCs (Lyz1CreERT2)18. Following Cre activation by tamoxifen, dextran sulfate sodium (DSS) was administered through drinking water to model inflammation (Fig. 1a). In the absence of DSS-induced inflammation, PC-specific single gene mutations did not give rise to intestinal tumors. By contrast, loss of Apc in Lgr5+ ISCs transformed crypts into β-cateninhi foci that grew into multiple adenomas 4–6 weeks after Cre induction (Fig. 1b). When single gene mutations were combined with DSS administration, Apc loss in PCs resulted in increased nuclear and cytoplasmic β-catenin expression eventually leading to the formation of PC-derived adenomas (Fig. 1c). Of note, Paneth-specific Kras or Trp53 mutations did not result in tumor formation even in the presence of the inflammatory stimulus (Fig. 1d). However, the compound loss of Apc and oncogenic activation of Kras in PCs resulted in a striking increase in tumor multiplicity (6.1-fold) even in the absence of DSS (6.9-fold) (Fig. 1e). The combination of Apc and Trp53 mutations in PCs also led to an increase in tumor multiplicity upon DSS administration (1.6-fold), although to a lesser extent when compared with the compound Apc/Kras-mutant genotype, possibly indicating a distinct mechanism underlying tumor onset in these mice. Indeed, phospho-histone H2A.X (Ser139) immunohistochemistry (IHC) analysis confirmed an increase in DNA damage and chromosomal instability in Trp53-mutant tumors (Extended Data Fig. 1a). Targeting all three genes in PCs resulted in a very aggressive phenotype with high tumor multiplicity (10.1-fold) in the absence of the inflammatory stimulus (Fig. 1e). When compared with Apc-driven tumors that originated in PCs, the histology of adenomas from mice in which two or three genes were targeted revealed a progressive increase in dysplasia and invasive morphology (Extended Data Fig. 1b). The distribution of adenomas along the small intestine also followed distinct patterns with a prevalence of duodenal tumors in compound Apc/Kras tumors regardless of DSS (Extended Data Fig. 2a).
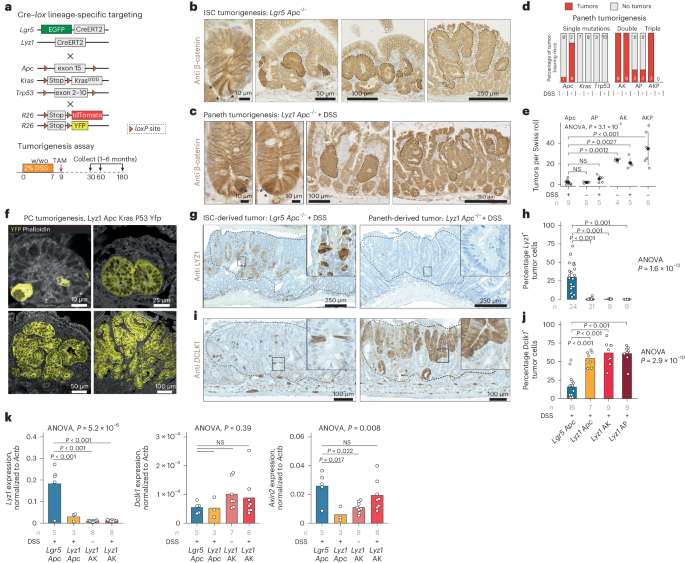
a, Cre–lox strategy aimed at the targeting of Apc, Kras and Trp53 mutations in ISCs (Lgr5+ ISCs) and PCs (Lyz1+ PCs). w/wo indicates the presence (with) or absence (without) of DSS. b,c, β-Catenin IHC analysis of intestinal tumors initiated from Lgr5+ ISCs (b) and PCs (c). Asterisks indicate Lgr5+ ISCs and PCs with enhanced cytoplasmic and nuclear β-catenin accumulation; tumor foci and adenomas are indicated by dashed lines. d,e, Tumor multiplicity was calculated according to tumor-bearing mice (d) and by tumor number per genotype (e) in the presence/absence of DSS and based on Swiss roll counts. Error bars denote s.d. P values denote one-way ANOVA and Tukey’s post hoc tests for group comparisons. f, Lineage-tracing analysis of PCs, labeled using yellow fluorescent protein (YFP), at different stages of tumor initiation and progression. g–j, LYZ1 (g) and DCLK1 (i) IHC analysis of Lgr5+ ISC-derived (left) and PC-derived (right) adenomas, and quantification of number of Lyz1+ (h) and Dclk1+ (j) tumor cells. P values depict one-way ANOVA and Tukey’s post hoc tests for group comparisons. k, Lyz1, Dclk1 and Axin2 quantitative PCR expression analysis across different adenoma genotypes. P values represent one-way ANOVA and Tukey’s post hoc tests for group comparisons.
To validate the PC origin of the observed intestinal tumors, we bred Lyz1CreERT2 mice with R26LSL-tdTomato or R26LSL-YFP reporters and traced their lineage upon tamoxifen-driven targeting of the Apc, Kras and Trp53 mutations. As shown in Fig. 1f and Extended Data Fig. 2b, this confirmed the PC origin of the corresponding tumors by capturing the process from microscopic lesions to adenoma formation.
Overall, these results demonstrate that PCs can initiate intestinal adenomas upon genetic ablation of Apc in the context of inflammation. In combination with Apc loss, activation of oncogenic Kras or loss of Trp53 function rescues the need for an inflammatory stimulus and results in increased PC-derived tumor multiplicities and progression to a malignant phenotype.
Next, we characterized lineage-specific markers in PC- and ISC-originated tumors using IHC. Of note, although cells expressing the PC marker lysozyme (LYZ1) were notable in Lgr5-derived tumors (Lgr5/Apc: 30.0% ± 18.5% positive tumor cells), they were almost absent in adenomas that originated from PCs (Lyz1/Apc: 0.48% ± 1.16%) (Fig. 1g,h). The opposite was observed for DCLK1 (doublecortin-like kinase 1), a Tuft19 and tumor stem cell marker20,21, that was more frequently detected among PC-derived adenomas (Lyz1/Apc: 54.1% ± 10.5%) when compared with Lgr5-derived tumors (Lgr5/Apc: 15.6% ± 15.7%) (Fig. 1i,j). Other lineage-specific markers for enteroendocrine (CHGcA), goblet (MUC2) and stem cells (OLFM4) showed variable levels without clear-cut differences among tumors with different cells-of-origin (Extended Data Fig. 2c). The increased Dclk1 expression in PC-derived tumors is of interest in view of its association with increased immune and stromal infiltration in colon cancer22.
To confirm these results at the transcriptional level, expression levels of Lyz1 and Dclk1 genes were analyzed by quantitative PCR with reverse transcription (Fig. 1k). Indeed, Lyz1 expression was lower in Paneth-derived tumors (Lgr5/Apc versus Lyz1/Apc: log2-transformed fold change = 2.64, P = 7.5 × 10⁻⁴) when compared with Lgr5-derived tumors. Dclk1 expression was very low and variable at the RNA level, and did not show significant differences across the groups.
To assess the relative activation of the WNT signaling pathway among the different tumor groups, we measured expression levels of Axin2, a well-established WNT downstream target. Axin2 expression was higher in Lgr5-derived tumors compared with PC-derived tumors (Lgr5/Apc versus Lyz1/Apc: log2-transformed fold change = 2.12, P = 0.017) (Fig. 1k). Moreover, both Kras oncogenic activation and inflammation gradually increased Axin2 levels in PC-derived tumors, in agreement with the previously reported synergism between Apc and Kras mutations in activation of the WNT pathway23.
Thus, upon tumorigenesis, PCs dedifferentiate to a state that hampers secretory differentiation leading to specific patterns of tumor histology and gene expression distinct from that of Lgr5-derived tumors.
PCs dedifferentiate into revival stem cells upon enhanced WNT signaling activation
To elucidate the mechanisms that underlie the conversion of PCs into cells-of-origin of small intestinal tumors in the context of inflammation and/or of specific genetic hits, we combined single-cell RNA sequencing (scRNA-seq) analysis with lineage tracing. To this end, we induced the Apc, Kras and Trp53 genetic mutations in R26LSL-tdTomato/Lyz1CreERT2 (or R26LSL-YFP) reporter strains in the presence or absence of DSS (Fig. 2a). Subsequently, cells were harvested from the intestinal epithelium, purified by FACS and transcriptionally profiled by scRNA-seq (Methods and Extended Data Fig. 3). After preprocessing, we obtained the transcriptomes of 23.231 epithelial cells from 32 mice, distributed over the different lineages of the intestinal epithelium (Fig. 2b). Close examination of cells positive for the reporter genes revealed novel clusters of PCs that arise upon DSS administration and specific gene mutations, but were not observed among PCs under homeostatic conditions (PC cluster 1–4, Fig. 2c).
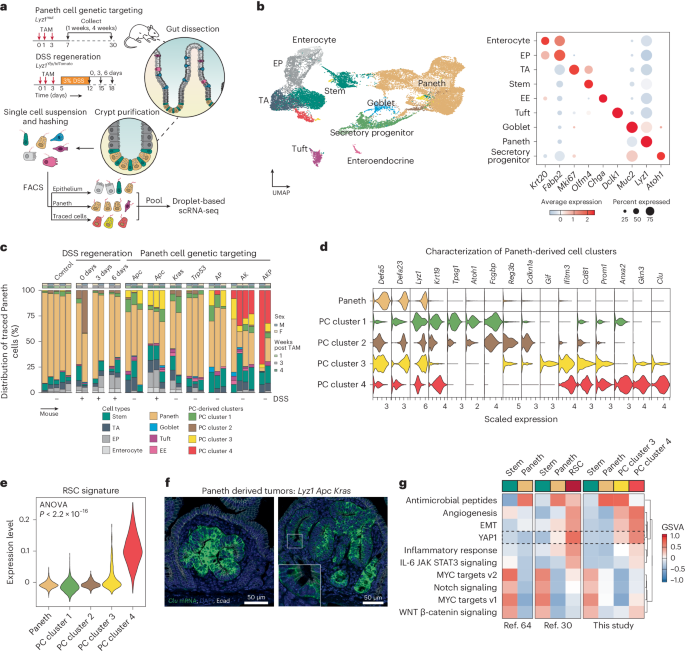
a, Schematics of the experimental approach, adapted from ref. 63, Springer Nature Limited. After genetic targeting of PCs, intestinal crypts were extracted, and the isolated cells were labeled with hashing antibodies and sorted according to three different strategies: epithelium, PC-enriched and PC-traced cells. b, UMAP embedding of the different cell clusters or lineages (left), annotated according to the expression of canonical marker genes (right). EE, enteroendocrine cells; EP, enterocytes progenitors; TA, transit-amplifying cells. c, Bar plot of the distribution of traced cells across the different mouse genotypes and experimental conditions. d, Violin plots representing marker genes of the newly identified Paneth-derived cell clusters (PC cluster 1–4). e, Association analysis of the RSC signature with PC cluster 1–4. The P value denotes the result of one-way ANOVA. f, RNA in situ hybridizations of the Clu gene in small tumors derived from PCs upon compound targeting of Apc and Kras mutations. g, Gene sets variation analysis among refs. 30,64 and the current study. EMT, epithelila-to-mesenchymal transition.
To characterize the novel PC-derived states, we performed differential expression analysis and identified cluster-specific markers (Fig. 2d and Supplementary Table 1). Whereas PC cluster 1 appeared at low frequency across different genotypes, PC cluster 2 arises directly upon exposure to the inflammatory stimulus. Both PC cluster 1 and cluster 2 are characterized by increased expression of two markers of radio-resistant and secretory progenitors with self-renewal capacity during regeneration, namely Krt19 (ref. 24) and Atoh1 (ref. 25), whereas increased expression of Reg3b, known for its protective role in the development of colitis and ileitis26, and Cdkn1a (encoding p21), a marker of terminal differentiation in the intestine27, was observed in cluster 2 compared with cluster 1.
PC cluster 3 became apparent in mice carrying Apc mutations (7.23% ± 5.77% of traced cells) alone and in combination with DSS treatment (16.40% ± 2.10% of traced cells), and in double- and triple-mutant (AP, AK and AKP) mice, although not in mice carrying single Kras or Trp53 mutations. PC cluster 3 showed increased expression of Gif (gastric intrinsic factor), Cd81, a tetraspanin family member known to mark the response to gamma-irradiation and correlated with the expression of ISC- and proliferation genes28, and Prom1 (also known as CD133), a well-established colon cancer stem cell marker29.
PC cluster 4 consisted of cells from mice in which double (AK) and triple (AKP) mutations were targeted to PCs (23.25% ± 11.23% and 52.26% ± 28.23% of traced cells, respectively). Increased expression of Anxa2 (encoding annexin 2), a functional marker of inflammatory response, and Clu (clusterin), previously shown to earmark revival stem cells (RSCs) upon gamma-irradiation30, feature in PC cluster 4. Accordingly, evaluation of the RSC signature showed elevated expression among the PC clusters (Fig. 2e), and in situ hybridization analysis in PC-derived tumors from mice carrying compound mutations (AK and AKP) (Fig. 2f and Extended Data Fig. 4a,b) confirmed increased Clu expression. Finally, pathway analysis revealed the similarities between the PC-derived cluster 4 and RSCs, both earmarked by the activation of Yap1 signaling and specific inflammatory pathways (Fig. 2g). Compared with RSCs, PC-derived and Apc/Kras-mutant cells from cluster 4 showed increased levels of TGFβ and WNT signaling (Extended Data Fig. 4c).
Thus, upon genetic targeting or inflammatory stimulus, PCs escape their homeostatic identity and acquire distinct cellular features, as shown by scRNA-seq and FACS analysis (Extended Data Fig. 4d,e). Of note, DSS treatment led to lower expression of Lgr5 and Ascl2 in stem cells, as well as a lower association of the ISC signature, confirming our and others’ previous observations that resident stem cells lose their multipotency upon acute inflammation13 (Extended Data Fig. 4f).
Collectively, these findings demonstrate that PCs efficiently dedifferentiate upon genetic targeting or inflammatory stimulus leading to distinct cellular identities. During tumorigenesis driven by Apc/Kras, PCs share features with the YAP1-dependent RSC identity, and further activate TGFβ and WNT signaling in their conversion to bona fide tumor cells.
Transcriptomic comparison of Paneth- and Lgr5-derived tumors reveals a dichotomy in stem cell phenotypes
To investigate the consequences of cell-of-origin identity on the transcriptional profile of the resulting intestinal tumors, we performed bulk RNA sequencing (RNA-seq) of macroscopically dissected lesions originating from ISCs and PCs (Fig. 3a). Principal component analysis (PCA) revealed that the major variance component (61%) was attributed to differences in the cell-of-origin, whereas the impact of genotype or inflammatory stimulus became notable in the second component of variation (10%) (Fig. 3b). Differential expression analysis between tumors derived from PCs and ISCs in the same genetic and inflammatory context (Apc and DSS) revealed tumor signatures specific for each cell-of-origin (Supplementary Table 2).
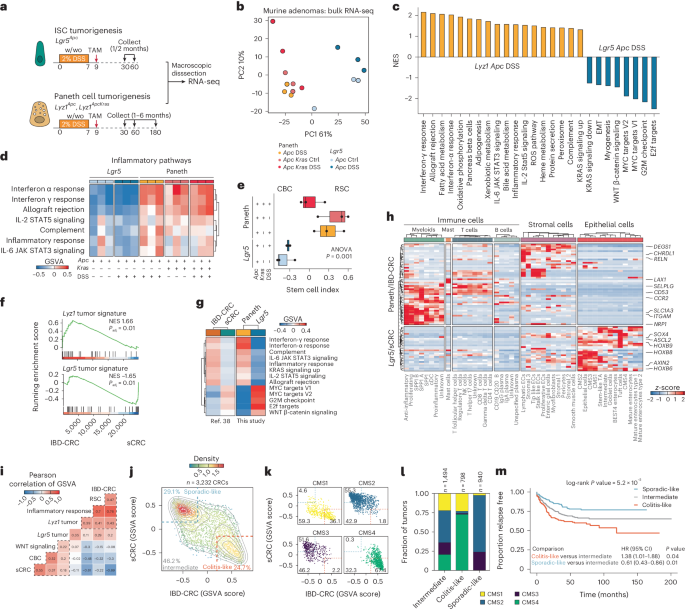
a, Schematics of the experimental approach to compare PC- and Lgr5-derived adenomas. b, PCA plot showing that the cell-of-origin is the dominant discriminator of variance. Ctrl, control. c, Bar plot summarizing the GSEA between Paneth-derived (Lyz1 Apc DSS) and ISC-derived (Lgr5 Apc DSS) tumors. Pathways were filtered based on P < 0.05 and absolute normalized enrichment score (NES) > 0.5. Pathways that are significant in the IBD-CRC versus sCRC comparison have bold labels. ROS, reactive oxygen species. d, Subset of inflammatory pathways, visualized as a heatmap based on values from the GSVA. e, Box plots showing results of the stem cell index. The P value depicts the result of one-way ANOVA. n = 3 biologically independent samples per group. Box plots display the median, lower and upper hinges corresponding to the first and third quartiles. Whiskers extend from the hinges to maximum or minimum values, no further than 1.5× interquartile range. f, GSEA showing a significant but opposite association between the Lyz1 tumor signature and IBD-CRCs, and between the Lgr5 tumor signature and sCRC. The P value denotes the Benjamini–Hochberg adjusted value of the two-sided enrichment P value from GSEA. g, Heatmap showing GSVA scores, averaged per tumor group, of pathways with similar patterns between the mouse and human tumor groups. h, Heatmap highlighting differentially expressed genes (log2-transformed fold change > 1.5, Padj < 0.01. Two-tailed P values were derived from the Wald test with Benjamini–Hochberg correction for multiple testing shared between the Paneth or IBD tumors and the Lgr5 or sCRC tumors. Values denote z-scores of average expression per cell type. cDC, conventional dendritic cells; EC, endothelial cells; NK, natural killer cells; Ig, immunoglobulin. i–m, Two distinct sporadic colon cancer identities become apparent upon analysis of a large cohort of CRC tumors (n = 3,232 samples). i, Heatmap showing Pearson correlations of the GSVA scores. j–k, Scatter plot showing two distinct clusters, sporadic-like and colitis-like, in all colon cancers (j) and stratified according to their CMS (k). Gray lines indicate contours lines, and dashed lines show thresholds to classify tumors in colitis-like, sporadic-like and intermediate groups. l, Stacked bar plot analysis showing the distribution of CMS1 to CMS4 across colitis-like and sporadic-like colon cancers. m, Kaplan–Meier survival analysis for relapse-free survival. P values denote the result of the log-rank test and Cox regression models for univariate analyses. Hazard ratios (HR) and confidence intervals (CI) are shown for pairwise comparisons.
Gene set enrichment analysis (GSEA) indicated that tumors derived from ISCs were characterized by high levels of MYC and WNT signaling, whereas PC-derived adenomas showed higher levels of inflammatory pathways indicative of infiltration from the tumor microenvironment (TME) (Fig. 3c and Extended Data Fig. 5). Of note, the inflammatory characteristics of PC-derived tumors were observed also in mice in which Apc and Kras mutations were targeted to PCs in the absence of DSS-driven inflammation (Fig. 3d), indicating that specific mutant genotypes and type of cell-of-origin can trigger tumor initiation by mimicking the inflammatory context otherwise brought about by DSS.
Next, we used the ISC index31 (Methods) to predict the relative proportions of RSC and crypt-base columnar (CBCs) stem cells in the intestinal tumors. In agreement with the scRNA-seq analysis, PC-derived tumors were RSC-enriched, whereas ISC-derived tumors consisted mainly of CBCs (Fig. 3e). Notably, the highest RSC contribution was observed in tumors originating from Apc/Kras-mutant PCs in the absence of inflammation, when compared with the equivalent genotype upon DSS administration. The latter is of relevance to dissect the relative contribution of inflammatory insult and somatic mutations in the dedifferentiation process leading to tumor initiation. As mentioned before, one of the primary effects of various forms of tissue injury to the intestinal epithelium is the loss of resident stem cells. In a study by Singh et al.32, ablation of Lgr5+ ISCs was performed to study its consequences using scRNA-seq. Our analysis of these datasets revealed elevated expression of secretory genes in regenerated stem cells normally restricted to the PC lineage (Extended Data Fig. 6a). In parallel, upon Lgr5+ cell ablation, PCs and goblet cells partially activate the RSC program (Extended Data Fig. 6b), indicating that stem cell loss is sufficient to trigger plasticity and RSC reprogramming from PCs. Hence, to assess whether removal of the resident stem cells is sufficient to activate the lineage-tracing capacity of PCs in the absence of inflammatory injury, we implemented a similar diphtheria toxin receptor (DTR)-based Lgr5+ ablation experiment33. As shown in Extended Data Fig. 6c,d, lineage tracing from PCs was similar to that previously shown upon inflammation13.
Together, these results indicate that the cell-of-origin embodies the major source of intertumor variability, and that the Paneth or ISC origin is reflected by the RSC- or CBC-like profile of the resulting tumors, respectively. Notably, inflammation-driven ISC loss activates dedifferentiation at the epithelial level.
The transcriptional profile of Paneth-derived tumors mimics colitis-associated colorectal cancer
The small intestinal location of PCs and the tumors originating from them raises questions on the relevance of our study for colon cancer, one of the most frequent causes of morbidity and mortality because of malignancy. To explore the general applicability of our results, we first analyzed bulk RNA-seq and scRNA-seq data from two distinct studies34,35 centered around the azoxymethane (AOM)/DSS mouse model of colitis-driven colon cancer36. This protocol relies on the oncogenic β-catenin mutations caused by AOM, which in combination with DSS-driven ulcerative colitis, result in multiple adenocarcinomas in the distal colon. As shown in Extended Data Fig. 6e (CIBERSORTx37; Methods), analysis of the bulk RNA-seq data35 from AOM/DSS-derived colon tumors revealed an abundant subpopulation reminiscent of the RSC-like PC cluster 4. Moreover, analysis of scRNA-seq data35 confirmed that AOM/DSS-derived colon tumors, when compared with their sporadic counterparts, were distinct in terms of the qualitative and quantitative composition of their TME, namely a pronounced presence of infiltrating immune cells and tumor-associated fibroblasts (Extended Data Fig. 6f). Accordingly, tumor cells derived in the context of AOM/DSS share transcriptional similarity with Paneth-derived tumor cells and RSCs (Extended Data Fig. 6g,h).
Hence, notwithstanding the small intestinal location of the PC-derived tumors, their gene expression signatures and overall inflammatory TME profiles are characteristic of colitis-associated carcinoma in the mouse.
Next, in view of the marked differences in the transcriptional profiles between mouse intestinal tumors with distinct cells-of-origin, we questioned whether similar differences distinguish human sporadic colon cancers from those that arise in the context of IBD. RNA-seq profiles of human microsatellite stable (MSS) sporadic colorectal cancers (sCRC, n = 38) and from patients with inflammatory bowel disease (IBD-CRC, n = 14) were interrogated38. GSEA of the most differentially expressed genes (log2-transformed fold change > 5, adjusted P (Padj) < 0.01) from the mouse tumors (Lyz1 tumor signature, n = 27 genes; Lgr5 tumor signature, n = 40 genes) revealed a significant association between the Lyz tumor signature and IBD-CRC (NES = 1.67, Padj = 6.2 × 10⁻³), whereas the Lgr5T profile was significantly associated with sCRC (NES = −1.62, Padj = 0.013) (Fig. 3f, Extended Data Fig. 7a–c and Supplementary Table 3). Evaluation of the hallmarks from the molecular signature database39 revealed gene sets common to PC-derived tumors and IBD-related CRCs (interferon alpha/interferon gamma, inflammatory response, IL-6/IL-2 signaling, KRAS, complement, allograft rejection), and to Lgr5-derived tumors and sCRCs (MYC targets, G2M checkpoint, E2F targets and WNT β-catenin signaling) (Fig. 3g and Extended Data Fig. 7d).
We then compared the differentially expressed genes from PC-derived versus Lgr5-derived mouse tumors and human IBD-CRC versus sCRC (Paneth/IBD-CRC, n = 49 genes; Lgr5/sCRC, n = 27 genes) and visualized their expression across different cell types based on a large scRNA-seq CRC study40 (Fig. 3h). Of note, the markers shared between PC-derived tumors and IBD-CRC were dominantly expressed in myofibroblasts (for example, ITGAM, SLC1A3), T cells (for example, SELPLG, LAX1) and stromal cells (for example, CHRDL1, RELN). By contrast, Lgr5-derived tumors/sCRC markers were mostly observed in epithelial cells (for example, HOXB6, HOXB8, HOXB9, AXIN2, ASCL2), indicating the difference in stromal composition among these tumors (Fig. 3h). Comparison of a set of gene signatures (Supplementary Table 4) in a large CRC cohort41 confirmed the presence of two distinct identities (Fig. 3i,j): a colitis-like identity enriched with RSCs and prevalent in consensus molecular subtype 4 (CMS4) (67%) and CMS1 (36%) tumors; and a sporadic-like identity enriched with CBCs and common in CMS2 (55%) and CMS3 tumors (52%) (Fig. 3k,l and Extended Data Fig. 7e). Survival analysis revealed significant differences in relapse-free survival between the sporadic- and colitis-like CRC groups (P = 5.2 × 10⁻⁵) (Fig. 3m). Thus, transcriptional signatures derived from small intestinal mouse tumors originating from PCs significantly overlap with those from human colon cancer that arose in the context of IBD, possibly revealing a common cell-of-origin in secretory lineages.
Next, we investigated whether the inflammatory profile observed in PC-derived tumors is earmarked by distinct immune cell populations. By means of gene set variation analysis (GSVA) with a tumor-infiltrating lymphocyte-specific gene signature42, a statistically significant higher tumor-infiltrating lymphocytes score was observed in PC-derived versus Lgr5-derived mouse tumors (Extended Data Fig. 8a). When using deconvolution of our data with CIBERSORTx37, a significantly higher score was observed for immune cells in PC-derived versus Lgr5-derived tumors (Extended Data Fig. 8b). Furthermore, when zooming in on defined immune cell types, a highly significant and unique enrichment of γδ+ T cells was observed in PC-derived tumors (Extended Data Fig. 8c,d), in contrast to the enrichment of regulatory T (Treg) cells in Lgr5-derived tumors. These findings were in concordance with what we observed for colitis-like versus sporadic-like CRCs (Extended Data Fig. 8e,f). These observations were further validated by analysis of the scRNA-seq data obtained from mouse colonic tumors induced by AOM/DSS previously35. As shown in Extended Data Fig. 9f–h, a subpopulation of Cd8⁻/Cd4⁻ and Pdcd1+/ll17a+ T cells earmarks these tumors, which likely represent the counterpart of γδ+ T cells observed in colitis-like colon cancers.
Western-style diet triggers an inflammatory response leading to dedifferentiation of secretory cells
The relative representation of patient-derived colon cancers whose expression profiles are reminiscent of the PC-derived mouse tumors (~25%; Fig. 3j) vastly exceeds the expected proportion of colon cancers arising in patients with an history of clinically manifest IBD (1–2%)43. One possible explanation for this apparent discrepancy may be that western-style dietary habits, often in combination with chronic over-nutrition and sedentary lifestyles, have been associated with a state of chronic metabolic inflammation, termed ‘metaflammation’44. In particular, a link between the consumption of a diet high in fat and sugar and PC dysfunction has recently been demonstrated45. Moreover, a purified mouse diet that mimics western-style dietary habits and underlies the increased risk of colon cancer (NWD1)46 was recently shown to induce a low degree of chronic intestinal inflammation and other mechanisms that define pathogenesis of human IBD47. Therefore, we hypothesized that etiological drivers of colon cancer other than IBD, including widespread western-style dietary habits, may underlie dedifferentiation and tumor onset mechanisms similar to those observed upon acute DSS-driven inflammation.
To provide support for this hypothesis, we first fed C57BL6/J mice for 3 months with the western-style (NWD1) and control (American Institute of Nutrition 76A (AIN-76A)) diets and compared the transcriptional response of PCs with that obtained upon DSS administration (Fig. 4a). We examined genes upregulated upon inflammatory stimuli (DSS signature; Methods), which showed variable but overall increased levels in NWD1-fed mice when compared with those on the control diet (Fig. 4b). Indeed, GSEA confirmed that the DSS signature was associated significantly with PCs exposed to NWD1 (NES = 2.99, Padj < 0.001), indicating that western-style dietary habits trigger an inflammatory-like response in PCs (Extended Data Fig. 9a). At the gene ontology level, the western-style diet activated signaling pathways related to the cell cycle (G2M checkpoint) and proliferation (mitotic spindle, MYC targets; Extended Data Fig. 9b), suggesting that PCs re-enter the cell cycle upon long-term exposure to a western-style diet, similar to what is observed in DSS-driven inflammation13.
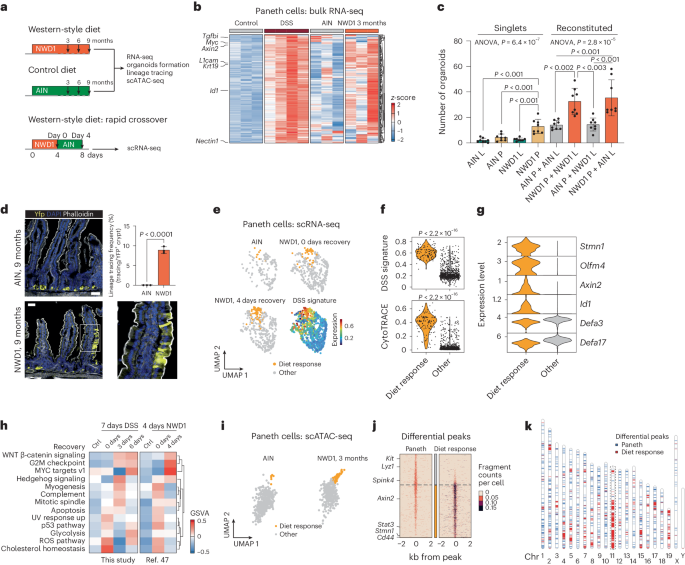
a, Schematics of the experimental approach designed to investigate the consequences of short- and long-term exposure to a western-style diet (NWD1) versus control (AIN-76A) diets. b, Heatmap showing z-scored DSS signature (DSS versus control; Padj < 0.05, log2-transformed fold change > 0.25) in PCs exposed to DSS or NWD1. c, Organoid multiplicities derived either from single ISCs or PCs, and from reconstituted doublets (L, Lgr5+ ISCs; P, PCs). Pooled data from n = 4 independent experiments. P values were calculated using one-way ANOVA and Tukey’s tests for group comparisons. Error bars depict s.d. d, Representative image of lineage tracings from a NWD1-fed Lyz1-YFP mouse. Scale bars, 50 μm. The P value depicts the result of a two-sided Student’s t-test and the error bars represent s.d. Data from n = 3 mice. e, UMAP showing PCs from mice fed AIN-76A (AIN) and NWD1 (n = 3 mice per condition). The DSS signature portrayed on UMAP embedding highlights a subcluster of PCs responsive to the NWD1 diet. f, Violin plots showing different levels of the DSS signature (top) and CytoTRACE score (bottom) between PCs responsive to the NWD1 diet and other PCs. P values show the significance of a two-sided Wilcoxon test. g, Violin plots representing marker genes of PCs responsive to the NWD1 diet, showing coexpression of stem and secretory markers. h, Heatmap visualization of GSVA, indicating pathways that are activated in PCs after exposure to DSS or NWD1. Comparison with data from ref. 47. i, UMAP plot of PC subset in the scATAC dataset of mice treated with AIN (n = 2) and NWD1 (n = 2). j, Heatmap listing differential peaks between diet response PCs and other PCs. k, Ideogram displaying the distribution along the mouse chromosomes (Chr) of the differential peaks observed upon diet response (red) when compared with those characteristic of PCs (blue).
In view of the previously reported acquisition of stem-like features by PCs upon inflammation13, we next used the organoid reconstitution assay (ORA)12,48 to assess whether similar effects are exerted by the western-style diet. We first coincubated Paneth and Lgr5+ cells from AIN-76A- and NWD1-fed mice in all four combinations. As shown in Fig. 4c, PCs from NWD1-fed mice significantly improved organoid formation independently of their reconstitution with Lgr5+ cells from NWD1- or AIN-76A-fed mice, possibly indicative of a paracrine effect enhancing the well-established niche (ISC-supporting) role of PCs. However, single (that is, nonreconstituted with Lgr5+ ISCs) PCs from NWD1-fed mice formed organoids more efficiently when compared with either PCs from AIN-76A-fed mice or with Lgr5+ ISCs from both groups of mice. These ex vivo results were further validated by lineage-tracing analysis of PCs in R26LSL-YFPLyz1CreERT2 NWD1-fed mice that revealed extended yellow fluorescent protein (YFP)-labeled ribbons thus confirming their dedifferentiation and acquisition of stem-like features induced by the western-style dietary cues (Fig. 4d).
To focus in on the primary transcriptional response of PCs to NWD1, we took advantage of the scRNA-seq data generated previously47 upon exposure to NWD1 (Fig. 4a). Within 4 days of switching mice to the NWD1 diet, a subset of PCs became apparent whose transcriptional profile was strongly associated with the DSS signature (labeled ‘diet response cells’ in Fig. 4e). Mirroring our previous observations obtained immediately upon DSS inflammatory stimulus, these WSD-responsive cells increased their transcriptomic diversity as measured by CytoTRACE49 (Fig. 4f and Methods). After short exposure to NWD1, the diet-responsive cells acquired stem cell markers while retaining some secretory features (Fig. 4g). Comparative pathway analysis between the transcriptional response of PCs to DSS and NWD1 revealed similar upregulation of the WNT, MYC, Hedgehog and G2M checkpoint signaling pathways (Fig. 4h).
Because the observed western-style diet-driven changes in gene expression are likely exerted through epigenetic modifications, we next analyzed scATAC (single cell assay for transposase-accessible chromatin with high-throughput sequencing) data obtained in the framework described previously47. Similar to what was observed by scRNA-seq analysis, we identified a group of NWD1 diet-responsive PCs with significant epigenetic modifications, including a main cluster (52%) on mouse chromosome 11 (synthenic with human chromosomes 17 and 5) that encompasses a considerable fraction of the genes encoding for members of the WNT, PI3K–AKT and cell-cycle pathways (Fig. 4i–k and Extended Data Fig. 9c–f). The latter were previously shown by our laboratory to underlie PC dedifferentiation and the acquisition of stem-like features upon DSS-driven inflammation13.
To assess the effects of the NWD1 diet on mouse colon, we searched for proliferating Paneth-like cells, also known as DCS cells9,12. Inflammation-driven cell-cycle activation in these allegedly postmitotic lineages was previously observed in small intestinal PCs of DSS-treated mice and of patients with Crohn’s disease13. By co-staining colonic tissues with the secretory lineage marker wheatgerm agglutinin (WGA)50 and Ki67, a significant increase in the number of proliferating secretory cells located at the crypt bottom was observed both in mice fed the NWD1 diet and, as a positive control, in those administered DSS in their drinking water (Fig. 5a–c).
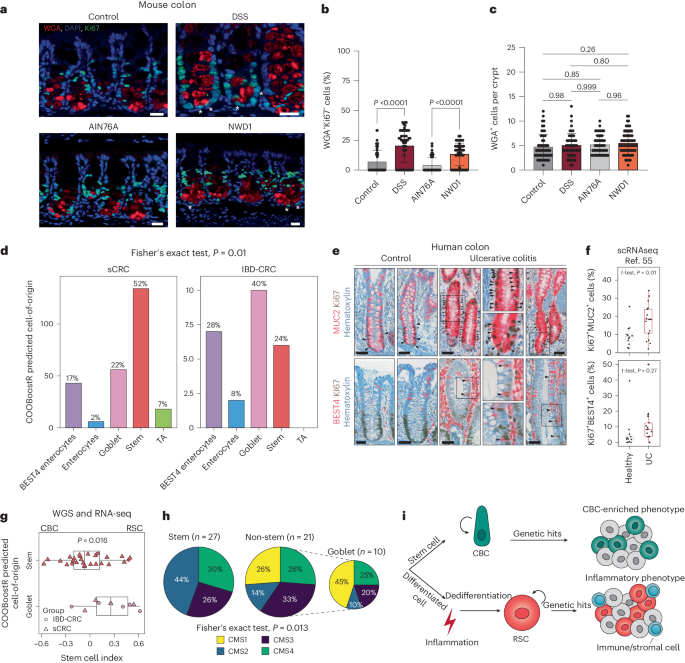
a, Colonic tissues from either untreated mice or mice administered 3% DSS for 7 days, as well as from mice fed AIN-76A or NWD1 synthetic diets for 3 months were analyzed for the presence of proliferative DCS cells. WGA was used to stain DCS cells50, and Ki67 to mark proliferative cells. Tissues were counterstained by DAPI (nucleus). Asterisks mark WGA/Ki67 double-positive cells. b,c, Quantification of WGA+Ki67+cells (b) and total WGA+ cells (c) in the lower colonic crypt of the mice, as shown in a. Scale bar, 20 μm. A minimum of 50 crypts from three different mice were analyzed. Data are presented as mean and s.d. P values denote two-tailed Tukey’s tests for group comparisons. d, Bar plot showing the predicted cell-of-origin in IBD-CRC (n = 25) and sCRC (n = 257)38 cohorts based on the COOBoostR computational approach53 (Methods). The P value is the result of Fisher’s exact test. e, MUC2, BEST4 and Ki67 IHC analysis of colonic tissues obtained from controls and patients with IBD. Asterisks indicate double-positive cells. Scale bars, 50 µm. f, Box plot showing percentage of cycling (Ki67+) MUC2+ and REG4+ cells in patients with ulcerative colitis (UC) and controls. scRNA-seq data are from ref. 55. Positivity was defined per cell by the presence of at least one read for that particular marker. Subsequently, cells were aggregated per patient to calculate percentages. n = 12 healthy participants and n = 17 patients with ulcerative colitis. Box plots show the median, and lower and upper hinges correspond to the first and third quartiles. Whiskers extend from the hinges to maximum and minimum values, no further than 1.5× interquartile range. The P value shows the result of a two-sided t-test. g, Box plot denoting differences in the stem cell index based on stratification of predicted cell-of-origin in a subset of IBD-CRC and sCRC cases for which RNA-seq data were available (n = 27 stem, n = 10 goblet)38. The P value shows the result of a two-sided t-test. Box plots display the median, and lower and upper hinges corresponding to the first and third quartiles. Whiskers extend from the hinges to maximum and minimum values, no further than 1.5× interquartile range. h, Mapping of CMS on tumor samples stratified according to their predicted cell-of-origin. The P value shows the result of Fisher’s exact test. i, Graphic abstract of the model arising from this study. Colon cancer can be initiated either from stem (ISC) or differentiated cells, the latter in response to inflammatory cues. RSC reprogramming is activated in support of the regenerative response. During this process, actively dividing RSCs expand the cell targets for tumor initiation and progression, leading to an alternative route to tumorigenesis earmarked by an inflammatory phenotype.
Secretory lineages as the cell-of-origin of human colon cancer
Collectively, our results reveal an alternative bottom-up route to intestinal tumorigenesis originating from PCs in the mouse small intestine and, allegedly, from secretory lineages in the human colon, triggered by inflammatory cues, as in IBD, or through western-style dietary factors. To validate the relevance of our mouse study in patient-derived colon cancer, we took advantage of new computational methods51,52,53 developed to predict the cell-of-origin of tumors by matching the mutational density along the cancer genome with the profiles of epigenetic modifications characteristic of normal cell types54 (Extended Data Fig. 10a). Although tumors from patients with a history of IBD have a similar genome-wide tumor mutational burden compared with their sporadic counterparts (Extended Data Fig. 10b), the presence of regions (genomic windows, Methods) that are differentially mutated between sCRC and IBD-CRC is suggestive of alternative mutational patterns (Extended Data Fig. 10c,d). Hence, we compared the individual mutational landscapes with the epithelial cell types of the colon to compute the putative cells-of-origin.
As shown in the Fig. 5a (COOBoostR53, Methods), although the majority of the sporadic colon cancers appear to originate from stem cells (52%), among the IBD-related cases, goblet (40%) and BEST4 (28%) cells represent the prevalent cells-of-origin. Strikingly, a substantial proportion (>40%) of sporadic cases are also predicted to originate from non-stem lineages, namely goblet (22%), enterocytes (2%) and BEST4 cells (17%). The latter, named after the specific expression of the bestrophin 4 gene (BEST4), form a newly identified and as yet only partially characterized intestinal epithelial lineage with dual absorptive and secretory features55,56,57. IHC and scRNA-seq analysis in a cohort of patients with ulcerative colitis confirmed the presence of actively proliferating goblet and BEST4 cells (MUC2+ and BEST4+) (Fig. 5e,f), indicative of the primary effects of inflammation in these otherwise postmitotic cells, likely to precede their acquisition of stem-like features.
These results are indicative of the fraction of sporadic colon cancers whose expression profiles are reminiscent of the PC-derived tumors and IBD-CRCs (24.7%; Fig. 3j). Furthermore, the availability of RNA-seq data from a subset of the patient-derived tumors allowed us to confirm the prevalence of RSC-like expression profiles and the high proportion of CMS1 and CMS4 among the sporadic and IBD cases predicted to originate from non-stem, and in particular goblet, cells (Fig. 5g,h and Extended Data Fig. 10e).
- SEO Powered Content & PR Distribution. Get Amplified Today.
- PlatoData.Network Vertical Generative Ai. Empower Yourself. Access Here.
- PlatoAiStream. Web3 Intelligence. Knowledge Amplified. Access Here.
- PlatoESG. Carbon, CleanTech, Energy, Environment, Solar, Waste Management. Access Here.
- PlatoHealth. Biotech and Clinical Trials Intelligence. Access Here.
- Source: https://www.nature.com/articles/s41588-024-01801-y