NLRC3 is highly expressed during vertebrate HSPC development in vivo and in vitro
Previous studies in vertebrate embryos uncovered the role of inflammatory signaling in HSPC emergence. To explore the potential pathways involved in hematopoietic ontogeny and differentiation in this stage, we screened the dynamic expression of NLR family genes and other genes related to inflammation in the published scRNA-seq data in vertebrates’ embryos during HSPC development. In a data profiling caudal hematopoietic tissue (CHT) of zebrafish at 3.5 and 4.5 days postfertilization (dpf)27, Compared to many other NLR family paralogs, including nlrp1, nlrp3, nlrc3l, nlrc5, nlrc6, nlrx1 and nlrp16, the expression of nlrc3 is relatively higher in the ECs and HSPCs subpopulations (Fig. 1a). To further investigate the expression of nlrc3 in mammalian models, we analyzed published single-cell transcriptomic data profiling mouse embryo from 9.5 days post coitus (dpc) to 11.5 dpc28. Comparison of Aorta Gonad Mesonephros (AGM)–derived HSPCs and fetal liver (FL)-derived HSPCs with venous endothelial cells (VECs), arterial endothelial cells (AECs), pre-hemogenic endothelial cells (pre-HECs) and hemogenic endothelial cells (HECs), the expression of Nlrc3 increases with hematopoietic maturation, especially when comparing HECs with HSPCs, which is the stage that hemogenic endothelial to hematopoietic transition (EHT) occurs (Fig. 1b). And the expression of Nlrc3 is not only highly expressed among the NLR family genes but also like that of Tlr4, which has been reported to be involved in the regulation of HSPC development1. Furthermore, in the latest single-cell transcriptome map of human hematopoietic tissues from the first trimester29, the expression trend of NLRC3 was also validated to be enriched in venous endothelium (VE), arterial endothelium (AE), hemogenic endothelium (HE), HSCs and HPCs which are defined as Non-HSCs (Fig. 1c), especially the differentiation stage from HE to HSCs.
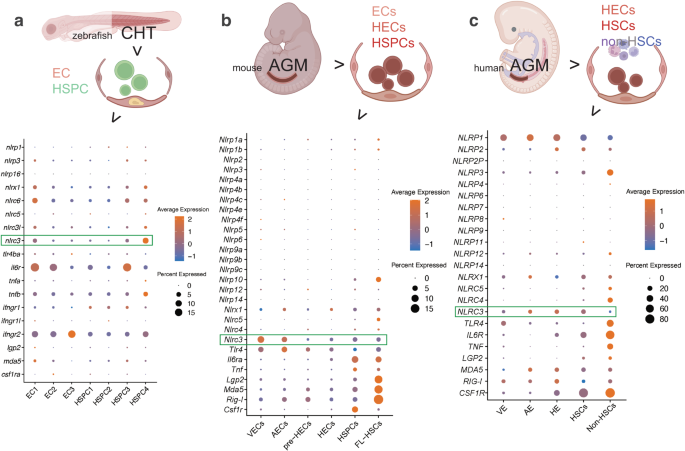
a Schematic paradigm of zebrafish caudal hematopoietic tissue (CHT) tissue for single-cell RNA-seq (scRNA-seq) profiling. Bubble plot of scRNA-Seq data demonstrating the expression of nucleotide-binding domain leucine-rich repeat (NLR) family members, including Nlrc3 and related inflammatory genes in the clusters of endothelial cells (ECs) and Hematopoietic stem and progenitor cells (HSPCs). b Schematic paradigm of mouse embryonic Aorta Gonad Mesonephros (AGM) for scRNA-seq profiling. Bubble plot of scRNA-Seq data demonstrating the expression of NLR family members, including Nlrc3 and related inflammatory genes in the clusters of venous endothelial cells (VECs), arterial endothelial cells (AECs), pre-hemogenic endothelial cells (pre-HECs), hemogenic endothelial cells (HECs), HSPCs, fetal liver (FL)-derived HSPCs. c Schematic paradigm of human embryonic AGM for scRNA-seq profiling. Bubble plot of scRNA-Seq data demonstrating the expression of NLR family members, including NLRC3 and inflammatory genes in the clusters of venous endothelium (VE), arterial endothelium (AE), hemogenic endothelium (HE), HSPCs and Non-HSCs. Illustrations created with BioRender.com. Source data are provided as a Source Data file.
Although rather in the primitive stage, the hematopoietic differentiation system using embryonic stem cells (ESCs) is a convenient research model that simulates and observes the in vivo embryonic hematopoiesis, in which cells gradually differentiate into the mesoderm, HE, and HSPCs stages, and are accompanied by specific different molecular markers at different stages31,32. To further verify the expression of Nlrc3 in vitro, we compared FL- and bone marrow (BM)-derived HSPCs with HSC-like cells derived from mouse ESCs (Supplementary Fig. 1a)30. Differential gene expression analysis using RNA-seq revealed that among the NLR family genes, Nlrc3 expression was highly enriched with the expression of genes that have been reported to regulate the emergence of HSCs, including Tlr41 and IFN-γ16 (Supplementary Fig. 1b).
We further validated our results by employing the in vitro HSC-like cell differentiation system using human embryonic stem cells (hESCs) (Supplementary Fig. 1c). We examined the dynamic change of NLRC3 during the 12-day hematopoietic differentiation process by qPCR and found that compared with day 0, the expression of NLRC3 gradually increased along with the hematopoietic differentiation from hESCs (Supplementary Fig. 1d). Moreover, we isolated cells from different stages (hESCs at Day 0, CD309+ mesoderm cells at Day 3, CD31+CD34+ HE cells at Day 6, CD43+ HSPCs cells at Day 9, and CD45+ HSPCs at Day 12). Our qPCR results showed that, compared with undifferentiated hESCs, the expression of NLRC3 in HE was significantly increased by approximately 300-fold and was even higher in CD43+ and CD45+ HSPCs (Supplementary Fig. 1e). TLR4 and NLPR3, which have been reported to be regulators of HSPCs emergence and differentiation, showed a similar trend to NLRC3 (Supplementary Fig. 1f, g). Overall, these results suggest that NLRC3 was highly expressed during embryonic HSPC development in vivo and vitro and might play an important role in HSPC emergence in vertebrates.
Nlrc3 signaling is indispensable for HSPC production in zebrafish
To investigate whether nlrc3 signaling is required for in vivo HSPC emergence, we synthesized probes from the full-length mRNA of nlrc3 and utilized them to observe the in-situ expression of nlrc3 in zebrafish at different developmental stages. The WISH experiment demonstrated that nlrc3 was expressed from the 1-cell stage and, importantly, showed specific expression in the AGM region of zebrafish at 24–28hpf, which coincides with the onset of HSPC generation. There was also a high expression of nlrc3 at 72hpf in the CHT region, which follows a similar spatiotemporal expression pattern as HSPC generation, indicating that nlrc3 may be involved in the development of HSPCs (Supplementary Fig. 2a). By co-staining with arterial endothelial-specific markers dlc and efnb2 (Supplementary Fig. 2b, c), hematopoietic stem/progenitor cell-specific markers runx1 and cmyb (Supplementary Fig. 2d, e), we found that co-staining nlrc3 with these probes can effectively enhance the expression of HE and HSPCs. These results suggest that nlrc3 may be involved in the regulation of this process in zebrafish.
In order to validate this hypothesis, loss-of-function experiments were performed using zebrafish with a targeted Morpholino (MO) (Supplementary Fig. 3a). We observed the floor of the DA region in Tg (runx1:EGFP/ kdrl:mCherry) double-transgenic embryos at 28 hpf by confocal microscopy, runx1 is a conserved HSPC marker and kdrl is a vascular endothelial-specific marker, the runx1+kdrl+ cells signifies HSPCs occurs through the hemogenic endothelial (HE) to hematopoietic transition (EHT) process is this time point, and the number of runx1+kdrl+ HSPCs of morphants was significantly lower than that in control embryos (Fig. 2a, b). By using the Tg(cmyb:EGFP/kdrl:mCherry) double-transgenic line at 48 hpf, cmyb is another conserved HSPC marker, we found that the number of cmyb+kdrl+ HSPCs of morphants within the ventral wall of the dorsal aorta (VDA) markedly decreased in nlrc3 morphants (Fig. 2c, d). Tg (CD41: GFP), which is a well-established transgenic line with HSPC expansion in the CHT, also had reduced expression in morphants at 72 hpf (Fig. 2e, f). Furthermore, we performed whole-mount in situ hybridization (WISH) to measure the expression of runx1 and cmyb, which are nascent HSPC markers at early developmental stages, and found that the expression of runx1 and cmyb was significantly reduced at 28 hpf and at 36 hpf, respectively, in the aortic floor of nlrc3 morphants compared with their wild-type siblings (Fig. 2g, j). To further demonstrate the role of nlrc3 in HSPC emergence, we generated nlrc3 mutant by the CRISPR/Cas9, 29 bp base is knocked out in homozygotes (Supplementary Fig. 2b, c). The expression of nlrc3 was abrogated in mutants at the site of HSPC occurrence at 24–36 hpf (Supplementary Fig. 3d, e). Consistent with previous results, the expression of runx1 and cmyb was decreased in mutants by WISH at 28 hpf and 36 hpf, respectively (Fig. 2g–j). With this mutant, we also validated the downregulation of hematopoietic markers and nlrc3 at 28 hpf by qPCR (Fig. 2k). The similar phenotype between morphants and mutants allows for the experimental design to be tailored based on specific needs. To obtain more comprehensive evidence, we examined gata2b, a critical early hematopoietic marker12. Through qPCR, we found a downregulation of gata2b in the mutant at 28 hpf. Therefore, we synthesized the full-length mRNA of gata2b and overexpressed it. The reduction in runx1 at 28hpf and cmyb at 36 hpf due to nlrc3 deficiency was partially restored by the rescue of gata2b (Supplementary Fig. 3f, g). This result was also confirmed by qPCR analysis (Supplementary Fig. 3h). These results indicated that nlrc3 was required for HSPC emergence and expansion.
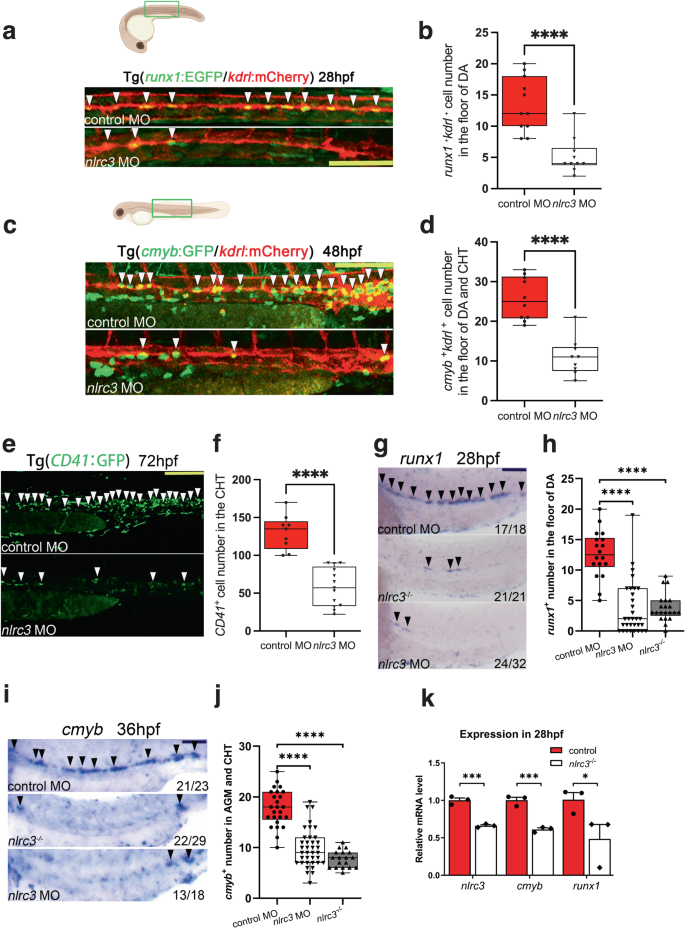
a, b Confocal imaging showing the number of hemogenic endothelium and emerging HSPCs in runx1+kdrl+ cells from Tg (runx1:EGFP/kdrl:mCherry) embryos at 28 hpf in the AGM (white arrowheads) in control embryos and nlrc3 morphants with quantification (b). ****P < 0.0001, n = 11, 10 embryos. c, d Confocal imaging showing the number of cmyb+kdrl+ cells in Tg (cmyb:EGFP/kdrl:mCherry) embryos at 48 hpf in the AGM (white arrowheads) in control embryos and nlrc3 morphants with quantification (d). ****P < 0.0001, n = 10, 9 embryos. e, f Confocal imaging showing the number of HSPCs in Tg (CD41:GFP) embryos at 72 hpf in the CHT (white arrowheads) in control embryos and nlrc3 morphants with quantification (f). ****P < 0.0001, n = 9, 13 embryos. g, h Expression of the HSPC marker runx1 in nlrc3 morphants and mutants in the AGM region at 28 hpf by whole mount in situ hybridization (WISH) (black arrowheads) with quantification (h) ****P < 0.0001, n = 18, 32, 21 embryos. i, j Expression of the HSPC marker cmyb in nlrc3 morphants and mutants in the region of AGM and CHT at 36 hpf by WISH (black arrowheads) with quantification (j) ****P < 0.0001, n = 25, 37, 18 embryos. k Expression of nlrc3 and the HSPC genes runx1, cmyb in control embryos and nlrc3 morphants at 28 hpf by qPCR. *P = 0.0462, ***P = 0.0006, 0.0010, n = 3 biological replicates. Error bars, mean ± s.d., ****P < 0.0001, by using two-tailed, unpaired Student’s t-test in (b, d, f, k), one-way ANOVA – Sidak test in (h, j). For the box plots in (b, d, f, h, j), box limits extend from the 25th to 75th percentile, while the middle line represents the median. Whiskers extend to the largest value no further than 1.5 times the inter-quartile range (IQR) from each box hinge. Scale bars, 100 μm in (a, c, e, g, i). Illustrations created with BioRender.com. Source data are provided as a Source Data file.
To further evaluate the effect of nlrc3 on hematopoietic differentiation, we examined the expression of rag1, which specifically indicates the differentiation capability of HSPCs for T cell lineages. WISH results showed that rag1 expression was markedly reduced in both morphants and mutants (Fig. 3a). A similar phenotype was observed in Tg (lck:EGFP) transgenic morphants at 120 hpf (Fig. 3b), while lymphoid genes, including ikaros, rag1, lck, and il7r, were downregulated in mutants, as assessed by qPCR (Fig. 3c). However, the expression of the thymic epithelial cell marker foxn1 was normal (Fig. 3a), suggesting that T-cell defects in these deficient embryos resulted from early HSPC defects. The expression of gata1a, an erythrocyte-specific marker, was decreased in the posterior blood island (PBI) and trunk regions of morphants at 36 hpf and 96 hpf, respectively (Supplementary Fig. 4a, Fig. 3d), which was further verified by qPCR analysis in mutants (Fig. 3e). We also examined the phenotypes of Tg (lcr:EGFP) and Tg (gata1a:DsRed) transgenic morphants at 60 hpf (Supplementary Fig. 4b, c). These two transgenic lines are capable of tracking erythrocytes in blood vessels, and the results strongly suggest that nlrc3 signaling is essential for definitive erythropoiesis. Myeloid lineage differentiation was also impaired in mutants, as assayed by mpx at 96 hpf and l-plastin at 120 hpf by WISH (Fig. 3f, Supplementary Fig. 4f). Similar phenotypes were assessed in Tg (mpx:EGFP) and Tg (lyz:DsRed) transgenic morphants as the neutrophil marker at 60 hpf and 72 hpf, respectively, in the CHT region (Supplementary Fig. 4d, e), and the expression of myeloid-lineage genes in mutants at 96 hpf was found to be decreased by qPCR (Fig. 3g). These results indicated that HSPC differentiation was impaired when nlrc3 signaling was disturbed.
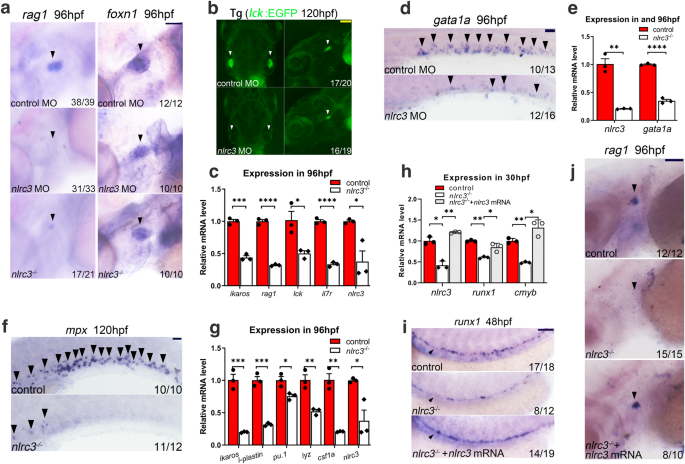
a Expression of the lymphoid marker rag1 in nlrc3 morphants and mutants and the thymic epithelial cell marker foxn1 in the thymus of control embryos, nlrc3 morphants, and mutants at 96 hpf (black arrowheads). b Snapshot of lck+ cells in Tg (lck:EGFP) embryos in the thymus of control embryos and nlrc3 morphants at 5 dpf (white arrowheads). c Expression of nlrc3 and the lymphoid genes ikaros, rag1, lck, and il7r in control embryos and nlrc3 morphants at 96 hpf by qPCR. *P = 0.0229, 0.0197, ***P = 0.0009. d Expression of the erythroid marker gata1a in control embryos and nlrc3 morphants by WISH at 96 hpf (black arrowheads). e Expression of nlrc3 and the erythroid gene gata1a in control embryos and nlrc3 morphants at 96 hpf by qPCR. **P = 0.0011. f Expression of the myeloid marker mpx in control and nlrc3 morphants by WISH at 120 hpf (black arrowheads). g Expression of nlrc3 and the myeloid gene ikaros, l-plastin, pu.1, lyz, and csf1a in control embryos and nlrc3 mutants at 96 hpf by qPCR. *P = 0.0178, 0.0197, **P = 0.0049, 0.0011, ***P = 0.0007, 0.0003. h Expression of nlrc3 and the HSPC genes runx1 and cmyb in control, nlrc3 morphants, and nlrc3 morphants with overexpression of nlrc3 mRNA at 30 hpf by qPCR. *P = 0.0286, 0.0272, 0.0158, **P = 0.0040, 0.0047, 0.0068. i Expression of the HSPC marker runx1 in control embryos, nlrc3 morphants, and nlrc3 morphants with overexpression of nlrc3 mRNA at 48 hpf by WISH (black arrowheads). j Expression of the lymphoid marker rag1 in control embryos, nlrc3 morphants, and nlrc3 morphants with overexpression of nlrc3 mRNA at 96 hpf by WISH (black arrowheads). Error bars, mean ± s.d., *P < 0.05, **P < 0.01, ***P < 0.001, ****P < 0.0001, the exact p-values mentioned above are listed from left to right, by using two-tailed, unpaired Student’s t-test in (c, e, g). Two-way ANOVA with Tukey’s post hoc test in (h). n = 3 biological replicates. Scale bars, 100 μm in (a, b, d, f, i, j). Illustrations created with BioRender.com. Source data are provided as a Source Data file.
To determine if nlrc3 was sufficient for embryonic hematopoiesis, we synthesized nlrc3 mRNA for rescue experiments. The decreased expression of runx1 at 48 hpf and rag1 at 96 hpf could be rescued by overexpression of nlrc3 mRNA, as assessed by WISH, and qPCR also validated this trend at 30 hpf (Fig. 3h–j). These results demonstrated that HSPC defects in nlrc3-deficient embryos were specific.
To further examine the role of nlrc3 in the first wave of hematopoiesis, which is generally called the “primitive” wave, we performed WISH to measure the expression of gata1a at 26 hpf (Supplementary Fig. 5a). qPCR of gata1a at 30 hpf verified this phenotype, confirming that nlrc3 signaling may not impact primitive erythropoiesis (Supplementary Fig. 5b). However, the expression of mpx was decreased at 24 hpf, as measured using WISH (Supplementary Fig. 5c), indicating that the development of primitive neutrophils depended on nlrc3 signaling. Additionally, the expression of mfap4, a specific marker of macrophages, was reduced in nlrc3-deficient embryos at 25 hpf (Supplementary Fig. 5d). Compared to the control group, Tg (mpeg:GFP), a transgenic line of macrophages, also showed a reduction after nlrc3 knockdown at 30 hpf (Supplementary Fig. 5e). These results reflected the role of nlrc3 signaling in primitive hematopoiesis.
Since HSPCs originate from hemogenic endothelial cells in the dorsal aorta33, mutants or defects in blood vessel or artery genes may lead to hematopoietic defects. To explore this possibility, we examined the vascular endothelial-specific marker kdrl and the arterial-specific markers dlc at 26 hpf by WISH and found no notable vascular abnormalities in nlrc3 morphants or mutants (Supplementary Fig. 6a, b). The same trend was observed in Tg (kdrl:mCherry) at 28 hpf by confocal microscopy, and no alterations were observed between the different groups (Supplementary Fig. 6d). Furthermore, the expressions of the endothelial and arterial markers dll4, ephrinB2, kdrl, and deltaC was not altered relative to the control group, as detected by qPCR (Supplementary Fig. 6c).
To further investigate whether the decrease in HSPCs in nlrc3 morphants was due to enhanced apoptosis in endothelial cells, we performed TUNEL in Tg (fli1a:EGFP) embryos, which labels endothelial cells and were analyzed by confocal microscopy at 28hpf, the results indicated that loss of nlrc3 caused no increase in apoptotic endothelial cells within the DA (Supplementary Fig. 6e), indicating that the defects in HSPCs in nlrc3-deficient embryos were not caused by apoptosis in endothelial cells. Taken together, these data imply that nlrc3 plays an imperative role in the definitive hematopoiesis of the zebrafish embryos. For the primitive wave, nlrc3 signaling was indispensable for the creation of neutrophils and macrophages. And this effect is not based on affecting the development of arterial vessels or causing apoptosis. As no previous studies have reported the involvement of nlrc3 in HSPC generation, we will investigate its underlying mechanism.
Nlrc3 regulates HSPC emergence via activation of Notch signaling
To determine the regulatory mechanism by which nlrc3 signaling regulates HSPCs, we sorted EGFP+ cells in Tg (fli1a: EGFP) zebrafish embryos at 28 hpf, which was the stage where EHT occurs in the VDA, and these EGFP+ cells contained hemogenic endothelial cells (Fig. 4a). Moreover, principal component analysis (PCA) indicated the high quality of our transcriptome profile data (Fig. 4b).
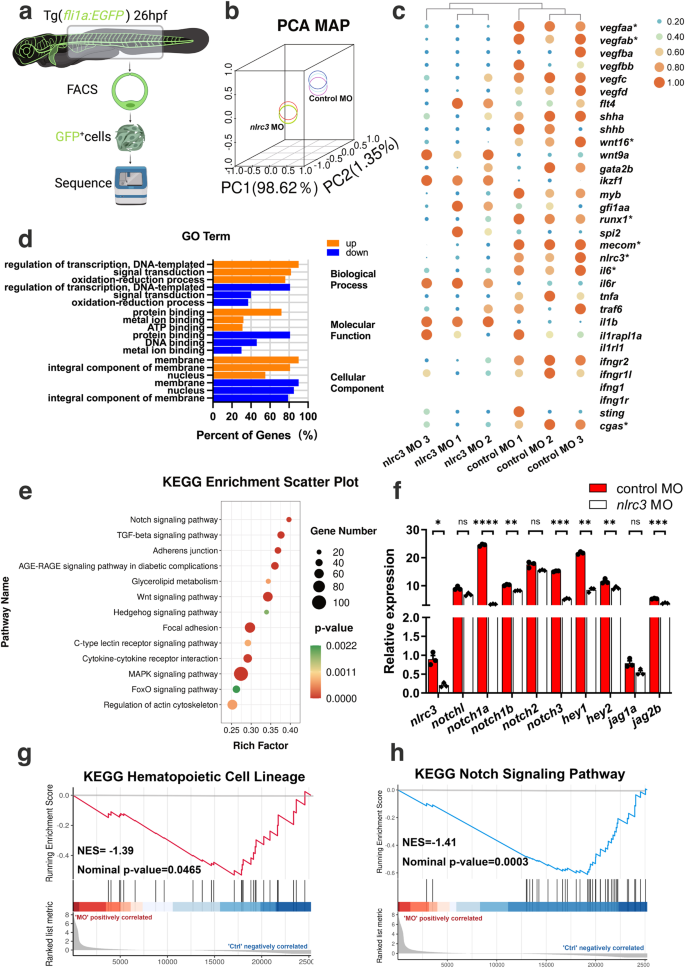
a Schematic representation of RNA-seq analysis in this study. b Principal-component analysis (PCA) of six sequenced samples shown by the first three principal components (PC1–PC2). Control MO 1, blue; Control MO 2, light blue; Control MO 3, violet; nlrc3 MO 1, yellow; nlrc3 MO 2, green; nlrc3 MO 3, red; c Heatmap showing differential expression of hematologic-associated genes. The mark * indicates that there is a significant difference between the control group and morphant group with fold change >2 or fold change <0.5 and p-value < 0.05. (4) FDR < 0.05. d Representative statistically enriched biological process (BP), molecular function (MF) and cellular component (CC) associated genes of the upregulated and downregulated genes in nlrc3 morphant group compared with the control group. e Representative KEGG enrichment scatter plots of the signaling pathways in the nlrc3 morphant group compared with the control group. The plots were drawn based on the R version 4.1.3 and ggplot version 3.3.3. The statistical tests were one-sided and adjustments were made for multiple comparisons. f Expression of Notch genes in control embryos and nlrc3 morphants at 26 hpf by RNA-seq. Error bars, mean ± s.d., ns = 0.0554, 0.0645, 0.1207, *P = 0.0224, **P = 0.0065, 0.0029, 0.0066, ***P = 0.0006, 0.0004, ****P < 0.0001, the exact p-values mentioned above are listed from left to right, by using two-tailed, unpaired Student’s t-test. n = 3 biological replicates. g Enrichment plot of the hematopoietic cell lineages between differentially regulated genes in the nlrc3 morphant group compared with the control group by GSEA (Gene Set Enrichment Analysis). P = 0.0465. h Enrichment plot of the Notch signaling pathway between differentially regulated genes in the nlrc3 morphant group compared with the control group by GSEA. P = 0.0003. GSEA of nlrc3 morphant versus control group transcriptional profiles using software GSEA (v4.1.0) and MSigDB, the statistical tests were one-sided and adjustments were made for multiple comparisons. Black bars indicate the individual genes, enrichment is in green. Normalized enrichment score = NES in (g, h). Source data are provided as a Source Data file.
Based on the results of our RNA-Seq assays, a heatmap of differentially expressed genes (DEGs) showed hematologic-associated gene changes in the pathways related to nlrc3 in the morphant group (Fig. 4c). As well as functional enrichment of common DEGs was performed, and GO analysis demonstrated changes in the categories of molecular function (MF), cellular component (CC) and biological process (BP) after knockdown nlrc3 (Fig. 4d). To predict specific downstream pathways, KEGG pathway enrichment analysis was performed, and this analysis revealed that the upregulated DEGs were mainly involved in endocytosis and the MAPK signaling pathway, while the downregulated DEGs were mainly involved in multiple signaling pathways including TGF-β signaling, adherens junction, Wnt signaling, and Hedgehog signaling34,35. Among these pathways, Notch signaling was the most enriched in nlrc3 morphant (Fig. 4e). Notch family genes were downregulated to varying degrees compared with the control groups, the nlrc3 knockdown groups showed different degrees of downregulation of notch-related genes, especially notch1a and hey1 specifically (Fig. 4f). This trend was consistent with that of hematopoietic-related genes in Gene set enrichment analysis (GSEA) profiles (Fig. 4g, h). These results strongly suggested that Notch signaling might be involved in nlrc3-mediated regulation of HSPC emergence.
To further explore this hypothesis, confocal microscopy images of the double-transgenic line Tg (tp1: EGFP/kdrl:mCherry), which represented active Notch signaling, showed a reduced number of tp1+kdrl+ cells in the aortic floor at 30 hpf in nlrc3-deficient embryos, and this phenotype was rescued by nlrc3 mRNA overexpression (Fig. 5a, b). Similar trends were observed in transgenic Tg (tp1:EGFP) embryos at 48 hpf (Supplementary Fig. 7a)36. Flow cytometry showed that the number of tp1+ cells was decreased when nlrc3 was inhibited, and this was restored by nlrc3 mRNA overexpression (Supplementary Fig. 7b, c). Furthermore, in the RNA sequencing data, wnt16 showed a significant downregulation, which is considered a major regulator of Notch37,38. To further investigate the mechanism of nlrc3 regulation of Notch, we synthesized the mRNA of wnt16 for overexpression experiments. The results of WISH showed that the decreased expression of runx1 at 28hpf due to the loss of nlrc3 could be partially rescued by overexpression of wnt16 (Supplementary Fig. 8a, b). The qPCR results also confirmed this phenotype (Supplementary Fig. 8c). On the other hand, as significant regulators of the Notch signaling pathway and hematopoiesis during this specific developmental stage, we have identified genes in the RNA sequencing data that exhibit notable differences, including vegf and evi135,39,40. In order to further explore the regulatory mechanisms of nlrc3, we synthesized their mRNA and performed overexpression experiments on nlrc3 mutants. However, the qPCR results indicate that the overexpression of vegfaa, vegfab, and evi1 cannot effectively rescue the downregulation of runx1 and cmyb caused by nlrc3 knockout (Supplementary Fig. 9a–c). The results above demonstrate that within the hematopoietic regulatory network governed by nlrc3, many genes are perturbed, but it is the Notch signaling that serves as the downstream regulatory role of nlrc3.
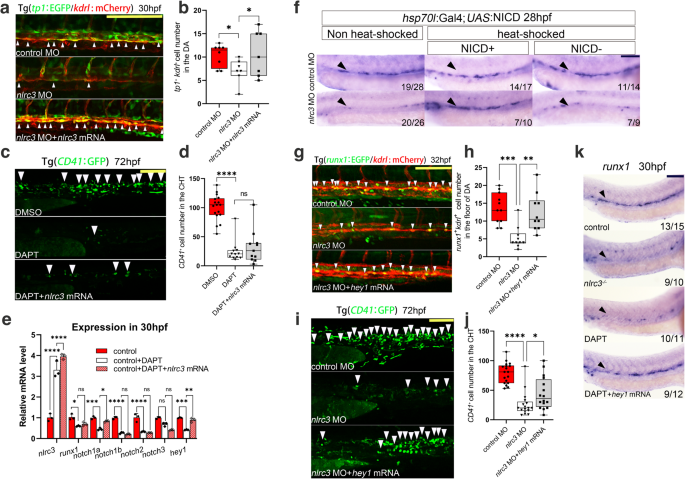
a, b Confocal imaging showing Tg (tp1:EGFP; kdrl:mCherry) embryos at 30 hpf in the floor of the DA (white arrowheads) in control embryos, nlrc3 morphants, and nlrc3 morphants with overexpression of nlrc3 mRNA with quantification (b). *P = 0.0394, 0.0221, n = 8, 7, 7 embryos. c, d Confocal imaging showing the number of CD41+ cells at 72 hpf in the CHT (white arrowheads) of Tg (CD41:GFP) embryos in the control embryos, treatment group with Notch inhibitor DAPT, and treatment group with Notch inhibitor DAPT with overexpression of nlrc3 mRNA with quantification (d). ns = 0.6905, ****P < 0.0001, n = 17, 12, 11 embryos. e Expression of nlrc3, runx1, and NOTCH family genes in the control embryos, treatment group with the Notch inhibitor DAPT, and treatment group with the Notch inhibitor DAPT with overexpression of nlrc3 mRNA at 30 hpf by qPCR. ns > 0.9999, = 0.2217, 0.4466, *P = 0.0149, 0.0498, **P = 0.0047, 0.0049, ***P = 0.0004, 0.0002, ****P < 0.0001. f hsp70:Gal4; UAS:NICD-myc embryos injected with control MO and nlrc3 MO, WISH for runx1 was performed at 28 hpf. g, h Confocal imaging showing the number of runx1+kdrl+ cells in Tg (runx1:EGFP/kdrl:mCherry) embryos at 32 hpf in the AGM (white arrowheads) in control embryos, nlrc3 morphants, and nlrc3 morphants with overexpression of hey1 mRNA with quantification (h). **P = 0.0021, ***P = 0.0003, n = 11, 10, 10 embryos. i, j Confocal imaging showing the number of hematopoietic cells in Tg (CD41:GFP) embryos at 72 hpf in the CHT (white arrowheads) in control embryos, nlrc3 morphants, and nlrc3 morphants with overexpression of hey1 mRNA with quantification (j). *P = 0.0380, ****P < 0.0001, n = 18, 17, 16 embryos. k Expression of the HSPC marker runx1 in control embryos, nlrc3 mutants, treatment group with Notch inhibitor DAPT and treatment group with Notch inhibitor DAPT with overexpression of hey1 mRNA at 30 hpf by WISH. Error bars, mean ± s.d., *P < 0.05, **P < 0.01, ***P < 0.001, ****P < 0.0001, the exact p-values mentioned above are listed from left to right, by using one-way ANOVA with –Sidak test in (b, d, h, j), two-way ANOVA with Tukey’s post hoc test in (e), n = 3 biological replicates in (e). For the box plots in (b, d, h, j), box limits extend from the 25th to 75th percentile, while the middle line represents the median. Whiskers extend to the largest value no further than 1.5 times the IQR from each box hinge. Scale bars, 100 μm in (a, c, f, g, i, k). Source data are provided as a Source Data file.
To provide additional evidence from another perspective, we used the notch-specific inhibitor DAPT (N-[N-(3,5-difluorophenacetyl)-lalanyl]-S-phenylglycine t-butyl ester) to block the Notch signaling pathway to explore the relationship between nlrc3 and Notch signaling pathway. The WISH results showed that DAPT-treated embryos had decreased frequency of HSPC marker runx1, but the overexpression of nlrc3 could not rescue these effects (Supplementary Fig. 8d). Similarly, overexpression of nlrc3 could not rescue the levels of DAPT-treated CD41+ cells at 72 hpf (Fig. 5c, d). Intriguingly, qPCR results showed that Notch family genes were decreased after DAPT treatment, but overexpression of nlrc3 mRNA barely rescued this drop, except for notch1a and hey1 at 30 hpf (Fig. 5e), further indicating that nlrc3 acts in the upstream of Notch signaling. To test our hypothesis by rescue Notch, the double transgenic line Tg (hsp70: GAL4/UAS: NICD), which contains the Notch intracellular domain (NICD), which can be triggered and enter the nucleus to play key biological roles during Notch activation, was used to ectopically activate Notch signaling by heat-shock induction after MO injection. In contrast to that of morphants, the overexpression of NICD effectively rescued the expression of runx1+, as shown by WISH (Fig. 5f). Furthermore, induction of NICD rescued the depletion of cmyb at 36 hpf and 48 hpf in nlrc3 morphants (Supplementary Fig. 7d). Altogether, these data supported the hypothesis that nlrc3 activated the Notch signaling during hematopoiesis in zebrafish.
Hey1 acts downstream of nlrc3-Notch signaling in HSPC emergence
To explore the mechanism by which nlrc3 induces Notch activation, qPCR was performed to analyze the expression of Notch ligands and target genes in nlrc3-deficient embryos. Consistent with previous results and our RNA-seq analysis, the expression of notch1a decreased significantly and this decreasing trend could be rescued by overexpression of nlrc3 (Supplementary Fig. 8e). Moreover, the expression of hey1 was significantly downregulated compared with other target genes (Supplementary Fig. 8f, Fig. 4f), suggesting that nlrc3 plays a regulatory role through notch1a and hey1.
To prove whether hey1 was downstream of nlrc3 signaling, we synthesized hey1 mRNA for rescue experiments. To explore the effects of hey1 on the emergence and expansion stages of HSPCs, we used nlrc3 MOs with hey1 overexpression to determine the numbers of HSPCs at different time points, and we found that hey1 could rescue the decreased numbers of runx1+kdrl+ positive HSPCs at 32 hpf (Fig. 5g, h) and CD41+ HSPCs in CHT at 72 hpf (Fig. 5i, j). To validate the relationship between nlrc3 and hey1 at the mRNA level, we injected hey1 mRNA into nlrc3 mutants to verify its effect on multiple markers by qPCR. The results showed that overexpression of hey1 had no significant impact on the expression of nlrc3 but rescued the expression of HSPC markers (runx1, cmyb) and hey1-related genes edn1 and plxnd1 (Supplementary Fig. 9h). Furthermore, WISH was performed after the morphant embryos were treated with the Notch signaling pathway inhibitor DAPT, and overexpression of hey1 mRNA also rescued the decreased expression of runx1 (Fig. 5k). To examine the ability of HSPC differentiation, we measured the expression of myeloid, erythroid and lymphoid lineages respectively through Sudan Black41, gata1a, and rag1 at 96 hpf and found that hey1 could rescue these lineages under conditions of Notch inhibitor (Supplementary Fig. 9d–f), indicating that the differentiation of HSPCs was repaired by this pathway. In summary, these findings suggest that hey1 was downstream of nlrc3 and that nlrc3-Notch-hey1 axis triggers HSPC emergence and differentiation.
Nlrc3 is downstream of the NF-kB signaling pathway in HSPC emergence
Previous reports have revealed that the TLR4–MyD88–NF-kB signaling pathway is involved in regulating the production of HSPCs1, and correspondingly, nlrc3 was reported to attenuate Toll-like receptor signaling via modifying NF-kB with adults7. Therefore, we continued to explore the connection between NF-kB and nlrc3 during embryonic hematopoiesis.
First, as previously described, RNA-seq analysis showed that the knockdown of nlrc3 did not affect the expression of the NF-kB pathway in GSEA (Supplementary Fig. 9i). Specifically, after the knockdown of nlrc3, NF-kB-related gene interleukin 1 beta (il1b), nfkbie and nfkbiz were upregulated, nfkbiab, nfkb2 and nfkbib were downregulated, nfkbiaa, nfkb1, nfkbil1 and p65 were not statistically difference compared with the control group (Fig. 6a). These results prompted us to examine whether nlrc3 might be regulated by NF-kB. Second, to explore the relationship between nlrc3 and NF-kB, IkBaa, the NF-kB inhibitory protein that normally binds to NF-kB and prevents the translocation of NF-kB to the nucleus, was knocked down by MO to increase the NF-kB activity. As shown by qPCR, expression of runx1 and NF-kB-related gene il1b was not significantly increased after overexpression of NF-kB in nlrc3−/− mutants compared to the control group (Fig. 6b). To verify this phenotype, we performed WISH and found that, compared to that in the control group, runx1 was activated due to knockdown of IkBaa. It was not increased in nlrc3 mutants even with the overexpression of NF-kB (Fig. 6c, d). Besides, JSH-23, a target inhibitor of the nuclear translocation of NF-kB42, was administered to embryos with nlrc3 overexpression, and WISH analysis of runx1 and cmyb was performed at 36 hpf and 48 hpf, respectively. Both inhibitors-treated embryos showed significant reduction of runx1 or cmyb expression in the aortic floor, and nlrc3 mRNA could rescue the phenotypes (Fig. 6e, f, Supplementary Fig. 9g). Similarly, to assess this trend during the expansion of HSPCs, these results were supported by the quantitation of CD41+ HSPCs at 72 hpf (Fig. 6g). Third, to further evaluate whether NF-kB induced nlrc3 activation, qPCR analyses of embryos at 36 hpf showed that il1b, the NF-kB subunit p65, was reduced after JSH-23 treated, but the overexpression of nlrc3 mRNA could not rescue this phenotype. Meanwhile, both expression levels of nlrc3 and hematopoiesis marker were increased following the enforced expression of nlrc3 (Fig. 6i). In summary, these data confirmed that nlrc3 was downstream of NF–kB signaling pathway in transcription and that the NF-kB-nlrc3-Notch-hey1 axis was both necessary and sufficient for HSPC emergence in zebrafish (Supplementary Fig. 9j).
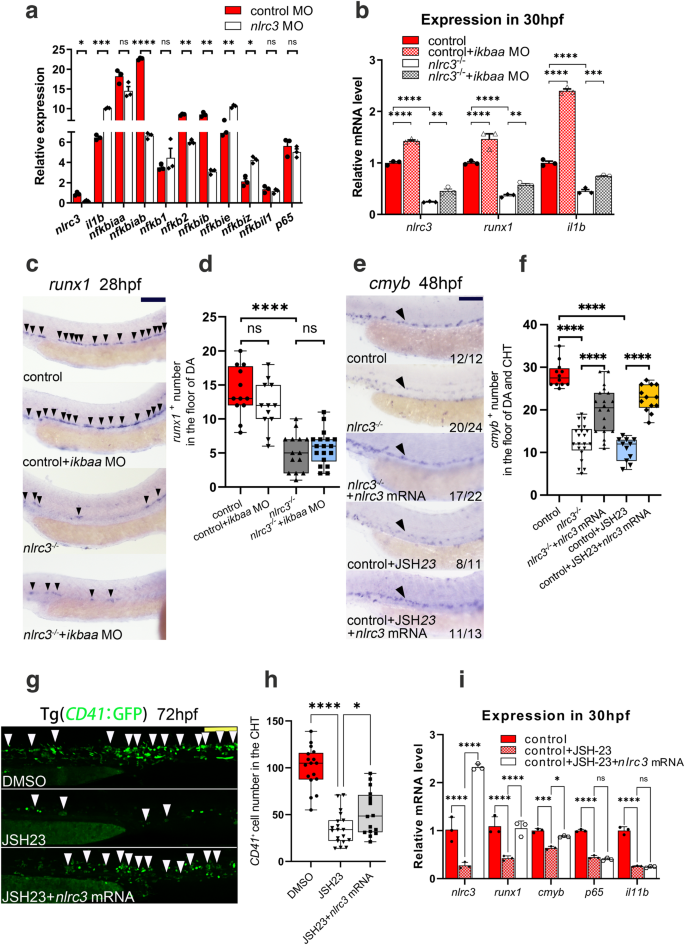
a Expression of NF-kB genes in control embryos and nlrc3 morphants at 26 hpf by RNA-seq. ns = 0.2176, 0.4498, 0.6039,0.1870, *P = 0.0224, 0.0311, **P = 0.0022, 0.0018, 0.0083, ***P = 0.0002, ****P < 0.0001. b Expression of nlrc3, runx1, and the NF-kB target gene il1b in control embryos, nlrc3 mutants, nlrc3 mutants with ikbaa Mo, and treatment group with ikbaa Mo at 30 hpf by qPCR. **P = 0.0041, 0.0053, ***P = 0.0001, ****P < 0.0001. c, d Expression of the HSPC marker runx1 in control embryos, ikbaa morphants, nlrc3 mutants, and nlrc3 mutants with ikbaa morphants at 28 hpf by WISH (black arrowheads) with quantification (d) ns = 0.3163, 0.9187, ****P < 0.0001, n = 12, 12, 14, 18 embryos. e, f Expression of the HSPC marker cmyb in control embryos, nlrc3 mutants, nlrc3 mutants with overexpression of nlrc3 mRNA, treatment group with NF-kB inhibitor JSH-23, and treatment group with NF-kB inhibitor JSH-23 and overexpression of nlrc3 mRNA at 48 hpf by WISH (black arrowheads) with quantification (f) ****P < 0.0001, n = 12, 21, 20, 11, 13 embryos. g, h Confocal imaging showing the number of CD41+ cells at 72 hpf in the CHT (white arrowheads) of Tg (CD41:GFP) embryos in the control embryos, treatment group with NF-kB inhibitor JSH-23, and treatment group with NF-kB inhibitor JSH-23 and overexpression of nlrc3 mRNA with quantification (h). *P = 0.0387, ****P < 0.0001, n = 17, 19, 16 embryos. i Expression of HSPC genes and NF-kB genes in control embryos, treatment group with NF-kB inhibitor JSH-23, and treatment group with NF-kB inhibitor JSH-23 with overexpression of nlrc3 mRNA at 30 hpf by qPCR. ns = 0.8444, 0.9785, *P = 0.0179, ***P = 0.0005, ****P < 0.0001. Error bars, mean ± s.d., *P < 0.05, **P < 0.01, ***P < 0.001, ****P < 0.0001, the exact p-values mentioned above are listed from left to right, by using two-tailed, unpaired Student’s t-test in (a), one-way ANOVA with –Sidak test in (d, f, h), two-way ANOVA with Tukey’s post hoc test in (b, i), n = 3 biological replicates in (a, b, i). For the box plots in (d, f, h), box limits extend from the 25th to 75th percentile, while the middle line represents the median. Whiskers extend to the largest value no further than 1.5 times the IQR from each box hinge. Scale bars, 100 μm in (c, e, g). Source data are provided as a Source Data file.
Nlrc3 signaling is conserved in the regulation of vertebrate hematopoiesis
To further extend our findings in mammals, we utilized Nlrc3 knockout mice to explore whether Nlrc3 signaling was evolutionarily conserved in HSPCs emergence. We first verified the knockout efficiency at the Nucleic acid and protein levels (Supplementary Fig. 10a–c). Then we found Nlrc3−/− embryos showed developmental delays and Nlrc3−/− FLs are smaller than wild-type at 14.5 days (E14.5) (Supplementary Fig. 10d). Like the phenotype of our zebrafish model, we examined the AGM region of Nlrc3−/− embryo to determine whether the production of HSPCs was changed (Fig. 7a). Hematogenic endothelial cells (CD31+ CD41− CD45− TER119−)43 from the embryonic AGM tissues at E10.5 were sorted and cultured in OP9 for 4 days (Fig. 7b), and then, flow cytometry was performed to assess the proliferative capacity of these HSPCs. c-Kit+CD45+ hematopoietic cells were notably decreased in these Nlrc3−/− embryos (Fig. 7c, d). Correspondingly, to obtain more direct phenotypes, flow cytometry was also performed and showed that CD31+Sca-1+CD201+ hematopoietic stem cells were decreased in the AGM of Nlrc3−/− embryos at E10.5 (Supplementary Fig. 10e–g).
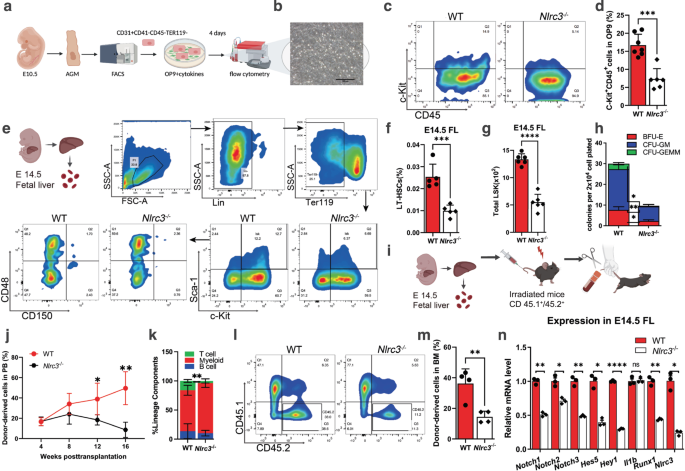
a Schematic representation of AGM-derived hematopoietic endothelial (HE) cells. b Representative view of the hematopoietic cells (round) generated from 500 HE cells after co-culture with OP9 stromal cells for 4 days. c, d Flow cytometry results showing that after 4 days of OP9 co-culture, the number of c-Kit+CD45+ cells in Nlrc3 embryos decreased with quantification (d). ***P = 0.0001, n = 7, 6 embryos. e Schematic representation of fetal liver-derived cells performed in this study and flow cytometry results showing that the number of LT-HSC (Lin− c-Kit+ Sca-1+ CD150+ CD48−) cells in Nlrc3 embryos decreased. f Percentage of LT-HSCs in 14.5 embryonic fetal liver of control embryos and Nlrc3 embryos. ***P = 0.0006, n = 5 embryos. g Quantification of LSK in 14.5 embryonic fetal liver of control embryos and Nlrc3 embryos. ****P < 0.0001, n = 6 embryos. h CFU-C assay of fetal liver showing that the number of CFU-mix, CFU-granulocyte-macrophage (CFU-GM), and CFU-erythroid (CFU-E) was decreased upon knock-down of Nlrc3. *P = 0.0114, 0.0132, ***P = 0.0007, n = 3 biological replicates. i Schematic representation of bone marrow transplantation experiments performed in this study. j A total of 5 × 10⁵ fetal liver-derived cells sorted from WT or Nlrc3−/− mice were transplanted with 5 × 10⁵ rescue cells into recipient mice. Peripheral blood (PB) analysis for the percentage of engrafted donor cells at the indicated number of weeks post-transplantation. *P = 0.0473, **P = 0.0038, n = 4 biological replicates. k At 16 weeks post-transplantation, the PB of recipient mice transplanted with control or Nlrc3−/− was analyzed for the percentage of donor-derived B, T, and myeloid cells. **P = 0.0075, n = 3 biological replicates. l Flow cytometry results show the proportion of donor with control or Nlrc3−/− in the BM of recipient mice at 16 weeks post-transplantation n = 5 biological replicates. m Quantification of the proportion of the donor-derived cell in BM. **P = 0.0055, n = 4 biological replicates. n Expression of Nlrc3, Runx1, Il1b, and Notch-related genes in WT, Nlrc3−/− whole FL at E14.5 by qPCR. ns = 0.8168, *P = 0.0137, 0.0205, 0.0107, **P = 0.0078, 0.0039, 0.0063, ****P < 0.0001. Error bars, mean ± s.d., the exact p-values mentioned above are listed from left to right by using two-tailed, unpaired Student’s t-test in (d, f, g, j, k, m, n). Illustrations created with BioRender.com. Source data are provided as a Source Data file.
To verify the phenotype of HSPCs in FL (Fig. 7e), through flow analysis, we found that the proportion and absolute number of LT-HSC populations (Lin− c-Kit+ Sca-1+ CD150+ CD48−) of FL cells from Nlrc3−/− embryos were markedly decreased (Fig. 7f, g). To test the function of Nlrc3−/− FL-derived hematopoietic stem cells in vitro, by performing a colony-forming unit-cell (CFU-C) assay, we found compromised colony formation abilities of these FL HSCs from Nlrc3−/− embryos (Fig. 7h). To verify the functionality of Nlrc3−/− embryonic HSCs in vivo, we performed BM transplantation experiments and observed a more than 3-fold reduction in the overall repopulation rate (Fig. 7i, j). We also observed a myeloid lineage bias compared to that in the control group (Fig. 7k). At 16 weeks post transplantation, the proportion of CD45.2 in the BM of recipient mice was reduced by more than 3 times compared to that of wild-type mice (Fig. 7l, m).
To verify the underlying mechanism of impaired HSC function in Nlrc3−/− mice, we performed qPCR using mRNA from FL-derived LSK (Lin− c-Kit+ Sca-1+) cells. The results showed that compared with the wild-type group, the Notch family-related genes were downregulated at the transcriptional level, and the expression of Hey1 was also decreased. This downward trend was consistent with that of Nlrc3 and the HSC marker Runx1, while no significant changes were found in the NF-kB family gene Il1b (Fig. 7n). Linking to the reported sequencing data during fetal EHT28, the expression of Notch1a and Hey1 significantly decreased in HSCs compared to HE, while the expression of Nlrc3 was increased (Supplementary Fig. 10h). The above results further demonstrated that the NF-kB-Nlrc3-Notch-Hey1 axis orchestrated development of embryonic HSCs was highly conserved in vertebrates (Supplementary Fig. 10j).
- SEO Powered Content & PR Distribution. Get Amplified Today.
- PlatoData.Network Vertical Generative Ai. Empower Yourself. Access Here.
- PlatoAiStream. Web3 Intelligence. Knowledge Amplified. Access Here.
- PlatoESG. Carbon, CleanTech, Energy, Environment, Solar, Waste Management. Access Here.
- PlatoHealth. Biotech and Clinical Trials Intelligence. Access Here.
- Source: https://www.nature.com/articles/s41467-023-44251-6