Image analysis
Particle morphology evaluation is very dependent on image quality. In this study, two particle imaging systems, namely, MDRS (Morphologi 4-ID from Malvern Panalytical) and FIM (FlowCam 8400 from Yokogawa Fluid Imaging Technologies) were used for SVP analysis. In TPs quality control, FIM has been widely used in industry for SVP analysis after LO. This experiment was designed to compare the imaging capability of MDRS system for SVP analysis with the current orthogonal method FIM system. Three particle standards PS microspheres (a traditional reference material), SU-8, and ETFE (candidate reference materials) were used for comparison, and particles ≥ 10 μm were investigated based on USP < 788 > . Overall, as shown in Fig. 1, both MDRS and FIM systems provided high-resolution images for all monodisperse particle standards, PS microspheres and SU-8. When imaging the polydisperse ETFE particles, the FIM system produced sharp and high-resolution images for most of the particles (> 90%) in the range from 10 to 100 μm.
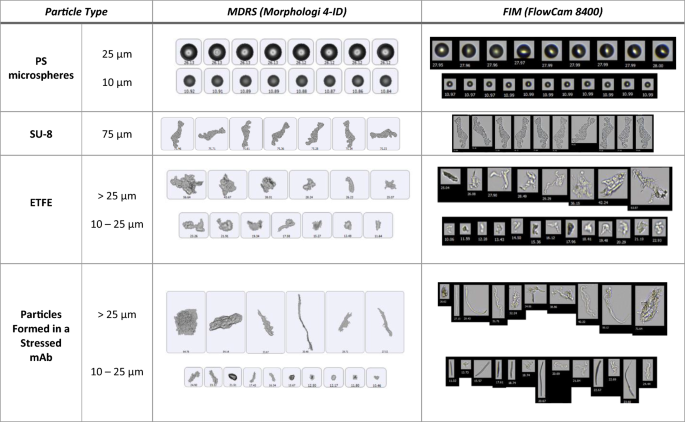
Representative images of PS microspheres, SU-8 particles, ETFE particles, and particles formed in a stressed mAb sample captured by MDRS and FIM.
MDRS showed greater than 90% probability in capturing high-resolution images for the polydisperse ETFE particles ranging from 19 to 100 μm, and the resolution decreased as the particle size decreased, as shown in Table 1. When capturing particles in the range of 16–17 μm, the probability decreased to 70%. MDRS occasionally fragments large particles into smaller ones, thereby lowering the quality of the high-resolution images of the smaller particles in the measurement, as shown in Figure S1. MDRS utilizes a static imaging system, and this enabled us to manually assess particle image resolutions. Particles remain in the sample holder after each measurement; this allows users to go back to individual particles. In this manner, machine-determined outlines were compared side-by-side with brightfield optical microscopy inspection of MDRS and the particle images with clear outlines with no fragmentation were considered high-resolution images (Table 1).
Size and shape analysis of monodisperse particle standards (PS microspheres and SU-8 candidate materials)
The size and shape analysis capabilities of MDRS and FIM systems were evaluated for comparative study using monodisperse particles. Overall, the MDRS provided comparable results to the FIM system (Fig. 2), when using the same thresholds for proteinaceous particle analysis. First, 10 μm and 25 μm microspheres were used for this study. Considering the specification values of PS microsphere standards (10.02 ± 0.06 μm and 25.52 ± 0.34 μm), the FIM slightly overestimated the sizes of microspheres in the measurements of all single particle samples (12.18 ± 0.92 μm for 10 μm microspheres and 28.46 ± 4.47 μm for 25 μm microspheres) and a mixed particle sample (12.07 ± 1.26 for 10 μm microspheres and 29.26 ± 1.20 μm for 25 μm microspheres), even though it rendered focused and well-resolved images. Overall, the size measurement results (10.81 ± 0.21 μm for 10 μm microspheres in a single particle sample, 10.91 ± 0.29 μm for 10 μm microspheres in a mixture, and 26.23 ± 0.20 μm for 25 μm microspheres in a single particle sample) provided by MDRS were closer to the specifications. The MDRS measurement of 25 μm microspheres in the mixture (29.82 ± 0.42 μm) showed similar deviation to FIM measurement. In a different threshold setting, FIM offered better results of average particle sizes in the measurements of single particle samples (10.81 ± 2.26 μm for 10 μm microspheres and 27.70 ± 2.78 μm for 25 μm microsphere) and a mixed particle sample (10.87 ± 1.31 μm for 10 μm and 27.91 ± 1.41 μm for 25 μm microspheres). Despite closer values to the specifications, much broader particle size distributions were observed, as shown in Figure S2.
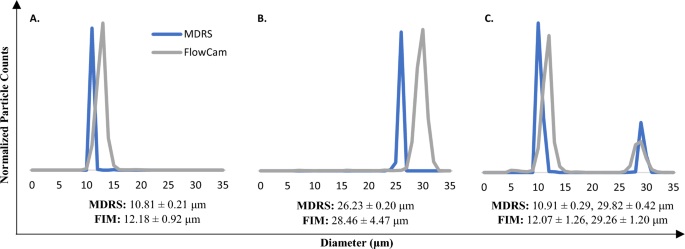
Size measurement analysis of PS microspheres standards using MDRS and FIM. The 10 μm (A) and 25 μm (B) microsphere standards were measured separately and, in a mixture (C). Particle sizes are obtained from 3 separate measurements (n = 3) reported as the mean ± standard deviation. Segmentation threshold (dark/light) were set for 12/12 in the FIM measurements.
The SU-8 particles consist of monodisperse particles with a well-defined shape. Given that different instruments employ different algorithms when calculating morphological data, this candidate reference material was used to assess the accuracy and compare size and shape measurement in two systems. Morphological data such as diameter, length, aspect ratio, circularity, and convexity values were calculated by MDRS and FIM, and these values were compared with the values directly obtained from optical microscopy measurements, as shown in Fig. 3. As seen in the evaluation of size measurements of PS microspheres, most of morphology values measured by MDRS were precise with a smaller standard deviation. In the size evaluation, diameter (74.28 ± 0.97 μm) and length (148.67 ± 0.89 μm) measured by MDRS were closer to the results from optical microscopy (71.55 ± 0.23 μm for diameter and 147.92 ± 0.23 μm for length) than diameter (75.92 ± 2.99 μm) and length (152.9 ± 2.52 μm) measured by FIM. The shape evaluation illustrated a similar trend as the size evaluation. Aspect ratio (0.34 ± 0.01) and circularity (0.25 ± 0.02) calculated by MDRS were closer to the optical microscopy values (0.33 ± 0.001 for aspect ratio and 0.29 ± 0.002 for circularity) compared to aspect ratio (0.27 ± 0.02) and circularity (0.34 ± 0.02) values calculated by FIM. Convexity was the only morphology factor that FIM (0.78 ± 0.01) calculated closer value to optical microscopy (0.86 ± 0.01) compared to MDRS (0.75 ± 0.02). P values for all the morphology factors were less than 0.001 regardless of methods indicating statistical significances. In summary, our data indicated that MDRS offered comparable size and shape information to morphological values analyzed by optical microscopy in most of measurements.
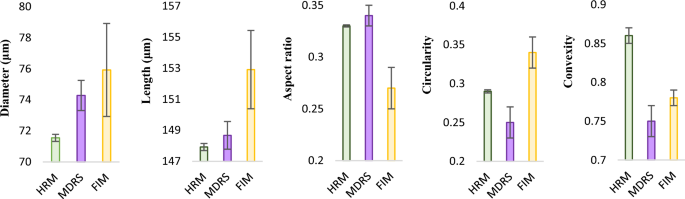
Morphological data of SU-8 particles calculated by HRM (high-resolution microscopy), MDRS and FIM. The maximum distance between any two parallel tangents on a particle, also known as the maximum Feret’s diameter, was presented as length. Morphological values were obtained from 3 separate measurements (n = 3) reported as the mean ± standard deviation. Diameters measured by HRM, MDRS, and FIM were 71.55 ± 0.23, 74.28 ± 0.97, and 75.92 ± 2.99, respectively. Lengths measured by HRM, MDRS, and FIM were 147.92 ± 0.23, 148.67 ± 0.89, and 152.9 ± 2.52, respectively. Aspect ratios measured by HRM, MDRS, and FIM were 0.33 ± 0.001, 0.34 ± 0.01, and 0.27 ± 0.02, respectively. Circularity measured by HRM, MDRS, and FIM were 0.29 ± 0.002, 0.25 ± 0.02, and 0.34 ± 0.02, respectively. Convexity measured by HRM, MDRS, and FIM were 0.86 ± 0.01, 0.75 ± 0.02, and 0.78 ± 0.01, respectively.
Size and shape analysis of polydisperse ETFE particles
Next, the size and shape analysis capabilities of MDRS and FIM systems were evaluated using polydisperse ETFE particles. First, in shape analysis, the MDRS results were comparable with the FIM results. Given that high-resolution images were obtained with > 90% probability by MDRS for particles > 19 μm, morphology data of the particles in this size range were used to plot the histograms in comparison of shape analysis performance, as shown in Fig. 4A–F. Morphology parameters such as aspect ratio, circularity, and convexity are defined and explained in Method section. Aspect ratio, circularity, and convexity values calculated by FIM were 0.56 ± 0.16, 0.47 ± 0.15, and 0.83 ± 0.11, respectively. MDRS determined aspect ratio, circularity, and convexity values as 0.65 ± 0.15, 0.35 ± 0.10, and 0.74 ± 0.07, respectively. Overall, both systems presented similar distributions in morphology values, but for all the morphology factors, p values between MDRS and FIM methods were less than 0.001 demonstrating statistical significances.
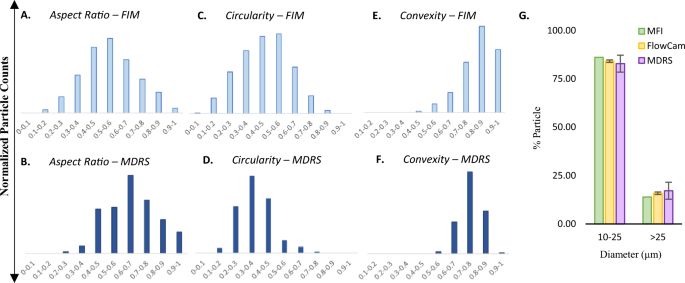
(A)–(F) Morphological data histograms and (G) particle size distributions of ETFE particles measured by different methods. FlowCam and MDRS systems were used to measure (A) & (B) aspect ratio, (C) & (D) circularity, and (E) & (F) convexity of the ETFE particles. (G) The particle size distribution was measured by MDRS (purple) and compared with the two FIM systems, MFI (green) and FlowCam (yellow).
The particle size data obtained by MDRS (Morphologi 4-ID) were compared with two different FIM systems, MFI (Micro-Flow Imaging DPA4200) and FlowCam (FlowCam8400), as shown in Fig. 4G. MFI and FlowCam systems provided comparable size data with each other as reported19. FIM systems count the number of particles in a specified volume, which remains relatively constant for each measurement with narrow error bars. However, the particle concentrations measured by MDRS varies in each measurement because the concentration quantitation was largely affected by particle dispersion states. For this reason, MDRS has been used to provide percentage-based analysis such as % particle size distribution and % particle composition20,21,22. Hence, % particle size distribution was investigated using ETFE for a comparative study between FIM and MDRS. MFI, FlowCam, and MDRS calculated 86.08%, 84.13 ± 0.66%, and 82.84 ± 4.38% for particles ranging from 10 to 25 μm, respectively. For particles ≥ 25 μm, 13.92%, 15.87 ± 0.66%, and 17.17 ± 4.39% were measured by MFI, FlowCam, and MDRS, respectively. These systems reported similar particle size distribution results, showing less than 3.25% differences for both size ranges. Even though MDRS shows the biggest standard deviation, the size analysis performance of MDRS were comparable to the other two systems given that approximately 4.4% standard deviation is not considered as a statistically significant variation.
Particle identification using MDRS
Compared to other SVP imaging methods, the biggest advantage of MDRS is a direct chemical identification of each particle using Raman spectroscopy23,24,25. In this study, PS microspheres and ETFE particles were used to assess its particle identification capability. Chemical correlation scores of their Raman spectra to reference spectra were calculated and the scores between 0 (the least identical to the reference spectrum) and 1 (the most identical to the reference spectrum) were assigned to each particle. A mixture of PS microspheres in three different sizes (2 μm, 10 μm, and 25 μm) were used and Raman spectra of 30 out of 622 particles (10 particles for each size) in a batch were measured individually using a 30 s exposure time, as described in the “Methods” section. PS microspheres are known to have eight characteristic peaks in its Raman spectrum such as aromatic ring deformation at 621 cm−1, C–H out-of-plane deformation at 795 cm−1, aromatic ring breathing mode at 1000 cm−1, C–H in-plane deformation at 1031 cm−1, C–C stretch at 1155 cm−1, CH2 scissoring at 1450 cm−1, C=C stretch at 1583 cm−1, and aromatic ring-skeletal stretch at 1602 cm−126,27. As shown in Fig. 5A, Raman spectra of a mixture of 2 μm, 10 μm, and 25 μm PS microspheres were overlaid, indicating that the signal intensity decreased as the sizes of microspheres decreased. The laser size of an MDRS instrument is 3 μm, and therefore it attenuates the signal-to-noise ratio (S/N) of particles having smaller than 3 μm because of background interference18. Despite a relatively low S/N for 2 μm PS microspheres peaks compared to the larger microspheres, the average chemical correlation scores of 2 μm, 10 μm, and 25 μm microspheres were calculated as 0.96, 1.00, and 1.00, respectively, enabling successful particle identification.
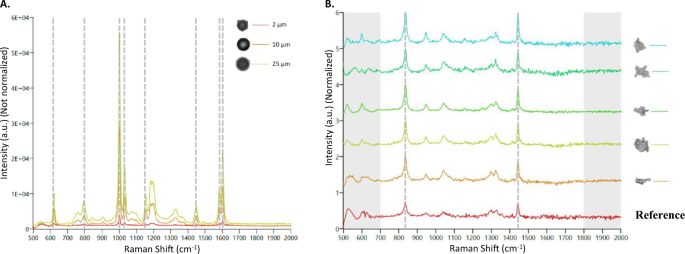
(A) The overlaid Raman spectra of PS microspheres with different sizes. 2 μm, 10 μm, and 25 μm microspheres were examined and the peak intensities were not normalized for the direct comparison of the intensity change. Characteristic peaks found in PS microspheres were highlighted with gray dashed lines at 621 cm−1, 795 cm−1, 1001 cm−1, 1031 cm−1, 1155 cm−1, 1450 cm−1, 1583 cm−1and 1602 cm−1. (B) Representative Raman spectra of ETFE particles measured by MDRS. ETFE particles ≥ 25 μm were investigated and their intensities were normalized. The region of 700–1800 cm−1 in each spectrum was compared with ETFE reference spectrum (red) and their correlation scores were calculated based on their peak similarity. Characteristic peaks found in an ETFE polymer were highlighted with gray dashed lines at 835 cm−1, and 1444 cm−1.
Raman spectra of all the ETFE particles ≥ 25 μm (90 out of 90) and 100 out of 1044 particles in the range of 5–25 μm were manually acquired. ETFE is a fluorine-based polymer and the ETFE Raman spectrum is dominated by two sharp peaks at 835 cm−1 for CF2 stretch and 1444 cm−1 for CH2 bending28. The representative Raman spectra of ETFE particles ≥ 25 μm is shown in Fig. 5B and the average chemical correlation score was calculated as 0.90 out of 1, closely matching the reference ETFE spectrum. The average chemical correlation scores of the particles in range of 10–25 μm and 5–10 μm were calculated to be 0.83 and 0.65, respectively. These results indicate that as the sizes of particles decrease, the average correlation score decreases also due to lower S/N, which made it more challenging for the software to differentiate the particle of interest. The representative Raman spectra of each particle group can be found in Figure S3.
Characterization of proteinaceous particles formed in stressed mAb samples using MDRS
MDRS particle analysis method was applied to characterize particles in stressed TPs. Two commercially available mAb drug products—Vectibix and Rituxan—were subjected to stress condition (70 °C and 300 rpm) to artificially generate particles as described in the “Methods” section. Considering image resolution, particles > 20 μm were investigated among all the particles formed in the mAb samples. Particle size distributions and morphology parameters such as aspect ratio, circularity, convexity, and elongation were examined. Another shape parameter, elongation, was added to take a detailed look at fibril-shaped particle formation. In addition to the morphology analysis, each particle was chemically identified using Raman spectroscopy. The representative images of individual particles were shown in Fig. 6A for Vectibix and Fig. 6B for Rituxan. The Vectibix sample yielded gray and transparent particles compared to dark particles formed in the Rituxan sample. The size distribution histogram shown in Fig. 6C indicated that most of particles in the Vectibix sample were smaller than 40 μm. In contrast, particles in Rituxan sample had various sizes across the SVP range from 20 to 100 μm, even though they were exposed to the same stress conditions.
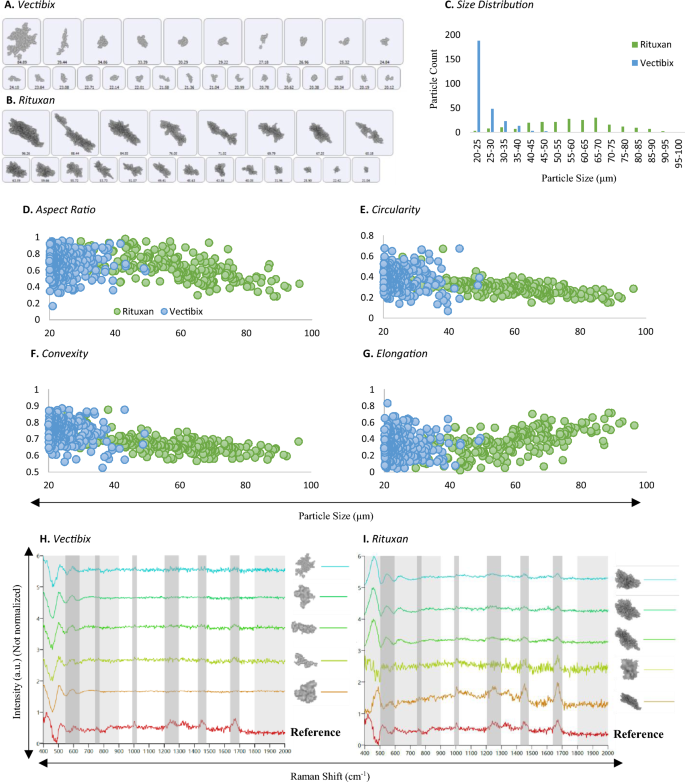
(A) (B) Representative particle images, (C) particle size distributions, (D)–(G) morphological data histograms, (H) (I) representative Raman spectra of proteinaceous particles in stressed mAb samples, Vectibix (blue) and Rituxan (green), measured by MDRS system. Morphological data such as (D) aspect ratio, (E) circularity, (F) convexity, and (G) elongation values of the two proteinaceous particles were compared. In Raman spectra, characteristic peaks of proteinaceous particles were highlighted in gray regions at 500–550 cm−1, 770 cm−1, 1000 cm−1, 1230 cm−1, 1400 cm−1, and 1670–1690 cm−1. The region of 900–1800 cm−1 in each spectrum was compared with protein aggregate reference spectrum (red) and their correlation scores were calculated based on the peak similarity.
Particle morphology parameters were studied and shown in Fig. 6D–G and the average values were summarized in Table 2. Our data indicated that the average morphology values of the particles formed in the Vectibix sample did not change much as the particle size grew. The average aspect ratio value slightly increased from 0.67 to 0.69 and the other values slightly decreased from 0.39 to 0.37 for circularity, from 0.75 to 0.70 for convexity, and from 0.33 to 0.31 for elongation. In contrast, the average morphology values of the particles formed in Rituxan sample showed different trends. As particle growth, elongation was the only value increased from 0.27 to 0.55 and other values decreased from 0.74 to 0.45 for aspect ratio, from 0.4 to 0.21 for circularity, and from 0.74 to 0.62 for convexity. Compared to the differences in morphology values of Vectibix particles, significant increase or decrease were observed in Rituxan particles.
The Raman spectra of particles from stressed mAb samples are presented in Fig. 6H for Vectibix and Fig. 6I for Rituxan. Among particles > 25 μm, 57 out of 531 particles in Rituxan sample and 26 out of 91 particles in Vectibix sample were randomly selected and their Raman spectra were manually acquired. Proteins misfold or unfold when they are exposed to various stress conditions such as acidic/basic pH, heat, and agitation, resulting in protein aggregation. Consequently, peak shift, broadening and/or peak intensity change can be observed in certain peaks of the proteinaceous particle Raman spectrum, but in general, they have similar Raman spectra to the native protein. The characteristic peaks of mAbs are highlighted in gray regions at 500–550 cm−1 for disulfide bonds, at 770 cm−1 for tryptophan, at 1000 cm−1 for phenylalanine, at 1230 cm−1 for amide III bonds, at 1400 cm−1 for asymmetric CH2, and at 1670–1690 cm−1 for amide I bonds. Since the tryptophan peak at 760 cm−1 is usually weak, the region from 900 to 1800 cm−1 was investigated to calculate chemical correlation scores. Among all the proteinaceous particle spectra, as a protein aggregate reference, selected was the spectrum having the strongest peaks for phenylalanine, amide III bonds, asymmetric CH2, and amide I bonds. With respect to the reference spectrum, the average chemical correlation scores of particles in Vectibix and Rituxan samples were calculated as 0.35 and 0.66, respectively. The average chemical correlation scores of Rituxan proteinaceous particles to ETFE and PS microsphere reference spectra were calculated as 0.26 and 0.09, respectively. The average chemical correlation scores of Vectibix proteinaceous particles to ETFE and PS microsphere reference spectra were calculated as 0.16 and 0.05, respectively. Rituxan proteinaceous particles showed higher chemical correlation score regarding protein aggregate reference because they were larger and thicker, resulting in higher S/N, compared to the Vectibix proteinaceous particles. The correlation scores of Rituxan proteinaceous particles indicated a meaningful difference between protein aggregate and other standards such as ETFE and PS microsphere. In contrast, the correlation scores of Vectibix proteinaceous particles demonstrated insignificant difference between protein aggregate and other standards due to low S/N. The chemical correlation scores generally decrease, as particle size decreases. In case of Rituxan proteinaceous particles, among all the proteinaceous particles bigger than 40 μm, the lowest chemical correlation score was 0.6 and the average score was 0.78 out of 1. As particle sizes reached below 40 μm, their chemical correlation scores started to decrease rapidly, as shown in Figure S4.
Suitability of ETFE particles as a proteinaceous particle surrogate
Morphology parameters of three particle reference materials such as PS microspheres, SU-8, and ETFE were measured by MDRS and compared with those of proteinaceous particles formed in the Vectibix sample. Considering image resolutions, data of the monodisperse particles (PS microspheres and SU-8) in all size ranges and polydisperse particles (ETFE and mAb) > 20 um were used to calculate these values. The histograms of aspect ratio, circularity, convexity, and elongation values are shown in Fig. 7. The aspect ratio values were calculated to be 0.97 ± 0.07 for PS microspheres, 0.34 ± 0.01 for SU-8, 0.65 ± 0.15 for ETFE, and 0.58 ± 0.22 for mAb proteinaceous particle. The circularity values were calculated as 0.88 ± 0.17 for PS microspheres, 0.25 ± 0.02 for SU-8, 0.35 ± 0.10 for ETFE, and 0.37 ± 0.18 for mAb proteinaceous particle. The convexity values were calculated as 0.95 ± 0.07 for PS microspheres, 0.75 ± 0.02 for SU-8, 0.74 ± 0.07 for ETFE, and 0.76 ± 0.08 for mAb proteinaceous particle. The elongation values were calculated as 0.93 ± 0.07 for PS microspheres, 0.66 ± 0.01 for SU-8, 0.35 ± 0.15 for ETFE, and 0.42 ± 0.22 for mAb proteinaceous particle.
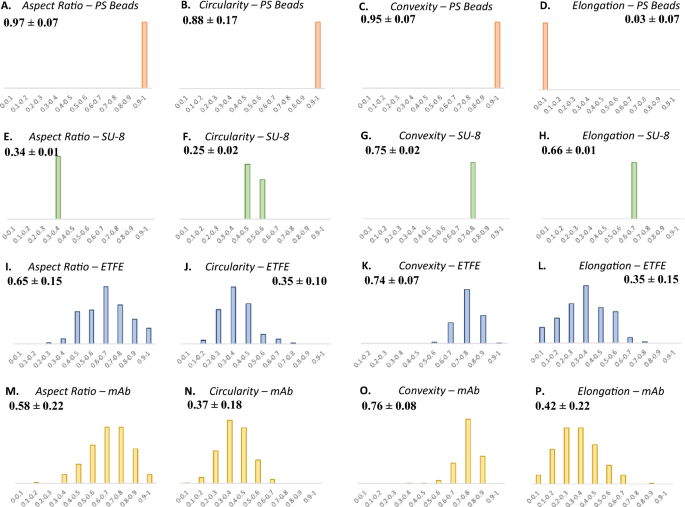
(A)–(D) Morphological data histograms of PS microspheres (orange), (E)–(H) SU-8 particles (green), (I)–(L) ETFE particles (blue), and (M)–(P) proteinaceous particles (yellow) in a stressed mAb (Vectibix) sample measured by MDRS. Aspect ratio, circularity, convexity, and elongation histograms were compared.
Transparency is an important particle property along with particle morphology. To investigate differences in transparency between particle reference materials and proteinaceous particles, mean intensity values of PS microspheres, SU-8, and ETFE were measured by MDRS and compared with those of proteinaceous particles formed in the Rituxan and Vectibix samples, as shown in Figure S5. A particle with high mean intensity is considered a more transparent particle. Our data reported that PS microspheres showed a much lower value of 58.97 ± 8.15, while in contrast SU-8 (143.45 ± 3.87) and ETFE (156.10 ± 6.86) particles showed similar values to proteinaceous particles (135.42 ± 6.39 for Rituxan and 164.32 ± 4.41 for Vectibix). In all aspects, ETFE candidate reference material demonstrated the closest values and PS microspheres exhibited the farthest values to the values obtained from the proteinaceous particles. In morphology analysis, the ETFE histogram distributions resembled those of the proteinaceous particles the most, in that they showed wide distributions of morphology values. In contrast, the histograms of the other particle reference materials such as PS microspheres and SU-8 showed very narrow value ranges. Transparency analysis reported a similar result demonstrating that ETFE particles are as transparent as proteinaceous particles.
- SEO Powered Content & PR Distribution. Get Amplified Today.
- PlatoData.Network Vertical Generative Ai. Empower Yourself. Access Here.
- PlatoAiStream. Web3 Intelligence. Knowledge Amplified. Access Here.
- PlatoESG. Carbon, CleanTech, Energy, Environment, Solar, Waste Management. Access Here.
- PlatoHealth. Biotech and Clinical Trials Intelligence. Access Here.
- Source: https://www.nature.com/articles/s41598-023-45720-0