Temporally dynamic WNT activation, followed by inhibition, increases efficiency of human PGCLC specification
We hypothesized that temporal control over WNT signaling might be crucial for PGCLC specification, as the precise duration of WNT activity is of paramount importance to specify multiple cell types from hPSCs28,29. Prevailing methods for hPSC differentiation into PGCLCs generally entail two steps. First, exposure to posteriorizing signals (including TGFβ, WNT, and non-specific ROCK inhibitor Y-27632) that induce primitive streak/mesoderm for 12-60 h6,8,14. Second, cells are then aggregated in 3D and treated with high concentrations of BMP, EGF, SCF, LIF, and Y-27632 for multiple days to generate PGCLCs6,8. Using these published protocols as a framework (Fig. S1a)6,8 and NANOS3-mCherry hPSCs to quantify the percentage of NANOS3+ PGCLCs7, we sought to examine the temporal dynamics of WNT signaling and to generate human PGCLCs in monolayer cultures.
First, we found that in the first phase of differentiation, 12 h of exposure to posteriorizing signals (including WNT agonist CHIR99021) was optimal, in order for NANOS3-mCherry+ PGCLCs to subsequently arise at the second stage of differentiation (Fig. 1b) in monolayer cultures. We further confirmed that 12 h of posteriorizing signals was optimal across 3 additional hPSC lines (Fig. S1b), thereby reaffirming findings that 12 h treatment with posteriorizing signals is ideal for subsequent PGCLC differentiation8. In our hands, prolonged exposure to posteriorizing signals for 24 h—which we and others have shown generate primitive streak (PS) cells capable of subsequent endoderm and mesoderm differentiation8,28,29—abrogated the subsequent generation of PGCLCs in the second phase (Fig. 1b, Fig. S1b).
Subsequently, in the second phase of differentiation, we found that explicit inhibition of WNT signaling (using XAV93930) led to a ~2–3-fold improvement in PGCLC specification (Fig. 1c), compare “base condition” vs. “XAV939”). Conversely, continued WNT activation with CHIR99021 in the second phase of differentiation completely repressed PGCLC specification (Fig. 1c). The explicit requirement for WNT inhibition (beyond simply withholding exogenous WNT) implies that differentiating hPSCs endogenously produce WNT signals28,29,31, which inhibit PGCLC formation. This emphasizes the need to control endogenous signals to guide efficient differentiation and is consistent with how PRDM14 inhibits endogenous WNT signaling during PGCLC specification13.
Given the importance of this initial 12-h WNT pulse in the first phase of differentiation, we sought to molecularly detail the differentiated cells at day 0.5 (D0.5), which constitute a key intermediate en route to PGCLC differentiation. Single-cell RNA-sequencing (scRNA-seq, using the 10X Genomics droplet-based platform32) revealed that these hPSC-derived D0.5 cells were fairly homogenous, and continued to highly express pluripotency transcription factorsOCT4 and NANOG, although SOX2 decreased (Fig. 1d, Fig. S1c, d). D0.5 cells also began to concomitantly express posterior epiblast/future primitive streak markers such as MIXL1, BRACHYURY, FGF8, and NODAL (Fig. 1e, Fig. S1c, d). However, D0.5 cells generally expressed posterior epiblast/primitive streak markers at lower levels (apart from FGF8) compared to D1 primitive streak cells that were generated by 24 h of exposure to posteriorizing signals (Fig. 1e). Consistent with the use of TGFβ and WNT agonists to induce D0.5 cells, these cells demonstrated an active transcriptional response to both signaling pathways, including TGFβ target genes (FOLLISTATIN, ID1 and LEFTY2) and WNT target genes (SP5) (Fig. S1c, d). The D0.5 cell population did not show substantial transcriptional heterogeneity, as shown by scRNA-seq (Fig. S1e).
We provisionally designate these intermediate cells generated upon 12-h exposure to posteriorizing signals as “posterior epiblast” to distinguish them from primitive streak. As discussed above, D1 PS cells can generate endoderm and mesoderm, but not PGCLCs (Fig. 1b, Fig. S1b). We propose that D0.5 cells correspond to “posterior epiblast” based on how, in mouse embryos, the post-implantation pluripotent epiblast is formed by embryonic day 5.5 (E5.5), but then PS markers (e.g., Brachyury) are transiently expressed in the posterior region of the epiblast (~E6-E6.25) immediately prior to overt formation of the morphologically-conspicuous PS (~E6.5)22; similar results have been reported in pig embryos8. However, we note that early human post-implantation embryos remain inaccessible for analysis, and thus assignment of terms such as “posterior epiblast” or “primitive streak” in human is premised on evolutionary homology to other mammals such as pig and mouse27. In summary, this discloses a unique transcriptional signature for D0.5 posterior epiblast cells, wherein pluripotency factors OCT4 and NANOG are co-expressed together with primitive streak markers.
Subsequent WNT inhibition promotes PGCLC specification and represses mesodermal genes
To further investigate the role of WNT inhibition in the second phase of differentiation, we added WNT agonist (CHIR99021) or WNT inhibitor (XAV939) to D0.5 posterior epiblast cells for the remainder of differentiation and performed bulk transcriptomic analyses at different timepoints (Fig. 2a, Fig. S2a–f, Supplementary Data 5).
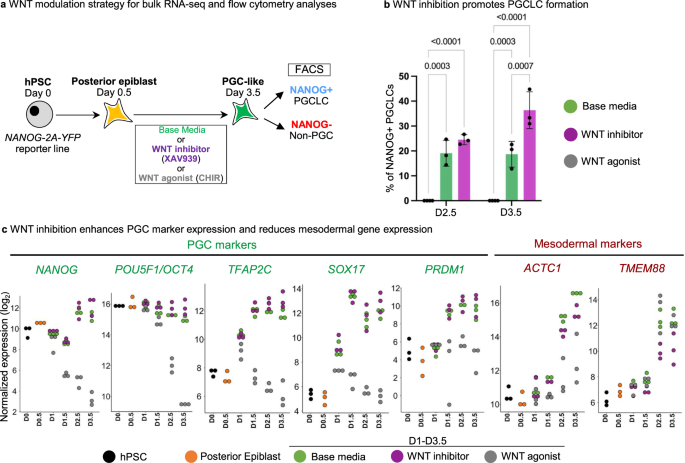
a Schematic of WNT agonism (CHIR) or WNT antagonism (XAV939) or no WNT manipulation (base media) at different timepoints during PGCLC monolayer differentiation. b FACS data showing efficiency of generating NANOG+ PGCLCs under different conditions of WNT pathway manipulation at Day 2.5 and Day 3.5. Data are presented as mean values ± SEM. Statistical test–two-way ANOVA, with Tukey multiple testing correction. n = 3 biological replicates/group for all except for CHIR99021 where n = 4 biological replicates/group. Adjusted P values are shown above error bars. Source data are provided as a Source Data file. c Log2 normalized expression levels of PGC and mesodermal markers in Base media vs. XAV939 vs. CHIR treated samples at different timepoints. n = 3 biological replicates/group.
WNT inhibition promoted PGCLC formation (Fig. 2b), induced higher levels of PGC markers (NANOG, POU5F1, TFAP2C, SOX17 and PRDM1) and repressed mesodermal genes (ACTC1 and TMEM88) (Fig. 2c). While lack of any WNT inhibition (“base media” alone) still gave rise to PGCLCs, it did so less efficiently than with WNT inhibition (Fig. 2b). WNT ligands (e.g., WNT5B) and WNT target genes (e.g., LEF1 and SP5) were upregulated in PGCLCs generated from the standard “base media” condition, but their expression was repressed by WNT inhibitor treatment (Fig. 3a–d, Fig. S2f, Supplementary Data 5). Indeed, quantifying the total expression of all known WNT ligands and WNT target genes revealed that WNT inhibition repressed overall levels of endogenous WNT ligand expression and WNT pathway activation (Fig. 3a, b). Continued WNT activation instead induced primitive streak markers and strongly repressed PGCLC formation (Figs. S3a, b, 2c).
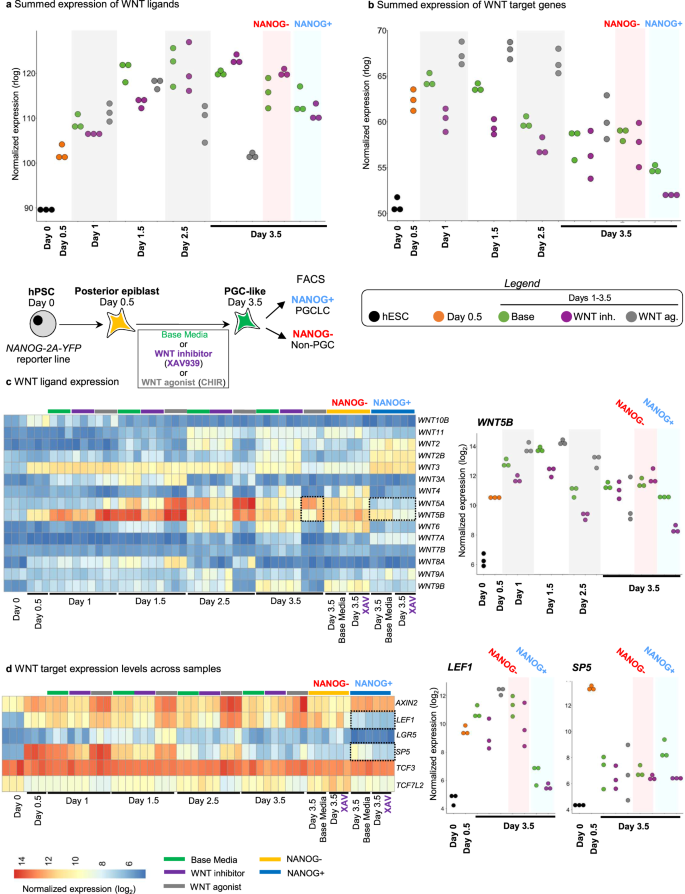
a Summed expression levels of all WNT ligands in all the samples. List of expressed WNT ligands are shown in c. n = 3 biological replicates/group. b Summed expression levels of WNT targets in all the samples. List of selected WNT targets are shown in d. c Left: Heatmap of all expressed WNT ligands across all samples. Right: endogenous WNT5B expression in all samples across different timepoints. d Left: Heatmap of all selected known WNT targets across all samples. Right: endogenous LEF1 and SP5 expression in all samples across different timepoints.
We conclude that temporally dynamic WNT activation, followed by inhibition, enhances human PGCLC specification by repressing endogenously activated WNT ligands, thus providing an additional dimension to our knowledge of PGCLC development. This parallels how WNT is initially required, and then is dispensable, for pig PGC specification in embryonic explant cultures8.
Generation of human PGCLCs in monolayer conditions
After generating presumptive posterior epiblast cells, we tested whether continuous BMP, SCF, LIF, and EGF activation6,7,8 was required for the entire second phase of PGCLC differentiation in monolayers. First, omitting BMP4 from the culture media from D1.5-D2.5 led to a ~2.5-fold increase in PGCLC specification, while the absence of SCF and EGF from D0.5-D1.5 was superfluous (Fig. S4a). Second, past 3D differentiation methods used high BMP4 concentrations (200–500 ng/mL)6,7,8, but in our monolayer conditions, significantly lower (25-fold lower) BMP4 concentrations were needed (Fig. S4b). This is consistent with the notion that BMP signaling does not effectively act across large hPSC clusters33,34. 3D aggregates may therefore impair BMP signaling, thus emphasizing potential benefits of a monolayer differentiation system. Third, LIF, which is commonly used to enhance PGCLC survival6,7,8, was dispensable in our platform (Fig. S4c). Fourth, we observed a peak of PGCLC formation by day 3.5 of differentiation (Fig. S4d).
Combining these improvements together, we developed a monolayer, serum-free protocol (Fig. 4a) to generate consistently and reproducibly 20-30% pure NANOS3-mCherry+ PGCLCs within 3.5 days of in vitro differentiation (Fig. 4b). NANOS3-mCherry+ PGCLCs purified by fluorescence-activated cell sorting (FACS) expressed hallmark PGC markers, including POU5F1 (OCT4), NANOG, TFCP2L1, PRDM1 (BLIMP1), NANOS3 and TFAP2C (AP2γ) (Fig. 4c). At the protein level, PGCLCs co-expressed NANOG, PRDM1/BLIMP1, SOX17 and OCT4/POU5F1 (Fig. 4d, e). Additionally, PGCLCs generated through our protocol contained 5-hydroxymethylcytosine (Fig. S4e), an important intermediate in DNA demethylation and thus the epigenetic resetting of PGCs/PGCLCs7,35.
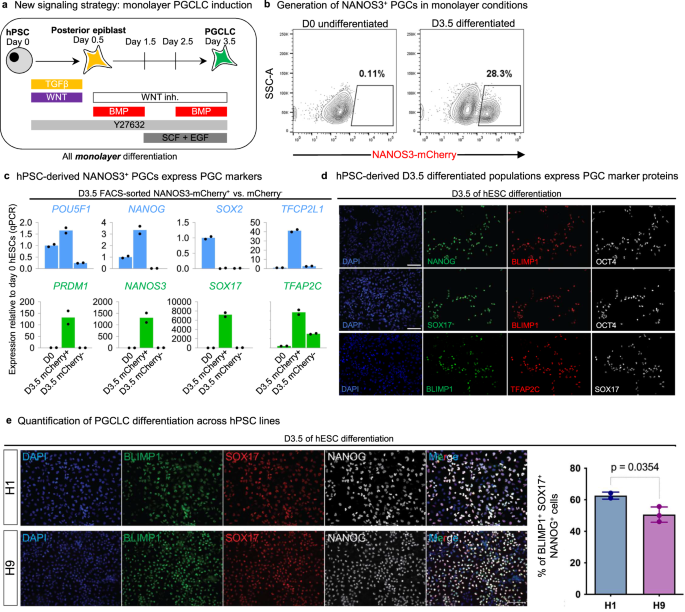
a Schematic of the 2D monolayer PGCLC differentiation protocol reported in this manuscript. b Flow cytometry analysis of NANOS3-mCherry hESC shows fluorescent reporter expression before or after 3.5 days of differentiation. c qPCR analysis of NANOS3-mCherry+ PGCLCs and NANOS3-mCherry- non-PGCLCs derived after 3.5 days of differentiation, as shown in h; as a negative control, undifferentiated hPSCs (D0) were also analyzed, and gene expression is shown relative to undifferentiated hPSCs (which was set = 1.0). Data are presented as mean values. Source data are provided as a Source Data file. d Immunostaining of hPSCs differentiated for D3.5 showing expression of PGC markers in a subset of cells (nuclear counterstain: DAPI). Scale bar = 100 μm. e Validation of protein expression in D3.5 human ESCs. Each panel indicates the corresponding marker. The graph on the right represents the quantification of triple positive cells at D3.5 in the differentiation protocol. See Materials and Methods for details on quantification method. Each column represents mean with SEM for at least two biological replicates. n = 19,687 for H1, n = 57,067 for H9. DAPI was used as nuclear counterstain. Representative of two independent experiments. P values are shown above bars; error bars = standard error of mean. Statistical test–unpaired t test with Welch’s correction. Source data are provided as a Source Data file.
Finally, we independently validated this monolayer differentiation protocol using a separate SOX17-GFP knock-in reporter hPSC line36 to track the expression of human PGCLC marker SOX177 (Fig. S4f, g). We ultimately applied our differentiation protocol across 5 additional hESC/hiPSC lines and found that it reproducibly generated PGCLCs (detailed below; Fig. 4e, Fig. 5, Fig. S5).
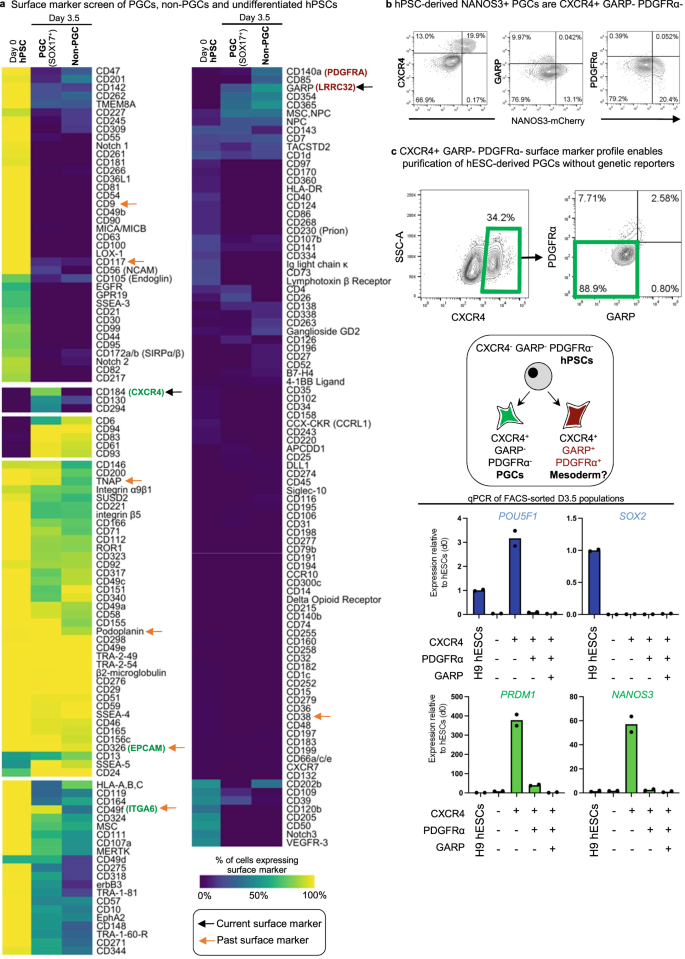
a Heatmap of surface markers expressed in undifferentiated hPSC (D0), D3.5 SOX17-GFP+ PGCLCs, and D3.5 SOX17-GFP− non-PGCLCs identified from LEGENDScreen; to discriminate PGCLCs vs. non-PGCLCs, SOX17-GFP hESCs were differentiated for D3.5 and then subgated on GFP+ and GFP− before further analysis of surface marker expression; color shades represent the percentage of cells in each expression that are positive for a given marker; each row depicts expression of a single surface marker across all populations. b Flow cytometry analysis of D3.5 differentiated NANOS3-mCherry hESCs reveals CXCR4, GARP, and PDGFRα expression relative to NANOS3-mCherry fluorescent reporter expression. c Flow cytometry gating strategy to identify CXCR4+/GARP−/PDGFRα− PGCLCs derived from H9 hESCs (that did not carry any fluorescent reporters) that were differentiated for D3.5; various cell populations from the D3.5 population were FACS sorted and subject to qPCR analysis, revealing that pluripotency and PGC markers are restricted to the CXCR4+/GARP−/ PDGFRα− subset and therefore reaffirming its PGCLC identity. N = 2 biological replicates, Data are presented as mean values. Source data are provided as a Source Data file.
Surface-marker profile of hPSC-derived PGCLCs: CXCR4+ PDGFRα− GARP−
Current protocols to generate human PGCLCs in monolayers (this study) or aggregates6,7,8 generate heterogeneous cell populations containing a subset of PGCLCs; therefore cell-surface markers to selectively identify and purify PGCLCs would be a boon. EPCAM, ITGA6, PDPN, CD38, KIT, and alkaline phosphatase activity have been previously reported to enrich for human or non-human primate PGCLCs6,7,9. However, at the transcriptional level, many of these markers are also expressed on undifferentiated hPSCs (Fig. S5a), consistent with past reports that hPSCs express these marker proteins6,7,9. Using our optimized monolayer platform for PGCLC differentiation, we thus sought to discover alternative cell-surface markers to purify PGCLCs.
We robotically screened the expression of 369 cell-surface markers using high-throughput FACS28 on SOX17-GFP hPSCs differentiated into D3.5 SOX17-GFP+ PGCLCs vs. SOX17-GFP− non-PGCLCs; undifferentiated hPSCs were also included as a negative control (Fig. 5a). This confirmed that EPCAM, ITGA6, PDPN and alkaline phosphatase6,7,9 were not specific markers since they were both expressed on hPSCs as well as PGCLCs (Fig. 5a).
In our analysis, the most specific positive marker for SOX17-GFP+ PGCLCs was the chemokine receptor CXCR4/CD184 (Fig. 5a), which similarly marked NANOS3-mCherry+ PGCLCs (Fig. 5b). Intriguingly, in model organisms, CXCR4 is known to be expressed by PGCs, and enables PGC migration towards the gonads in response to CXCL1237,38,39,40; this may also be conserved in human12. However, CXCR4 is also expressed on mesodermal derivatives41, and therefore negative expression of mesodermal markers is necessary to exclude mesoderm. We found that the mesodermal markers PDGFRα/CD140A42 and GARP/LRRC3228 were expressed on the D3.5 non-PGCLCs (Fig. 5a, b), thus providing a means to eliminate mesoderm. At the transcriptional level, RNA-seq reaffirmed that PGCLCs were CXCR4 + PDGFRA−, in contrast to commonly used PGCLC markers EPCAM and ITGA66,9, which were both expressed on PGCLCs and hPSCs and were therefore less specific (Fig. S2d).
Taken together, by relying on a combination of positive (CXCR4) and negative (PDGFRα, GARP) markers, we defined a CXCR4+ PDGFRα− GARP− surface marker profile for hPSC-derived PGCLCs. Logical combinations of positive and negative markers have likewise proven decisive in the purification of specific cell-types in blood and other tissues43. In differentiated D3.5 cultures, the CXCR4+ PDGFRα− GARP− fraction contained all PGCLCs; other combinations of these surface markers did not enrich for PGCLCs (Fig. 5c).
PGCLCs can be consistently generated across diverse hESC and hiPSC lines
We validated our monolayer differentiation protocol as well as the CXCR4+ PDGFRα− GARP− sorting strategy across an additional panel of five wildtype hESC and hiPSC lines (encompassing both male and female lines) that did not bear knock-in reporters. The present monolayer differentiation method generated an average of 46.3 ± 8.5% pure CXCR4+ PDGFRα− GARP− PGCLCs (Fig. 6a, Fig. S5b). Our CXCR4+ PDGFRα− GARP− cell-surface marker signature allowed us to purify differentiated PGCLCs across all hESC and hiPSC lines tested, using our improved differentiation strategy and without recourse to transgenic reporters (Fig. 6a, Fig. S5b). Across all lines, FACS purification of CXCR4+ PDGFRα− GARP− PGCLCs enriched the expression of hallmark PGC markers (Fig. S5c). Immunostaining of FACS-purified CXCR4+ PDGFRα− GARP− PGCLCs showed that most FACS-sorted cells (89.7 ± 2.5% for H1, 93.5±0.5% for H9) co-expressed PGC hallmark proteins BLIMP1/PRDM1, SOX17, and NANOG (Fig. 6b, Fig. S5d). This exemplifies the fidelity of PGCLC specification across distinct genetic backgrounds and demonstrates the utility of the CXCR4+ PDGFRα− GARP− surface marker profile.
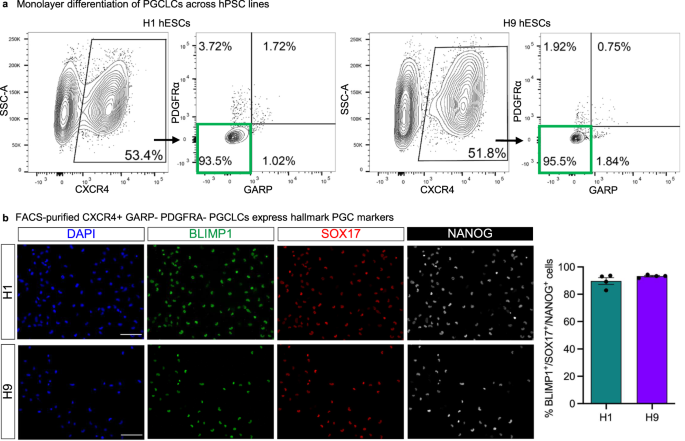
a Representative FACS plots showing gating strategy based on CXCR4, PDGFRa, and GARP signals. Briefly, cells were first gated based on CXCR4 signal (left panels for both cell lines). These cells were then further analyzed to exclude PDGFRα+ and GARP+ cells, highlighted by the green rectangle. Source data are provided as a Source Data file. b Representative images of D3.5 hPGCLCs validated by immunofluorescence staining following FACS purification from three independent experiments. The markers used for validation are indicated on each panel. Scale bar = 100 μm. Quantification based on manual counting of triple positive cells for the indicated markers. Each column represents the mean with SEM for four biological replicates. n = 1237 for H1, n = 736 for H9. DAPI was used as nuclear counterstain. Source data are provided as a Source Data file.
Tracking the trajectory and uniformity of PGCLC specification in vitro using single-cell RNA-sequencing
Next, we illuminated the stepwise changes in gene expression as hPSCs incipiently differentiated into posterior epiblast (D0.5) and then into PGCLC-containing populations (D3.5) by performing scRNA-seq32 of all these populations (Fig. 7a). scRNA-seq was important to detail the cellular diversity of this population and to obtain a refined and specific transcriptional signature only for the PGCLCs. As a negative control, we also performed scRNA-seq of D2 definitive endoderm29—a lineage derived from the PS (and thus, on a related but distinct lineage path from PGCs)—to clarify the relationship between human PGCs and endoderm, given that human PGCLCs reportedly express “endodermal” marker SOX176,7. Taken together, we analyzed 24,473 cells by scRNA-seq, with a median of >4000 genes detected per cell in each cell population (Fig. S6a).
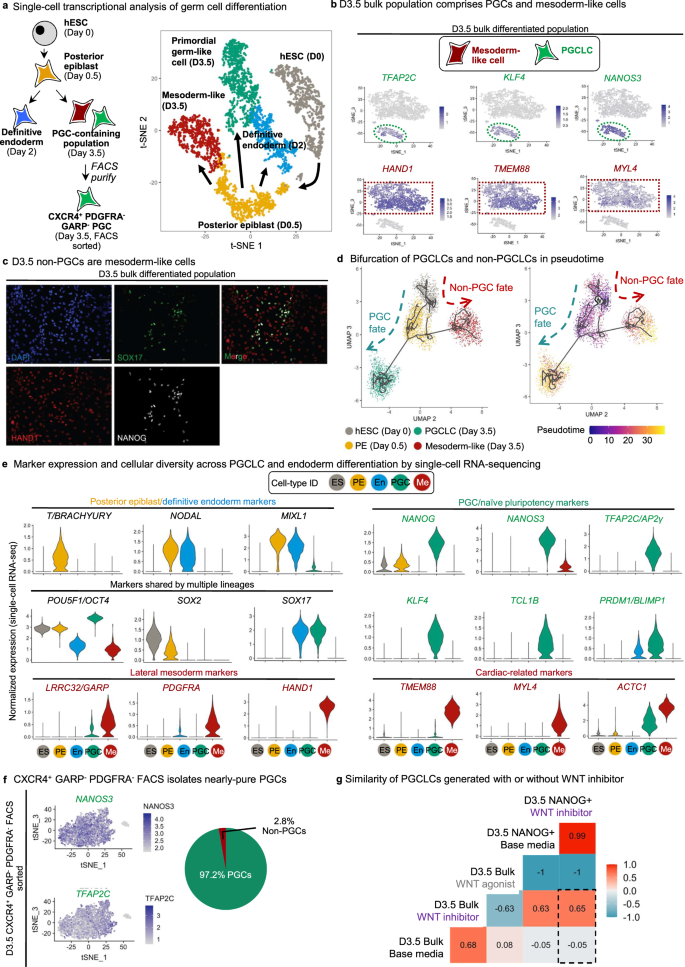
a Schematic of stages profiled for single-cell RNA-sequencing (scRNA-seq): D0 hPSCs, D0.5 posterior epiblast, D3.5 bulk population, D3.5 FACS-sorted CXCR4+/GARP−/PDGFRα− PGCLCs and D2 definitive endoderm (left); t-SNE projection of the combined scRNA-seq data sets, where single cells are colored by their cluster annotation (right). b t-SNE projection of hPSC-derived D3.5 bulk population shows that it is heterogeneous and segregates into 2 major clusters: a PGCLC cluster expressing PGC markers (TFAP2C, KLF4, NANOS3) and mesoderm-like cells (non-PGCLCs) expressing mesoderm markers (HAND1, TMEM88, MYL4). c Immunostaining of hPSC-derived D3.5 bulk population confirms that it is heterogeneous, comprising a mixture of PGCLCs (SOX17+, NANOG+) and non-PGCLCs (HAND1+) (nuclear counterstain: DAPI). Scale bar = 100 μm. Representative images from 4 independent experiments. d Pseudotemporal ordering of hESCs differentiating to PGCLCs or non-PGCLCs (mesoderm-like cells). e Violin plots of scRNA-seq data show expression of posterior epiblast, pluripotency, lateral mesoderm, cardiac, PGC, and naive pluripotency markers across the five different cell-types (clusters) identified from the combined scRNA-seq dataset (comprising merged D0, D0.5 posterior epiblast, D3.5 bulk, D3.5 FACS-sorted PGCLCs and definitive endoderm scRNA-seq datasets). f t-SNE projection of scRNA-seq data from hPSC-derived FACS-sorted D3.5 CXCR4+/GARP−/PDGFRα− PGCLCs shows that the predominant cluster express (comprising 97.2% of sorted cells) PGC markers (NANOS3 and TFAP2C). g Bulk RNA-seq of D3.5 FACS-sorted PGCLCs (generated with either XAV939 or base media) or D3.5 CHIR99021-treated populations (lacking PGCLCs). The Pearson correlation between these samples was calculated using median expression values of all expressed genes within all three biological replicates within each condition. Statistical test: Pearson correlation with 95% confidence interval.
scRNA-seq showed that the D3.5 bulk differentiated population was transcriptionally heterogeneous, comprising two major subsets (Fig. 7b). One subset comprised PGCLCs expressing NANOS3, TFAP2C, and KLF4 (Fig. 7b, Fig. S6c). Intriguingly, the non-PGCLCs expressed lateral mesoderm marker HAND1 and the cardiac mesoderm markers TMEM88, MYL4, and ACTC128,44 (Fig. 7b, e, Fig. S8c). This suggests that the “mis-differentiated”, non-PGCLCs at D3.5 are mesoderm-like cells, as evinced by HAND1 protein expression in the D3.5 non-PGCs (Fig. 7c). Indeed, the principal signals we used to differentiate posterior epiblast into PGCLCs (BMP activation and WNT inhibition) are the same ones that differentiate primitive streak into cardiac mesoderm28, suggesting that some cells on the wrong differentiation trajectory respond to these same signals to adopt mesoderm-like identity. Pseudotemporal ordering of cells45 from Day 0, Day 0.5, and Day 3.5 delineated two main trajectories, with one main branch leading to PGCLCs and another to the “mis-differentiated”, mesoderm-like non-PGCLCs (Fig. 7d, Fig. S7a, b). Key PGC markers NANOS3, NANOG, and TFAP2C were upregulated in the trajectory leading to PGCLCs, but not in the non-PGCLC trajectory (Fig. S7c). BMP4, IGF2, LEF1, and TCF4 were instead upregulated in the non-PGCLCs (Fig. S7c).
Integrated scRNA-seq analysis of all populations revealed the stepwise changes in gene expression as pluripotent cells segue into D0.5 posterior epiblast and, finally, D3.5 PGCLCs (Fig. 7, Fig. S7). Posterior epiblast markers BRACHYURY, MIXL1 and NODAL were transiently expressed at D0.5 (consistent with how posterior epiblast/primitive streak transcription factors are required for mammalian PGC specification10,11,24), but were subsequently downregulated in D3.5 PGCLCs (Fig. 7e). This is consistent with the observed “repression of somatic genes” in fully-formed PGCLCs23, although we note that these genes are nonetheless briefly expressed in their precursors (the posterior epiblast). Of note, D3.5 PGCLCs generated in our system did not express BRACHYURY (Fig. 7e), which is expressed by PGCLCs generated by other differentiation systems6,7,46. This may be explained by our inhibition of WNT signaling, as WNT is known to directly upregulate BRACHYURY expression47.
Our side-by-side comparison of PGCLCs and endoderm confirmed that they shared common markers SOX17 and PRDM16,7; however, D3.5 PGCLCs expressed multiple unique markers that were not found in endoderm, including NANOG, NANOS3, TFAP2C, KLF4, and TCL1B (Fig. 7e, Fig. S7c), thus disclosing a single-cell transcriptional signature for hPSC-derived PGCLCs.
CXCR4+ PDGFRα− GARP− cells are transcriptionally highly enriched for PGCLCs
To overcome the population heterogeneity evident at D3.5 of differentiation (Fig. 7b and Fig. S8), we asked whether our cell-surface markers (CXCR4+ PDGFRα− GARP−) could enable the purification of nearly homogeneous PGCLCs. While past combinations of cell-surface markers could isolate PGCLCs that were enriched for NANOS3, PRDM1, and TFAP2C expression6,7, we surmised that single-cell RNA-seq of FACS-sorted PGCLCs would rigorously assess whether they were truly homogeneous at the transcriptome-wide level. scRNA-seq of FACS-sorted CXCR4+ PDGFRα− GARP− D3.5 PGCLCs revealed four subsets: three subsets comprised PGCLCs, cumulatively accounting for 97.2% of the total population (Fig. 7f, Fig. S8a–c). These three PGCLC subsets expressed similar levels of archetypic PGC markers (e.g., NANOG), but could be distinguished by cell cycle genes and higher expression of TFAP2A and EDN1 in a small subset of PGCLCs (Fig. S8a–d). The remaining 2.8% of cells were PDGFRα+ mesoderm-like cells, likely owing to imperfect FACS sorting for CXCR4+ PDGFRα− GARP− cells (Fig. 7f, Fig. S8a–d). This result thus reaffirms the power of our cell-surface marker profile to precisely isolate PGCLCs from a heterogeneous cell population, thus opening the door to downstream functional and molecular analyses of purified PGCLCs.
To assess if the PGCLCs derived with (XAV939) and without WNT inhibition (“base media”) were transcriptionally similar, we performed bulk RNA-seq of FACS-purified NANOG + CXCR4+ PGCLCs vs. NANOG-CXCR4- non-PGCLCs obtained from both conditions. Pearson correlation analysis revealed high correlation between PGCLCs derived from both conditions, with few differentially expressed genes (Fig. 7g, Fig. S2b, c, e, f, Supplementary Data 5). Thus, although the efficiency of PGCLC differentiation differs with and without WNT inhibition, the PGCLCs obtained from both conditions were transcriptionally similar.
NANOG is continuously expressed in the transition from pluripotency to PGCLCs
We then investigated expression of pluripotency markers during germline differentiation: a quintessential feature of early germ cells (unlike most somatic cell types) is that they express pluripotency transcription factors 23,26. The prevailing model is that upon early differentiation, pluripotent cells initially downregulate pluripotency factors, but subsequently only cells allocated to the germline “re-express” pluripotency factors23,26 (Fig. 8ai). By contrast, recent observations of cynomolgus macaque embryos suggested that NANOG is continuously expressed as PGCs incipiently arise from their precursors (Fig. 8ai), inferred from fixed embryos spanning different timepoints25. However, similar observations have been precluded in human embryos, as the pertinent developmental stages remain inaccessible.
To assess which of the two models may pertain to human PGCLCs, we computationally ordered differentiating cells in our scRNA-seq dataset along an inferred “pseudotime”48, and observed that POU5F1 and NANOG were continuously expressed during the transition from pluripotency to posterior epiblast to hPGCLCs (Fig. 8aii, Fig. S7c). This thus implies continuous expression of pluripotency factors in the transition from pluripotency to germline fate. We sought to experimentally validate this prediction by tracking NANOG expression at the single-cell level. To this end, we engineered NANOG-2A-YFP reporter hESCs, using Cas9/AAV6 genome editing49 to insert a 2A-YFP reporter immediately downstream of the NANOG gene without disrupting its coding sequence50.
NANOG was continuously expressed during the hPSC-to-germline transition, without evidence for NANOG downregulation followed by re-expression (Fig. 8b, Fig. S9a). Undifferentiated hPSCs, D0.5 posterior epiblast cells, and D1.5 cells were largely NANOG+ CXCR4− (Fig. S9a). By D2.5-D3.5, a subpopulation continued to express NANOG but gained CXCR4, thus transitioning to NANOG+ CXCR4+ PGCLCs (Fig. 8b, Fig. S9a). By contrast, by D2.5-D3.5, other cells lost NANOG, thus differentiating into NANOG− CXCR4− non-PGCLCs (Fig. 8b, Fig. S9a). We independently confirmed these results, by using intracellular flow cytometry and immunostaining to directly stain for NANOG protein itself (Fig. 8c, Fig. S9b). D0 hPSCs and D0.5 posterior epiblast cells were NANOG+ OCT4+, but at D1.5, some NANOG+ OCT4+ cells began to co-express the PGC transcription factor SOX17 (Fig. 8c, Fig. S9c).
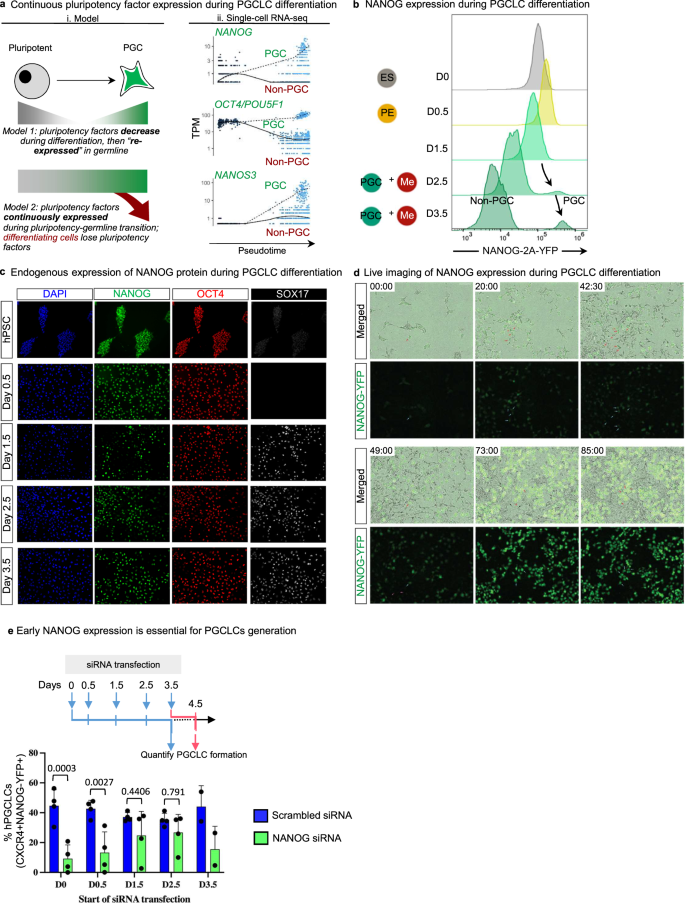
a (i) Current models for pluripotency factor expression; (ii) Pseudotemporal analysis of single-cell RNA-seq trajectories indicates continuous expression of NANOG and OCT4. b Flow cytometry analysis of H9 NANOG-YFP hESCs shows homogeneous YFP expression at D0, D0.5, and D1.5, with a separate YFP-high PGCLC population distinguishable at D2.5 and D3.5. n = 2 biological replicates. Source data are provided as a Source Data file. c Immunostaining of endogenous NANOG, OCT4, and SOX17 protein expression in H9 hESCs from D0 to D3.5 of PGCLC differentiation. Scale bar = 100 μm. Representative images from three independent experiments. d Live imaging analysis of H9 NANOG-YFP hESCs differentiating to PGCLCs at the indicated timepoints Scale bar = 100 μm. Representative images from three independent experiments. e Quantification of PGCLC differentiation efficiencies after NANOG siRNA knockdown at different timepoints during differentiation. Data are presented as mean values ± SEM. n = 4 biological replicates/group for all timepoints except for d3.5 where n = 2 biological replicates. Statistical test: two-way ANOVA with Šídák multiple test correction. Adjusted P values are shown above error bars. Source data are provided as a Source Data file.
We then rigorously tested that NANOG is continuously expressed from pluripotency to germline fate through a continuous means of measurement: live imaging. Live imaging of NANOG-2A-YFP reporter hESCs showed that undifferentiated hPSCs were NANOG+, and during PGCLC differentiation, a subset of cells progressively expressed higher levels of NANOG (Fig. 8d, Movie S1). Other cells instead lost NANOG expression, becoming non-PGCLCs (Fig. 8d, Movie S1).
Therefore, as NANOG+ pluripotent cells differentiate into NANOG+ posterior epiblast, differentiating cells that “inherit” pluripotency factor expression from the posterior epiblast may progress forth to the germline through, at least in part, the inhibition of WNT signaling. Continued NANOG expression may thus serve as a bridge to link the pluripotent and PGC states. This mirrors staining analyses of cynomolgus macaque embryos25, and remains to be substantiated in other species.
Finally, we sought to understand if the continuous expression of NANOG was functionally important to generate human PGCLCs. We therefore performed siRNA knockdown of NANOG in NANOG-2A-YFP reporter hESCs at different stages of differentiation (Fig. 8e) and verified NANOG knockdown by qPCR (Fig. S9d). NANOG knockdown at either D0 or D0.5 markedly decreased PGCLC formation by ~3–5-fold (Fig. 8e), reaffirming the importance of NANOG expression in posterior epiblast intermediates for subsequent PGCLC formation. Taken together, this suggests that the continuous expression of NANOG in cells transitioning from pluripotent state to PGCLCs is functionally important.
Single-cell RNA-seq analysis shows that in vitro-derived PGCLCs have transcriptional similarities with in vivo-derived human fetal PGCs
Finally, we used scRNA-seq to determine whether hPSC-derived PGCLCs resemble bona fide PGCs within the human fetus. Past work affirmed similarities between human PGCLCs and PGCs using bulk-population RNA-seq7 but did not acquire single-cell resolution. Another study used scRNA-seq to compare human PGCLCs and cynomolgus macaque PGCs16, but did not compare them against human fetal PGCs.
A published scRNA-seq analysis of >2000 fetal germ cells (FGCs, including a subset of PGCs) from week 5-26 human fetuses51 laid a foundation for assessing the identity of in vitro-derived PGCLCs since it offers a comprehensive roadmap for germ cell development in vivo under physiological conditions. In that study, human FGCs were classified into four sequential subsets characterized by mitosis, retinoid signaling, meiotic prophase, and oogenesis (termed FGC1 to FGC4, respectively)51 (Fig. S10a–c). We compared human FGCs, along with fetal gonad somatic cells51, against our hPSC-derived D3.5 PGCLCs (Fig. 9).
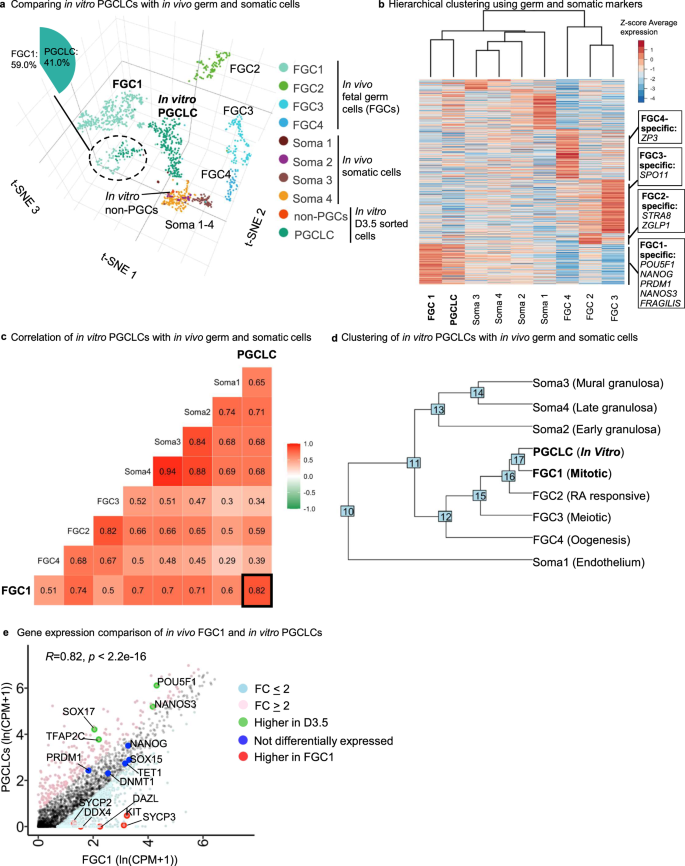
a 3D integrated clustering of human female fetal germ cells clusters (FGC1-4) and somatic cells clusters (Soma1-4) with in vitro Day 3.5 sorted PGCLCs and non-PGCs with tSNE1, tSNE2, and tSNE3 dimensions. Of note, the FGC1 group clusters together with PGCLCs (dotted circle). b Supervised hierarchical clustering of in vivo human female fetal germ cells clusters (FGC1-4) and in vitro PGCLCs using germ cells and somatic cell-specific genes (2543 genes). c Pearson correlation analysis of in vivo human female fetal germ cells clusters (FGC1-4), in vivo somatic cells clusters, and Day 3.5 sorted in vitro PGCLCs. d Hierarchical clustering of in vivo human female fetal germ cells clusters (FGC1-4), in vivo somatic cells clusters, and in vitro PGCLCs, using all variable genes as input for the analysis. e Gene expression comparison between in vivo female fetal FGC1 and in vitro PGCLCs. Statistical test–Pearson correlation, 95% confidence interval (two-tailed), p < 2.2e-16.
Hierarchical clustering revealed that hPSC-derived PGCLCs were the most similar to FGC1, which represents early-stage PGCs (Fig. 9a–c). hPSC-derived PGCLCs and FGC1 both expressed pluripotency genes including POU5F1 and NANOG, as well as PGC-specific markers such as NANOS3, SOX17, PRDM1 and TFAP2C (Fig. S10b). By contrast, such pluripotency and PGCs markers were turned off in later-stage FGC2, FGC3, or FGC4 populations, consistent with exit from a PGC state in vivo (Fig. S10b). hPSC-derived PGCLCs appeared to represent an early PGC population, as they did not express markers of differentiating germline cells (e.g., those involved in retinoid signaling, oogenesis, or meiosis), which instead were expressed in FGC2, FGC3 or FGC4 (Fig. S10b). While PGCLCs most closely resembled FGC1 (Pearson correlation of R = 0.82), it is not possible to access human pre-migratory PGCs at earlier developmental stages51, and it is thus possible that PGCLCs may correspond to even earlier-stage PGCs (Fig. 9c–e). Clustering, differential gene expression analysis, and gene ontology analysis revealed that PGCLCs that did not co-cluster with the rest of the FGC1 population were higher in mitochondrial gene expression and were enriched for genes linked to protein translation and cell-cell adhesion (Fig. S10d, e). By contrast, FGC1 cells that did not co-cluster with PGCLCs were enriched for cell cycle genes (Fig. S10d).
We also transcriptionally compared our hPSC-derived PGCLCs generated in monolayer culture with WNT inhibitor with previously published PGCLCs generated in the prevailing 3D differentiation system6,16 (Fig. S11a–g). Our analysis revealed that 20% of 3D-derived PGCLCs were highly similar to PGCLCs derived from our monolayer protocol (Pearson correlation of r = 0.91) (Fig. S11c, d, f). Differential gene expression analysis between our monolayer PGCLCs and previously published PGCLCs in 3D16 showed higher expression of several PGC markers (NANOS3, TFAP2C, and SOX17), and gene ontology analysis revealed enrichment of cell adhesion, cell redox, and glycolytic processes, in monolayer PGCLCs (Fig. S11f, g and Supplementary Data 3).
Taken together, this shows transcriptome-wide similarities between hPSC-derived PGCLCs in vitro and human fetal PGCs in vivo. hPSC-derived PGCLCs apparently represent an early PGC population prior to the initiation of germline differentiation and meiosis. Finally, our monolayer PGCLCs are transcriptionally similar to PGCLCs derived by the prevailing 3D differentiation protocol.
- SEO Powered Content & PR Distribution. Get Amplified Today.
- PlatoData.Network Vertical Generative Ai. Empower Yourself. Access Here.
- PlatoAiStream. Web3 Intelligence. Knowledge Amplified. Access Here.
- PlatoESG. Automotive / EVs, Carbon, CleanTech, Energy, Environment, Solar, Waste Management. Access Here.
- PlatoHealth. Biotech and Clinical Trials Intelligence. Access Here.
- ChartPrime. Elevate your Trading Game with ChartPrime. Access Here.
- BlockOffsets. Modernizing Environmental Offset Ownership. Access Here.
- Source: https://www.nature.com/articles/s41467-023-41302-w