Mcam as a potential regulator of MECs by GeCKO screening
To identify potential regulatory factors of MECs, we performed clone formation assay24 and transplantation assay25,26 for screening using a pooled mouse GeCKO library containing 130 209 single guide RNAs (sgRNAs), targeting 20 611 protein-coding genes, and 1000 control sgRNAs (non-targeting sgRNAs) in the mouse genome27. The mammary progenitor-enriched population was isolated using standard protocols24 and transduced with a lentivirus prepared by the GeCKO library. Multiplicity of infection (MOI) was tested and applied to ensure that each cell contained a single sgRNA. The non-transfected cells were screened out by puromycin. After 10-14 days, we selected large clones (diameter ≫ 100 μm, enriched with mammary progenitor cells) for deep sequencing. The stably transfected cells were used for a 5-week transplantation assay, and the regenerated mammary tissues were collected for deep sequencing (Fig. 1a). Thus, based on the above methods, we performed gene enrichment of representative sgRNAs from plasmids, stably transfected cells, large clones, and regenerated mammary tissues.
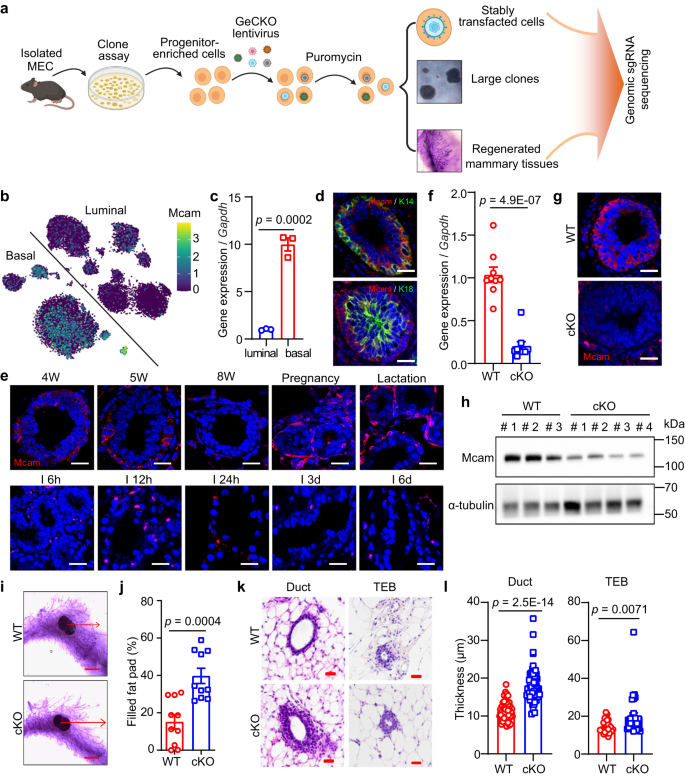
a Schematic of screening strategy. Created with BioRender.com. b tSNE plot showing expression pattern of Mcam in different lineages according to single-cell sequencing data29. c qRT-PCR analysis of Mcam mRNA expression in different subpopulations of MECs shown in Figs. Sa-3b. n = 3 biological replicates. d Immunofluorescence (IF) images of Mcam co-stained with basal marker K14 and luminal marker K18. Nuclei were stained in blue by DAPI. Scale bar, 20 μm. e IF images of Mcam staining at various developmental stages of mammary gland. 4 W, 4-week old; I, involution. Scale bar, 20 μm. Representative images were taken from 3 mice for each stage. f qRT-PCR analysis of Mcam mRNA expression in MECs from WT and cKO mice by MMTV-Cre. n = 9 mice per genotype. g IF staining showing knockout efficiency of Mcam in WT and cKO mice. Scale bar, 20 μm. h Western blotting showing Mcam protein expression in WT and cKO mammary tissues. 3 mice for WT group and 4 mice for cKO group. i, j Representative images (i) and their quantification (j) of mammary duct extension of whole-mount staining in WT and cKO mice at 5 weeks of age. Arrow, length of epithelial extension. Scale bar, 5 mm. n = 10 mice in each group. k Representative images of mammary tissues in 5-week-old WT and cKO mice by H&E staining. Scale bar, 20 μm. l Quantification of mammary duct and TEB thickness in WT and cKO mice. n = 50 ducts or n = 30 TEBs in WT and cKO mice. Data are means ± SEM. Two-sided Student’s t test was used to evaluate statistical significance. Source data are provided as a Source Data file.
For sequencing, we first compared the overall distributions of sgRNAs from all samples to demonstrate the dynamics of the sgRNA library (Fig. S1a) and validate the sequencing quality. The detected number of sgRNAs in the plasmids was close to that in the original library, showing that most sgRNAs in the library were represented (Figs. S1b and S1c). The sgRNAs in the large clones and regenerated mammary tissues, retained less sgRNAs, reflecting that sgRNAs were enriched in these samples. The global patterns of sgRNA distribution in different samples were distinct, as evident by the strong shifts in respective cumulative distribution functions (Fig. S1d). In addition, we compiled a list of genes (Supplementary Dataset 1) showing enrichment of 1, 2, or 3 or more sgRNAs, along with the proportion of samples where these genes demonstrated enrichment (Fig. S1e). Based on MAGeCK28 (http://bitbucket.org/liulab/mageck-vispr), we obtained a candidate gene list properly accounted for mammary gland morphogenesis and/or MEC clonogenicity and regenerative capacity, and found Mcam was one of the common genes in all conditions (Fig. S2a). By further analysis, we found multiple sgRNAs targeting Mcam are significantly enriched in more than half of the regenerated mammary tissue (Fig. S2b) with two or more sgRNAs targeting Mcam enriched in each sample (Fig. S2c).
The candidates were selected according to the expression profile based on single-cell sequencing data of MECs29, and sgRNAs ranked in each sample. The single-cell sequencing data showed that Mcam was highly expressed in basal cells (Fig. 1b). To validate this result, we collected basal (Lin−CD24+CD29+) and luminal (Lin−CD24+CD29−) cell populations using fluorescence-activated cell sorting (FACS) (Fig. S3a, b), with quantitative real-time polymerase chain reaction (qRT-PCR) confirming the high expression of Mcam in the basal cell population (Fig. 1c). Immunofluorescence (IF) staining showed that Mcam was co-localized with K14 (basal cell marker) but not with K18 (luminal cell marker) (Fig. 1d). Taken together, Mcam was identified as a potential key regulator of MECs.
Loss of Mcam enhances mammary gland development
To further investigate the role of Mcam in regulating MEC proliferation and mammary gland development in vivo, we firstly examined Mcam expression pattern in four stages of mammary gland development, and found Mcam highly expressed in puberty (4-5 weeks), pregnancy, and lactation (Fig. 1e). Then we bred Mcam flox mice30 with MMTV-Cre mice to generated Mcamfl/fl/MMTV-Cre mice (cKO mice)31 and K14-Cre mice to generate Mcamfl/wt/K14-Cre mice (heterozygous cKO mice) with specific loss of Mcam in MECs or basal cells. Mcam was specifically depleted in MECs or basal cells based on qRT-PCR (Figs. 1f and S3c), IF staining (Figs. 1g and S3d), and western blot analysis (Figs. 1h and S3e) of whole mammary tissues. We next explored the mammary duct phenotype. Loss of Mcam significantly lengthened mammary ducts at the puberty stage (5-weeks old), and therefore increased mammary duct occupation in the fat pad (Figs. 1i, j and S3f, g). In addition to ductal length, mammary duct and terminal end bud (TEB) thickness increased significantly (Figs. 1k, l and S3h–j). The above effects were not observed in adult mice (8-weeks old) (Fig. S3k), which could be due to rare expression level of Mcam at this period (Fig. 1e).
These results showed that Mcam loss enhances mammary gland development, and this phenotype is likely due to increased proliferation and differentiation of the mammary epithelium. Based on IF staining with Ki67 (cell proliferation marker), both basal and luminal cells demonstrated a much higher percentage of Ki67-positive cells upon loss of Mcam (Figs. 2a, b and S4a–e), which is also supported by the enrichment of DNA replication pathway in cKO mice based on RNA-seq data (Fig. S4f). All cell differentiation markers, including Stat5, Elf5, Foxa1, Esr1, and Gata332, were increased at the mRNA level (Fig. S4g). Immunohistochemistry (IHC) staining showed PR– and PR+ cells occurred in cKO mice by MMTV-Cre, implying Mcam loss promoting cell differentiation (Fig. S4h). The induction of both cell proliferation and differentiation suggests that loss of Mcam enhances mammary duct morphogenesis.
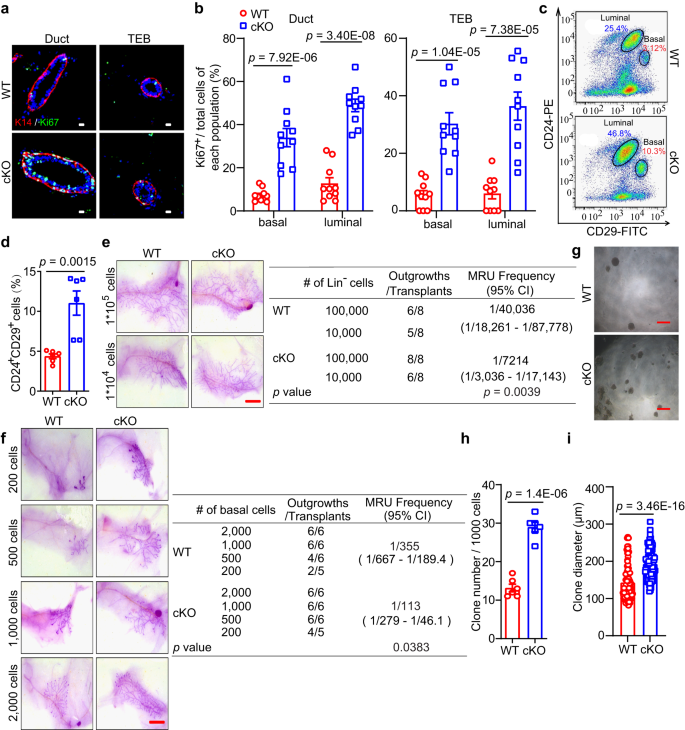
a Immunostaining of K14 (red) and Ki67 (green) expression in mammary ducts and TEBs of WT and cKO mice by MMTV-Cre. Scale bar, 10 μm. b Ki67+ cells in basal and luminal cell populations of mammary ducts and TEBs in WT and cKO mice. n = 10 sections in each group. c, d FACS analysis (c) and statistical ratios of basal cell population (Lin−CD24+CD29+) and luminal cell population (Lin−CD24+CD29–) (d) in WT and cKO mice. n = 6 mice for each genotype. e Representative images (left) and the reconstitution efficiency at limiting dilution (right) of whole-mount-stained mammary outgrowths derived from transplantation of isolating WT or cKO Lin– cells and harvested at 6 weeks after transplantation. Scale bar, 5 mm. n = 8 mice for each group. f Representative images (left) and the reconstitution efficiency at limiting dilution (right) of whole-mount-stained mammary outgrowths derived from transplantation of WT or cKO basal cells and harvested at 6 weeks after transplantation. Scale bar, 5 mm. n = 5 in 200-cell of cKO group, n = 6 mice in the other groups. g–i Representative images (g), clone numbers (h, n = 6 biological replicates), and clone diameters (i, n = 93 for WT and n = 125 for cKO by MMTV-Cre) of colonies formed by MECs derived from WT and cKO mice. Scale bar, 500 μm. Data are means ± SEM. Two-sided Student’s t test was used to evaluate statistical significance. Source data are provided as a Source Data file.
Loss of Mcam promotes the regeneration of mammary gland
To investigate whether the above phenotype is driven by MaSCs, we explored changes in the MaSC-enriched cell population (Lin−CD24+CD29+) in cKO mice by MMTV-Cre. Compared to wild-type (WT) mice, the cKO mice exhibited a three-fold higher basal population (Figs. 2c, d and S5a, b), indicating that Mcam loss induces the basal cell compartment containing MaSCs. In addition, we examined the expression of stemness-related genes including Procr, K14, Lgr5, and sSHIP in basal cells derived from the mammary tissues of WT and cKO mice, and found these genes highly expressed in Mcam cKO mice (Fig. S5c), supporting the potential regulatory roles of Mcam for MaSCs.
To determine whether Mcam negatively regulates MaSC function in vivo, we carried out limiting-dilution transplantation assays in non-obese diabetic/severe combined immunodeficiency (NOD/SCID) mice using isolated Lin– epithelial cells and basal population, primary MECs, respectively. All isolated Lin– epithelial cells and basal cells (regenerated mammary tissues were harvested at 6 weeks after transplantation), primary MECs (regenerated mammary tissues were harvested at 5 weeks after transplantation) from cKO mice displayed a significantly higher rate of successful engraftment and more extensive mammary outgrowth than the WT cells (Figs. 2e, f and S5d). To illustrate whether Mcam directly regulates the MEC clonogenicity, we performed an in vitro clone assay using primary MECs (Figs. 2g–i and S5e–g). Mcam depletion significantly increased the numbers and diameters of colonies, representing MEC clonogenicity and proliferation ability. Moreover, Mcam was knocked down using a lentivirus (Fig. S5h) to explore its function in primary cultured MECs in vivo and in vitro. In the transplantation assay, knockdown of Mcam significantly improved the regenerative capacity of MECs to reconstruct whole mammary tissue (Fig. S5i). In the clone assay, both clone numbers and diameters increased (Fig. S5j–m), suggesting loss of Mcam promotes MEC proliferation. These results provide strong evidences for the Mcam roles in inhibiting MEC proliferation and mammary reconstruction.
Knockout of Mcam promotes macrophage recruitment
To identify the regulatory mechanism underlying the promotion function of MEC proliferation and mammary gland development in cKO mice by MMTV-Cre, RNA-sequencing (RNA-seq) was performed on mammary tissues from 5-week-old WT and cKO mice. First, we analyzed the differentially expressed genes (DEGs) identified between WT and cKO mammary tissues (total breast cells) (Fig. S6a) and performed Gene Ontology (GO) and Kyoto Encyclopedia of Genes and Genomes (KEGG) pathway enrichment analysis of upregulated DEGs in cKO mammary tissues. Results indicated strong activation of pathways associated with immune regulation (Fig. 3a). Notably, the DEGs were significantly enriched in the GO categories “immune system process” and “immune response” (Supplementary Dataset 2) and in the KEGG pathways “activation of innate immune response”, “regulation of immune effector process”, and “adaptive immune response” (Fig. 3a). Immune cells are key components of the mammary microenvironment33, therefore, we analyzed the abundance of various immune cells in WT and cKO mammary tissues using FACS.
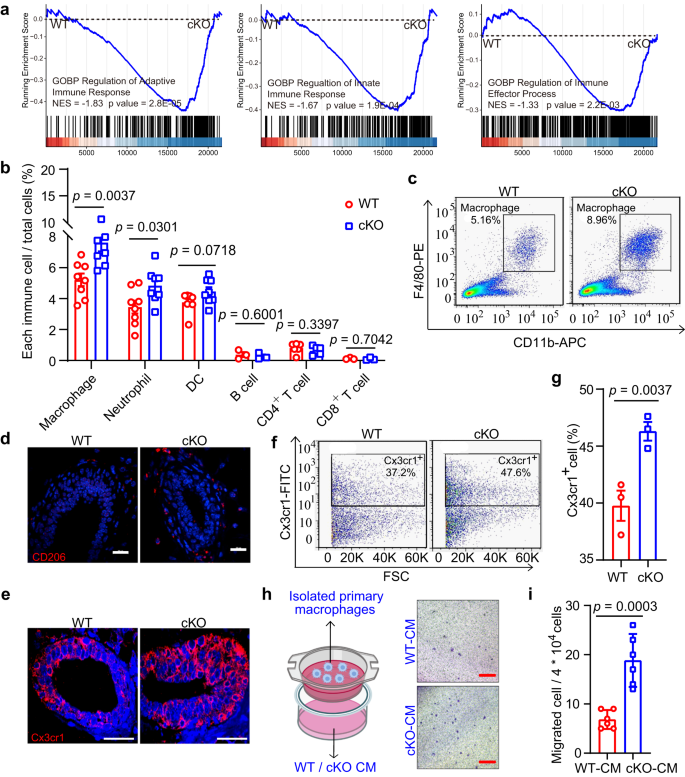
a GSEA of enriched immune response signatures using total mammary cells in cKO mice by MMTV-Cre compared with WT mice. NES, normalized enrichment score. b Percentages of various immune cell populations in WT and cKO mice by FACS analysis. n = 8 mice for macrophages, neutrophils, and DCs, 3 mice for B cells and CD8+ T cells, and 6 mice for CD4+ T cells. c FACS analysis of macrophage population (F4/80+CD11b+) in WT and cKO mice. d, e IF images of CD206+ (d) and Cx3cr1+ (e) macrophages in WT and cKO mammary sections. Scale bar, 20 μm. f, g FACS analysis (f) and their percentage quantification (g) of macrophages in mammary tissues of WT and cKO mice. n = 3 mice in each group. h, i Schematic of co-culture assay and representative images (h) (The left panel was created with BioRender.com.), and quantification (i) of migrating macrophages after WT and cKO CM treatment. Isolated macrophages by FACS in upper chamber were co-cultured with CM from WT and cKO primary MECs in lower chamber. CM, conditional medium. n = 6 biological replicates. Scale bar, 200 μm. Data are means ± SEM. Two-sided Student’s t test was used to evaluate statistical significance. Source data are provided as a Source Data file.
Data showed a significant increase in the abundances of macrophages and neutrophils in cKO mice, but not of dendritic cells (DC), B cells, or T cells (Figs. 3b and S6b). Furthermore, using macrophage markers (F4/80 and CD11b), macrophages showed consistent and strong elevation in the Mcam cKO mice (Figs. 3c and S6c), implying that macrophages play important roles in Mcam cKO mice. In addition to stromal macrophages, tissue-resident ductal macrophages are also found in the mammary gland epithelium34. Thus, we explored changes in both types of macrophages in the mammary gland using CD206 (stromal macrophage marker)35 and Cx3cr1 (tissue-resident macrophage marker)34. Data showed that both cell populations were significantly elevated (Figs. 3d–g and S7a–d). To further validate macrophages indeed were recruited by MECs, isolated primary macrophages and macrophage cell line RAW264.7 were co-cultured with conditional medium (CM) from either WT or cKO MECs by MMTV-Cre. Compared with WT-CM treatment, cKO-CM induced more macrophages migration (Fig. 3h, i and S7e, f). Thus, depletion of Mcam in the mammary tissue leads to an increase in macrophages.
Depletion of macrophages blocks the elevating activity of MECs upon Mcam loss
As macrophages can maintain MaSC stemness36, we mixed macrophages with basal cells from WT or cKO mice by MMTV-Cre to implement a co-culture mammosphere assay for confirming Mcam roles on the clonogenicity promotion by macrophages. After co-culturing with isolated primary macrophages for 10-14 days, clone numbers and clone diameters increased significantly in the basal cells of cKO mice (Fig. 4a–c). To confirm the mediating roles of macrophages in the above function, we performed rescue assays using clodronate liposome (CL) to specifically deplete macrophages in both WT and cKO mice37. After injection of CL, the percentages of macrophages in WT and cKO mice were effectively reduced, as shown by FACS analysis (Figs. 4d and S8a), as was the percentages in the spleen (Fig. S8b, c), a macrophage-enriched organ.
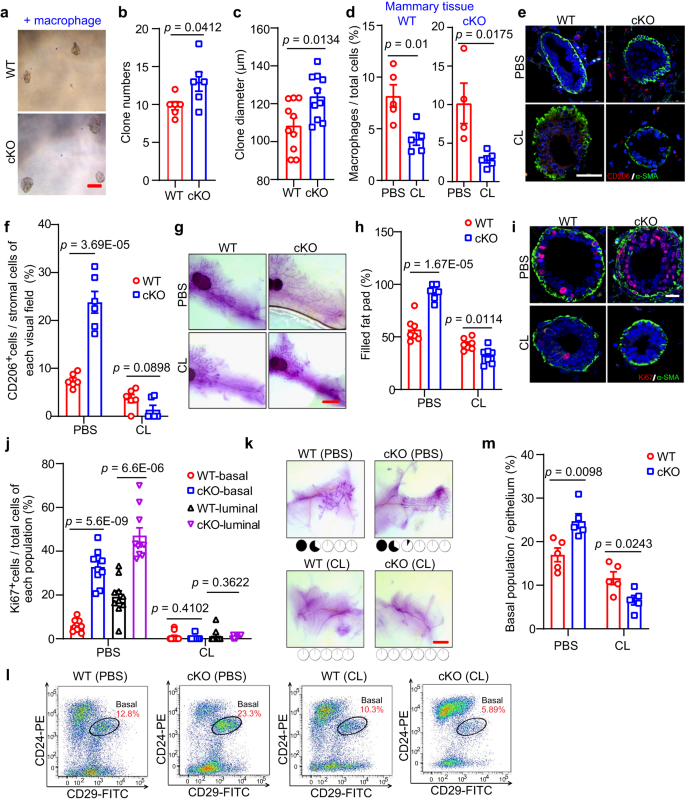
a–c Representative images (a), clone numbers (b, 6 biological replicates in WT and 5 biological replicates in cKO by MMTV-Cre), and clone diameters (c, n = 10 in each group) of colonies formed by basal cells co-cultured with isolated macrophages. Scale bar, 100 μm. d Percentages of macrophages in mammary tissue of WT and cKO mice treated with clodronate liposome (CL) and their control groups (PBS). n = 5 mice in each group of WT. For cKO, n = 4 mice by PBS treatment, and n = 5 mice by CL treatment. e, f IF images of CD206+ macrophages and α-SMA+ basal cells (e) and quantification of CD206+ macrophages in stromal cells (f) in WT and cKO mice with or without CL treatment. n = 6 sections in each group. Scale bar, 50 μm. g, h Representative images (g) and quantification (h) of the filled fat pad by the mammary duct of the whole-mount-stained mammary gland. Scale bar, 5 mm. n = 7 mice in each group. i, j IF images (i) and their quantification (j) of Ki67+ proliferation cells and α-SMA+ basal cells. n = 10 sections in each group. Scale bar, 20 μm. k Representative images of whole-mount-stained mammary outgrowths derived from transplantation of WT and cKO MECs mixed with PBS or CL. The number of MECs for transplantation was 1*104. The dose of CL (90–125 μl) was determined according to the body weight (~9–12.5 g) of the mice, and PBS had the same volume as CL. Scale bar, 3 mm. l, m FACS analysis (l) and quantification (m) of basal population. n = 5 mice in each group. Mice used in figures d–m were treated with CL (150–170 μl) at 5 weeks of age (body weight ~15–17 g) every other day for a week before harvesting the mammary gland. Data are means ± SEM. Two-sided Student’s t test was used to evaluate statistical significance. Source data are provided as a Source Data file.
We next determined the abundance of CD206+ macrophages in the mammary tissues after CL treatment and found that the elevating CD206+ signals upon Mcam loss were diminished completely (Fig. 4e, f). Based on whole-mount staining, while Mcam cKO promoted mammary duct elongation within the fat pad (Fig. 1i), CL treatment eliminated these promotion effects (Figs. 4g, h and S8d). To further investigate the inhibitory effects of mammary morphogenesis after CL treatment, we determined the proliferation of MECs, from the IF (Fig. 4i, j) and IHC (Fig. S8e) staining results, both the elevating proliferation in basal and luminal cells by Mcam loss were flattened significantly after CL treatment, further indicating that amplification of both MEC lineages after Mcam loss was dependent on macrophages.
We next isolated and transplanted MECs from WT and cKO mice by MMTV-Cre into NOD/SCID mice to examine the repopulating ability of MECs. The MECs were mixed with CL to remove migrated macrophages, as performed in previous research36. While loss of Mcam increased the frequencies of MEC reconstitution (Fig. 2), we observed nearly complete inhibition of reconstitution in the fat pad when MECs were injected together with CL (Fig. 4k), suggesting that the promotion of MEC regenerative capacity upon Mcam cKO depends on the presence of macrophages. To further investigate the inhibitory effects of MaSCs after CL treatment, we determined the basal cell population percentages using FACS and found that systemic ablation of macrophages reversed the increase in Lin–CD24+CD29+ cell abundance in cKO mice (Figs. 4l–m and S8f), suggesting that CL treatment rescued MaSC proliferation by Mcam loss. Taken together, these findings suggest that Mcam roles on clonogenicity, regeneration, and ductal morphogenesis of mammary glands are dependent on macrophages.
Mcam recruits and activates macrophages through Il4-Stat6 axis
We next examined the molecular mechanism underpinning communications between macrophages and MECs. As macrophages were enriched by Mcam cKO (Fig. 3), we explored how the increased macrophages was recruited. Based on the RNA-seq DEGs (Fig. S6a), cytokines and chemokines increased in the cKO mammary tissues (Fig. 5a). The qRT-PCR results demonstrated that Il4 was the most significantly elevated factors upon Mcam KO by both MMTV-Cre and K14-Cre (Figs. 5b and S9a). Il4 and Il13, which are secreted by MECs38, and downstream Stat6 are essential for promoting macrophage polarization and activation39,40. Here, we found that Stat6 phosphorylation levels increased significantly in cKO mice (Figs. 5c and S9b), suggesting that Il4-Stat6 may mediate the role of Mcam in macrophages. To further validate this result, we blocked Il4 by its antibody in vitro and in vivo to examine macrophage migration. Blocking Il4 in vitro reversed the elevated macrophage migration upon Mcam loss (Fig. 5d, e). After injecting with Il4 blocking antibody orthotopically, we found the same rescue effects for CD206+ and Cx3cr1+ macrophages abundance (Fig. 5f–i), which leads to the inhibition of ductal elongation in Mcam cKO mice by MMTV-Cre ultimately (Fig. 5j, k). These data demonstrate Mcam roles for recruiting macrophages through Il4-Stat6 axis.
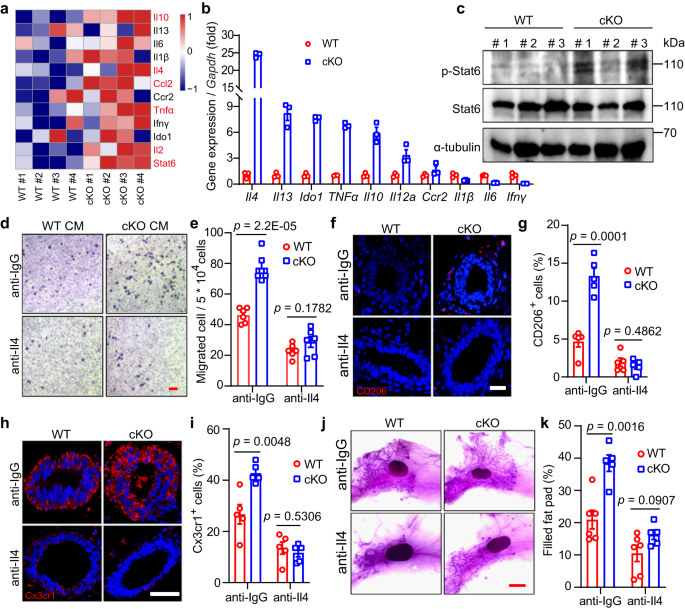
a Heat map showing differentially expressed cytokine genes based on RNA-seq data in cKO mice by MMTV-Cre compared with WT mice. Differentialy expressed genes are labelled in red. b qRT-PCR analysis of expression levels of cytokines in MECs from WT and cKO mice. n = 3 biological replicates in each group. c Western blotting showing Stat6 and p-Stat6 levels in WT and cKO mammary tissues. n = 3 mice in each groups. d, e Representative images (d) and their quantification (e) of migrated primary macrophages incubated with Il4 antibodies or their control (anti-IgG) after treatment with conditional medium (CM) of WT or cKO MECs. n = 6 biological replicates in each group. Scale bar, 100 μm. f, g IF images of CD206+ macrophages (f) and their statistical results of CD206+ macrophages (g) in WT and Mcam cKO mammary tissues treated with IgG or Il4 antibodies. WT and cKO Mice were treated with IgG (10 μl) or Il4 antibodies (10 μl) orthotopically at 5 weeks of age every other day for a week before harvesting the mammary tissue. Scale bar, 20 μm. n = 3 mice were treated for each groups. 5 fields in each sample for statistics. h, i IF images of Cx3cr1+ macrophages (h) and their statistical results (i) in WT and Mcam cKO mammary tissues treated with IgG or Il4 antibodies. Scale bar, 50 μm. 3 mice were treated in each group. 5 fields in each sample for statistics. j, k Representative images (j) and quantification of filled fat pad (k) of whole-mount-stained mammary tissues in WT and cKO mice treated with IgG or Il4 antibodies. n = 6 in WT group and n = 5 in cKO group. Scale bar, 5 mm. WT and cKO Mice in Figure h–k were treated with IgG (10 μl) or Il4 antibodies (10 μl) orthotopically at 5 weeks of age every other day for a week before harvesting the mammary gland. Data are means ± SEM. Two-sided Student’s t test was used to evaluate statistical significance. Source data are provided as a Source Data file.
Macrophages regulate MECs through non-canonical Wnt signaling upon Mcam loss
We also investigated the mechanism underlying the role of macrophages within mammary tissues. Previous reports have shown that macrophages play critical roles in MaSCs36. Based on gene set enrichment analysis (GSEA) of RNA-seq data, the gene cluster, canonical Wnt signaling pathway, showed no significant difference between WT and Mcam cKO mice by MMTV-Cre (Fig. S9c). Upon Mcam KO, all canonical Wnt ligands, including Wnt1, Wnt3, Wnt3a, Wnt10a, and Wnt16, were undetectable by qRT-PCR. For the downstream factors of canonical Wnt signaling, representative effectors, including Axin2, GSK-3β, and β-catenin, also showed no significant differences between WT and Mcam cKO mice (Fig. 6a). These data indicate that the promotion of MECs induced by Mcam deletion was not mediated by the canonical Wnt signaling pathway.
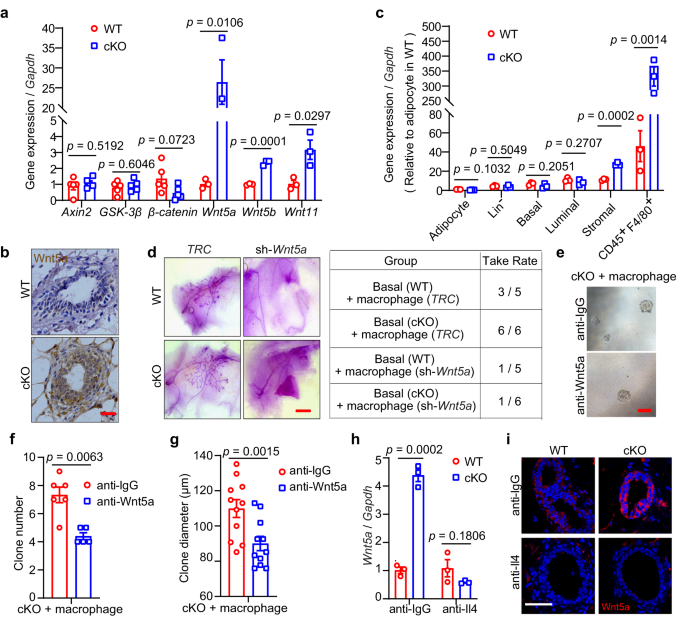
a qRT-PCR analysis of Axin2, GSK-3β, β-catenin (n = 5 mice in each group), Wnt5a, Wnt5b, and Wnt11 (n = 3 mice in each group) expression in mammary tissues from WT and cKO mice by MMTV-Cre. b IHC staining of Wnt5a in WT and cKO mice. Scale bar, 20 μm. c qRT-PCR results for Wnt5a in indicated cell populations of breast tissues. Wnt5a expressed in adipocyte of WT was taken as a control. The results are from 3 independent mice. d Representative images (left) and reconstitution efficiency (right) of whole-mount-stained mammary outgrowths derived from transplantation of isolating mammary macrophages transducing with shWnt5a together with WT or cKO basal cells. 200 basal cells and 800 isolated macrophages were transplanted into cleared mammary fat pads of recipient mice. n = 5 for WT group and n = 6 for cKO group. Scale bar, 5 mm. e–g Representative images (e), clone numbers (f, n = 6 for anti-IgG group and n = 5 for anti-Wnt5a group), and clone diameter (g, n = 11 for each group) of colonies formed by cKO mammry cells cocultured with isolated macrophages treated with anti-IgG or anti-Wnt5a, respectively. 200 mammary cells and 800 isolated macrophages were seeded in each group. Scale bar, 100 μm. h qRT-PCR analysis of expression levels of Wnt5a in WT and cKO mammary cells co-cultured with isolated macrophages treated with Il4 or IgG antibodies. n = 3 replicates for each group. i IF staining of Wnt5a in mammary tissues of WT and cKO mice after treatment with Il4 antibody in vivo. Scale bar, 50 μm. Data are means ± SEM. Two-sided Student’s t test was used to evaluate statistical significance. Source data are provided as a Source Data file.
For non-canonical Wnt ligands, including Wnt5a, Wnt5b, and Wnt11, the level of Wnt5a was remarkable higher in the Mcam cKO group than in the WT group (Figs. 6a). This elevation of Wnt5a was verified at the protein level by IHC staining (Figs. 6b and S9d). Published data21 have shown that Wnt5a is expressed in both basal and luminal epithelial cells. To confirm the Wnt5a surge in Mcam cKO mice is derived from macrophages, we isolated various cell populations in mammary tissues for measuring Wnt5a levels and taking Wnt5a expression in adipocyte of WT as a control, qRT-PCR showed macrophages (CD45+F4/80+) induced nearly 400-fold Wnt5a levels in cKO mice, and stromal cells containing macrophages also showed induced Wnt5a levels in cKO mice (Figs. 6c and S9e). In addition, we depleted Wnt5a in macrophages (Fig. S9f) and transplanted these cells with basal cells to examine whether the absence of Wnt5a in macrophages could still enhance mammary development. While Mcam cKO promotes ductal elongation, loss of Wnt5a by shRNA in macrophages did not have the capacity to reconstruct whole mammary tissue (Fig. 6d), confirming Wnt5a is responsible for the phenotype observed.
We next tested whether Wnt5a mediates the maintenance of MEC clonogenicity and proliferation by adding Wnt5a blocking antibody to the culture medium in the coculture assay between cKO MECs and isolated macrophages. Results showed that in the absence of Wnt5a, Mcam loss failed to increase both clone numbers and clone diameters (Fig. 6e–g), indicating that Wnt5a mediates clonogenicity and proliferation promotion upon Mcam loss. To test the linkage between Il4 and Wnt5a, we blocked Il4 to prove that elevated Wnt5a expression levels are induced by Il4 stimulation. The results found the elevated Wnt5a levels were rescued by Il4 antibody injections (Fig. 6h, i), suggesting increased Il4 upon Mcam loss indeed activates Wnt5a expression.
Loss of Mcam promotes MEC proliferation via Ryk
Next, we investigated how Wnt5a interacts with MECs. Wnt5a binds to two different receptors, i.e., Ror2 to inhibit branching morphogenesis and Ryk to promote MaSC/progenitor proliferation23. Thus, Ryk may be the potential receptor for our phenotype. Here, we explored the expression pattern of Ryk at the single-cell level using MEC single-cell RNA-seq from our and other laboratories. Based on the online data29, Ryk was highly expressed in both basal and luminal cells, especially basal cells (Fig. 7a). Using a single-cell RNA-seq dataset generated by our laboratory41, we found the same Ryk expression pattern (Fig. S10a). Interestingly, we analyzed the correlation between Mcam and Ryk, and found that Mcam and Ryk were co-expressed in many basal cells (Fig. 7b). This result was validated at the protein level using IF staining (Fig. 7c).
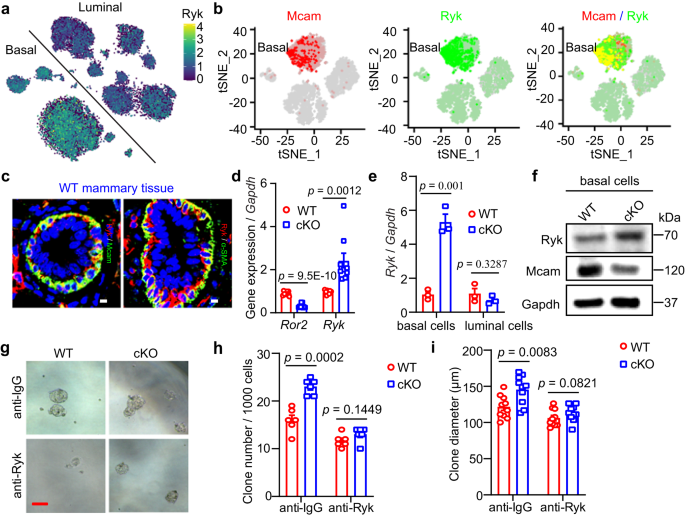
a tSNE plot showing expression pattern of Ryk in different lineages based on single-cell sequencing data29. b tSNE plot showing expression pattern of Mcam (red), Ryk (green), and overlap (orange) in basal cells based on single-cell sequencing data41. c IF images of co-staining of indicated antibodies in WT mammary tissues. Scale bar, 5 μm. d qRT-PCR analysis of Ror2 and Ryk in MECs. n = 9 mice in each group. e Ryk expression levels in basal and luminal cells isolated from WT and cKO mammary tissues by MMTV-Cre. n = 3 biological replicates. f Western blotting showing Ryk protein expression in basal cells from WT and cKO mice. The experiment was repeated three times independently. g–i Representative images (g), clone numbers (h, n = 6 replicates for each group), and clone diameter (i, n = 10 replicates for each group) of colonies formed by WT and cKO mammry cells treated with anti-IgG or anti-Ryk, respectively. Scale bar, 100 μm. Data are means ± SEM. Two-sided Student’s t test was used to evaluate statistical significance. Source data are provided as a Source Data file.
We next explored the expression levels of the two receptors using qRT-PCR. Results showed that upon Mcam loss Ror2 was decreased and Ryk was elevated (Fig. 7d), especially in basal cells (Fig. 7e), consistent with the promoting role of Ryk in MaSCs found in previous study23. The increase in Ryk expression upon Mcam cKO was confirmed by WB or IHC (Figs. 7f and S10b). Moreover, Wnt5a blocking resulted in a decrease of Ryk expression, whereas exogenous recombinant Wnt5a (rWnt5a) increased Ryk expression (Fig. S10c, d), which is consistent with the conclusion that Ryk is correlated with the levels of its ligand – Wnt5a42,43,44. These results imply that the phenotypes observed in the current study is mediated by the Ryk receptor. To further test this hypothesis, we blocked Ryk using its antibody and performed a rescue assay. Results showed that both the increased clone numbers and clone diameters caused by Mcam loss were suppressed to a level similar to that of WT after blocking Ryk (Fig. 7g–i), suggesting that the Mcam functions on MECs is dependent on Ryk. Taken together, loss of Mcam leads to an increase of Wnt5a, which binds to the Ryk receptor, thereby contributing to the clonogenicity, regenerative capacity, and proliferation of MECs.
- SEO Powered Content & PR Distribution. Get Amplified Today.
- PlatoData.Network Vertical Generative Ai. Empower Yourself. Access Here.
- PlatoAiStream. Web3 Intelligence. Knowledge Amplified. Access Here.
- PlatoESG. Carbon, CleanTech, Energy, Environment, Solar, Waste Management. Access Here.
- PlatoHealth. Biotech and Clinical Trials Intelligence. Access Here.
- Source: https://www.nature.com/articles/s41467-023-44338-0