A total of 141 patients were included, including 86 males (60.99%) and 55 females (39.01%), with an age of 9.56 ± 2.84 (Mean ± standard deviation). Among the 141 patients, 131 (92.91%) were severe β-TM, and 10 (7.09%) were severe α-TM. Twenty-nine patients (20.57%) had undergone splenectomy before HSCT.
Analysis of normality
The H-T2*, L-T2* and SF statistics are described in Table 1. After the normality test, the normal distribution (P > 0.05) was seen in total preoperative H-T2*, total postoperative H-T2*, preoperative and postoperative H-T2* in the 6 month group, preoperative and postoperative H-T2* in the 12 month group, postoperative H-T2* in the 18 month group, postoperative L-T2* in the 24 month group, preoperative and postoperative H-T2* in the 24 month group, preoperative and postoperative SF in the 24 month group, and preoperative and postoperative H-T2* in the > 24 month group. Figure 2 shows the mean change rates (%) over time of the change in heart, liver T2 * and serum ferritin: H-T2* and L-T2* show a significant upward trend with time while SF showed a relatively large fluctuation.
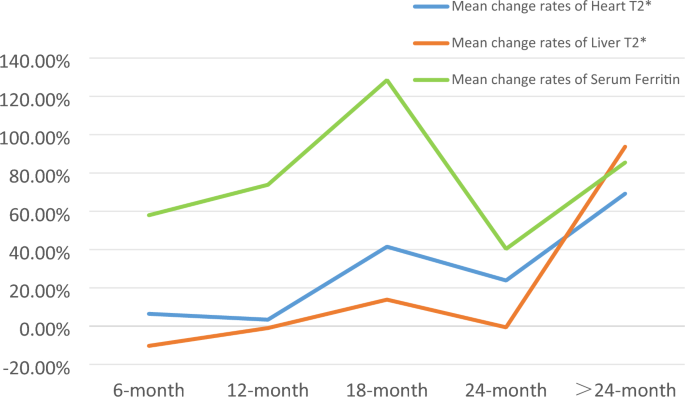
A line plot based on the mean change rates (%) over time of the change in Heart T2* (ms), Liver T2* (ms), and Serum Ferritin (μg/l) before and after HSCT in TM patients.
Difference analysis of H-T2 *, L-T2 *and SF before and after transplantation
Figure 3 cluster diagram shows the distribution of H-T2* and L-T2* grades before and after HSCT. After T2* grading, the number of cases in severe and moderate liver iron concentration after HSCT decreased (preoperative n = 116, 82.27%; Postoperative n = 105, 74.47%), the number of cases in mild and normal groups increased (preoperative n = 25, 17.73%; Postoperative n = 36, 25.53%). After HSCT, the number of patients with severe and moderate cardiac iron concentration decreased (preoperative n = 18, 12.77%; postoperative n = 14, 9.93%), while the number of mild and normal groups increased (preoperative n = 123, 87.23%; postoperative n = 127, 90.07%). Figure 4a shows that H-T2* in TM patients increased from 18 months after HSCT (Significant reduction in cardiac iron load); Fig. 4b shows that L-T2* in TM patients increased from 24 months after HSCT (Significant reduction in hepatic iron load).
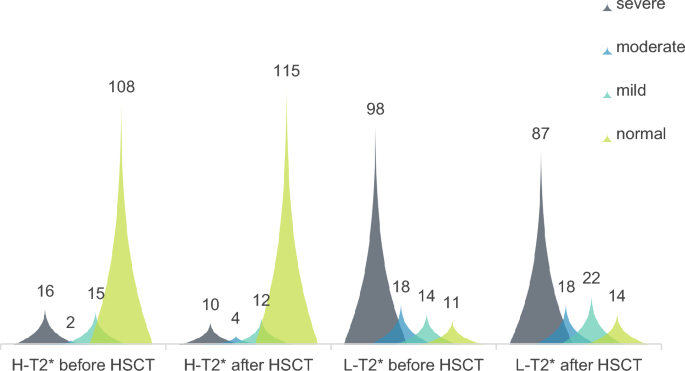
Overall distribution of Heart T2* and liver T2* grades before and after HSCT (the ordinate indicates the number of frequencies).
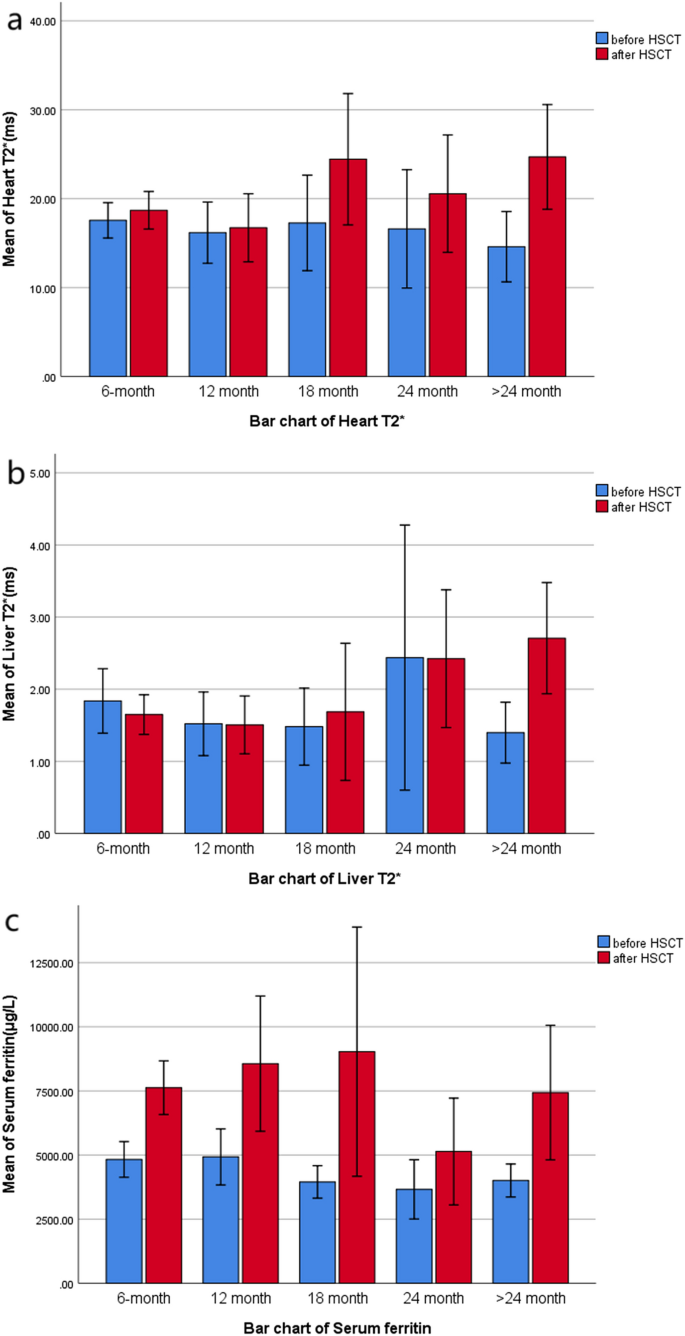
Bar graphs of heart T2*, liver T2* and serum ferritin based on means.
H-T2*: The overall H-T2*(t = − 3.510, P = 0.001) and the postoperative H-T2*(t = − 4.300, P < 0.001) of the > 24 months group were statistically different from the corresponding preoperative H-T2*. The mean value ((overline{x} pm s)) of H-T2* increased significantly in the > 24 months group (preoperative = 14.59, range 2.65–31.18; Postoperative = 24.69, range 4.32–48.66). It is suggested that H-T2* significantly increased after the postoperative interval of more than 24 months, that is, myocardial iron content significantly decreased. Postoperative H-T2* (t = − 1.165, P = 0.248) in the 6-month group, postoperative H-T2* (t = − 0.311, P = 0.758) in the 12-month group, postoperative H-T2* (Z = − 1.328, P = 0.184) in the 18-month group and postoperative H-T2* (Z = − 1.247, P = 0.203) in the 24-month group had no significant difference with the corresponding preoperative H-T2*.
L-T2*: The overall postoperative L-T2* (Z = − 2.042, P = 0.041) and the postoperative L-T2* (Z = − 3.945, P < 0.001) of the > 24 months group were statistically different from the corresponding preoperative L-T2*. The median (M) of L-T2* increased significantly in the > 24 months group (preoperative M = 0.96, range 0.68–3.82, P25%–P75% = 0.785–1.845; Postoperative M = 2.37, range 0.85–6.99, P25%–P75% = 1.245–3.855). It is suggested that L-T2* increased significantly after the postoperative time interval of more than 24 months, which means that the liver iron content decreased significantly. The L-2 * (Z = − 0.314, P = 0.753) in the 6-month group, L-T2* (Z = − 0.015, P = 0.988) in the 12-month group, L-T2* (Z = − 0.245, P = 0.0.807) in the 18-month group, and L-T2* (Z = − 0.459, P = 0.646) in the 24-month group had no significant difference with the corresponding preoperative L-T2*.
SF: Overall SF (Z = − 7.911, P < 0.001), postoperative SF (Z = − 5.780, P < 0.001) in the 6-month group, postoperative SF (Z = − 2.658, P = 0.008) in the 12-month group, postoperative SF (Z = − 3.110, P = 0.002) in the 18-month group and > 24 months group postoperative SF (Z = − 3.251, P = 0.001) were statistically different from the corresponding preoperative SF. The median SF (M) of the 6, 12, 18 and > 24 months groups was significantly lower (preoperative total M = 4552, range 295.00–14,724.50, P25%–P75% = 3278.76–4829.46; Postoperative M = 7515, range 563.72–30,605.05, P25%–P75% = 4246.62–8302.25). It suggested that SF changed greatly after HSCT, and SF increased in most time periods after HSCT. There was no significant difference in postoperative SF (t = − 1.890, P = 0.091) between the 24-month group and preoperative SF.
Correlation analysis of H-T2 *, L-T2 *, and SF before and after transplantation
Figure 5 shows the scatterplots of the relationship between overall H-T2*, L-T2*and SF before and after HSCT. Before transplantation, there was no correlation between total H-T2* and total L-T2* (r = 0.001, P = 0.991). There was no correlation between total H-T2* and preoperative total SF (r = − 0.097, P = 0.255). There was a low negative correlation between L-T2* and SF (r = − 0.222, P = 0.009). There was no correlation between H-T2*, L-T2*and SF in the 6-month group (P = 0.110, 0.996, 0.298). There was no correlation between H-T2* and L-T2*, and between L-T2* and SF in the 12-month group (P = 0.230, 0.762). There was a moderate negative correlation between H-T2* and SF (r = − 0.441, P = 0.031). There was no correlation between preoperative H-T2*, L-T2*and SF in the 18-month group (P = 0.215, 0.286, 0.775). There was no correlation between H-T2* and L-T2*, and between L-T2* and SF in the 24-month group (P = 0.934, 0.238). There was a high negative correlation between H-T2* and SF (r = − 0.804, P = 0.005). There was no correlation between H-T2*, L-T2* and SF in the > 24 months group (P = 0.223, 0.960, 0.740).
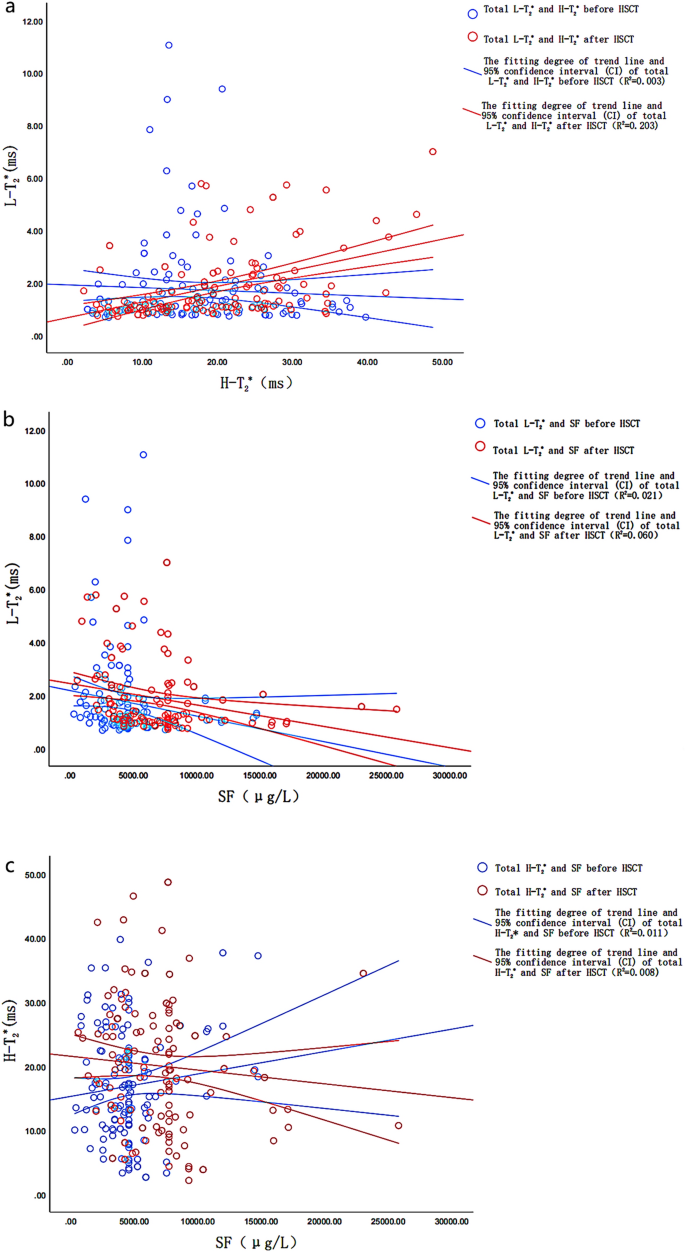
Scatter plot (a–c) shows that the fitting degree of trend line and 95% confidence interval (CI) of total liver T2*, heart T2* and serum ferritin before and after HSCT is very low, showing low correlation or no correlation.
After transplantation: There was a low positive correlation between total H-T2* and total L-T2*(r = 0.382, P < 0.001). There was no correlation between total H-T2* and total SF (r = − 0.097, P = 0.255). There was a low negative correlation between L-T2* and SF (r = − 0.340, P < 0.001). In the 6-month group, there was a moderate positive correlation betweenH-T2* and L-T2* (r = 0.419, P < 0.001) and a low negative correlation between L-T2* and SF (r = − 0.394, P = 0.001), while there was no correlation between H-T2* and SF (P = 0.503). In the 12-month group, there was a high positive correlation between H-T2* and L-T2* (r = 0.704, P < 0.001). There was no correlation between H-T2* and SF, and between L-T2* and SF (P = 0.200, 0.278). There was no correlation between H-T2*, L-T2* and SF in 18-month group (P = 0.706, 0.810, 0.701). In the 24-month group, there was no correlation between H-T2* and L-T2* (P = 0.403); there was a moderate negative correlation between H-T2* and SF (r = − 0.673, P = 0.033); there was a high negative correlation between L-T2* and SF (r = − 0.723, P = 0.018). There was no correlation between H-T2*, L-T2*and SF in the > 24 months group (P = 0.253, 0.424, 0.996).
Red blood cell infusion and iron removal chelation therapy
A total of 115 patients’ pre-HSCT red blood cell transfusion and iron chelation therapy were collected (some patients’ data were missing). Different units of red blood cells were transfused in different TM patients (1U of red blood cells separated from 200 ml of whole blood) : 1U (n = 4, 3.5%), 1.25U (n = 2, 1.7%), 1.5U (n = 10, 8.7%), 1.75U (4, 3.5%), 2U (n = 72, 62.6%), 2.5U (n = 3, 2.6%), 3U (n = 11, 9.6%), 3.5U (3, 2.6%), 3.75U (n = 1, 0.9%), 4U (n = 4, 3.5%), 4.5U (n = 1, 0.9%). All the 115 patients received iron chelation therapy (deferiprone, deferoxamine, deferasirox): 15 cases (13%) received irregular chelation, 78 cases (67.8%) received regular chelation with single drug, 14 cases (12.2%) received regular chelation with combination of two drugs, 8 cases (7%) received regular chelation with combination of three drugs.
Test of Consistency
Intra-observer ICC = 0.996 (95% CI 0.991–0.998) calculated based on 2 measurements of observer A, and P < 0.001. Intra-observer ICC = 0.999 (95% CI 0.999–1.000) calculated based on 2 measurements of observer B, and P < 0.001. The inter-observer ICC between observers A and B was 0.997 (95% CI 0.993–0.998), and P < 0.001. The results show that there is high consistency between the measured T2* values within and between observers.
- SEO Powered Content & PR Distribution. Get Amplified Today.
- PlatoData.Network Vertical Generative Ai. Empower Yourself. Access Here.
- PlatoAiStream. Web3 Intelligence. Knowledge Amplified. Access Here.
- PlatoESG. Carbon, CleanTech, Energy, Environment, Solar, Waste Management. Access Here.
- PlatoHealth. Biotech and Clinical Trials Intelligence. Access Here.
- Source: https://www.nature.com/articles/s41598-023-46524-y