Cell culture
hiPSC-derived iCell-CM (Catalog # R1057, Cellular Dynamics, Madison, WI, USA; donor 01434: female, healthy, Caucasian, > 18 years old at sampling) were thawed and plated at 63,000 cells/cm2 into 384-well tissue culture-treated microplates (Corning, 3764, Corning, NY, USA) that had been pre-coated for 1 h with 0.1% gelatin (STEMCELL Technologies, 07903, Vancouver, Canada). Cultures were maintained for 7 days according to the manufacturer’s guidelines at 5% CO2 and 37 °C. After 7 days, doxorubicin (LC Laboratories, D-4000, Woburn, MA, USA), liposomal doxorubicin (FormuMax, F30204B-D, Sunnyvale, CA, USA), CPX-351 (Jazz Pharmaceuticals, Palo Alto, CA, USA), or a 1:5 molar ratio of free daunorubicin (SelleckChem, S3035, Houston, TX, USA) + cytarabine (SelleckChem, S1648) was applied to the CM for 24 h on Days 1, 3, and 5 at concentrations ranging from 0 to 1000 ng/mL (doxorubicin and daunorubicin) or 0 to 2273 ng/mL (cytarabine). Cells were maintained under 5% CO2 and 37 °C conditions and regular media changes with cardiac maintenance media were performed on non-dosing days (Days 2, 4, 6, and 7; Fig. 7). Plates were analyzed after one 24-h treatment period (Day 2), two 24-h treatment periods (Day 4), three 24-h treatment periods (Day 6), or three 24-h treatment periods plus a 48-h off-treatment period (Day 8) to assess recovery or delayed toxicities. Viability control compounds staurosporine (SelleckChem, S1421) and rotenone (Cayman Chemical, 13995, Ann Arbor, MI, USA) were prepared at six times their target concentrations (2 µM and 10 µM, respectively) and added (10 µL compound to 50 µL cells) to CM cultures 24 h prior to each assay time point. Vehicle control was 0.9% saline for all assays.
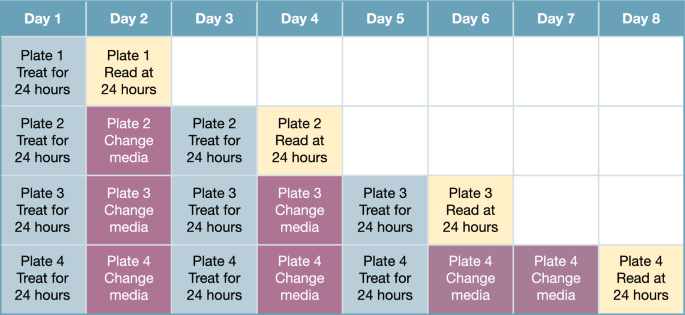
Dosing regimen of free drugs and liposomal formulations.
Bright-field microscopy
Cell morphology and beating were assessed on Days 2, 4, 6, and 8 via bright-field microscopy using a Celldiscoverer 7 (Zeiss, Oberkochen, Germany) equipped with a 5 × 0.35 numerical aperture objective (1.822 µm/pixel). Imaging was performed under 5% CO2 and 37 °C conditions. Image acquisition was controlled by ZEN 2.6 software (Zeiss). Time-series images were acquired using camera streaming with a 30 ms exposure time at 3% transmitted light intensity over a 30-s window in a 512 × 512 pixel field of view at 28.3 frames per second (850 total images per series). All images were exported to .tif format for subsequent analysis. The first image in each series was used to qualitatively assess culture morphology. The full-time series images were used for quantitative analysis of CM beating characteristics.
Intracellular ATP
After media collection and functional assessment, hiPSC-CM plates were rinsed 6six times with phosphate-buffered saline (PBS)+/+ (Corning, 21–030-CV), leaving 25 µL/well PBS+/+. The CellTiter-Glo 3D Cell Viability Assay (Promega, G9682, Madison, WI, USA) was used to assess changes in ATP content in CM cultures according to the manufacturer’s guidelines. Briefly, after thawing and equilibrating the CellTiter-Glo reagent to room temperature, 25 µL/well of the CellTiter-Glo 3D reagent was added to the plate, followed by a 5-min shake step and a 20-min room-temperature incubation. Shake steps and luminescence recordings were accomplished using an EnVision plate reader (PerkinElmer, Waltham, MA, USA). Data were analyzed and plotted using GraphPad Prism as relative luminescence units.
LDH release
The LDH-Glo Cytotoxicity Assay (Promega, J2380) was used to assess LDH release from hiPSC-CM cultures according to the manufacturer’s guidelines. Briefly, an LDH storage buffer (200 mM Tris–HCl, 10% glycerol, 1% bovine serum albumin) was prepared in advance of all assays and stored at 4 °C for up to 1 month. Prior to functional assessment, 10 µL/well of media were collected and diluted 1:30 in an LDH storage buffer. This diluted sample was then combined with a freshly prepared detection mix (12 µL reductase substrate + 2.5 mL enzyme mix) in a 1:1 ratio (10 µL + 10 µL). This detection mix was also added to a freshly prepared LDH standard curve at LDH concentrations ranging from 0 to 32 mU/mL (provided with the kit). After a 30-min room-temperature incubation, luminescence values were measured using an EnVision plate reader. Data were converted to absolute LDH concentration in Excel and plotted using GraphPad Prism as mU/mL.
Image analysis
Time-series images were analyzed using ImageJ (National Institutes of Health, Bethesda, MD, USA). Image series were first filtered by subtraction of a Gaussian-blurred (σ = 10 pixels) copy of the original stack, then stabilized using the Image Stabilizer plugin42. Fifty frames of the median image of each time series were then appended to the beginning of the image stack, creating a reference frame for subsequent beating analysis using the MUSCLEMOTION plugin in batch-processing mode43. Based on analysis of positive control (vehicle-treated) and negative control (staurosporine-treated) wells, the following options were selected for MUSCLEMOTION analysis: Gaussian blur—no; frame rate—28.3; speedWindow—2; decrease noise—yes, simple; detect reference frame—yes, simple; and analyze transients—yes, simple. Time-series analysis outputs (overview-results.txt files) were compiled and filtered to true contractile events (peak amplitude > 90, contractile amplitude > 1/3 vehicle control–treated wells) using JMP 14.0.0 (SAS, Cary, NC, USA), then exported and plotted as beat rate using GraphPad Prism.
Cardiotoxicity biomarker assessment
On Days 2, 4, 6, and 8, 30 µL/well of media were collected in 384-well v-bottom plates (Greiner Bio-One, 781281, Monroe, NC, USA), split into two replicates (one kept as a backup), and frozen at –80 °C. At the completion of the study, media samples were shipped to Abcam for FirePlex cardiotoxicity immunoprofiling (Abcam, ab252375, Waltham, MA, USA) to quantify cardiac biomarkers (ICAM1, cardiac troponin I, FABP3, BNP, and NT-proBNP). Data were analyzed in Excel and plotted using GraphPad Prism as pg/mL. Values less than the minimal detectable dose (MDD) were set to the MDD (8.8, 102.6, 1.9, 10.4, and 10.3 pg/mL for ICAM1, cardiac troponin I, FABP3, BNP, and NT-proBNP, respectively). Values greater than the upper limit of quantitation (uLOQ) were set to the uLOQ (30,000, 30,000, 1111, 3333, and 3333 pg/mL for ICAM1, cardiac troponin I, FABP3, BNP, and NT-proBNP, respectively). Raw fluorescence data were normalized to vehicle control in Excel and plotted using GraphPad Prism as percent change. Each biomarker had a unique time course following myocardial injury.
Mitochondrial respiration
The metabolic profiles were generated using the Seahorse XF96 platform (Agilent, Santa Clara, CA, USA) by measuring OCRs. Briefly, 15,000 hiPSC-CM were seeded in each well of a XF96-well cell culture microplate, allowed to recover, and treated, as described above. The assay medium (Seahorse DMEM supplemented with 4 mM of l-glutamine, 10 mM of galactose, and 1 mM of sodium pyruvate) was pre-warmed and adjusted to pH 7.4. Plates were washed with the assay medium three times, a final volume of 175 μL of the assay medium was added, and plates were incubated at 37 °C without CO2 for 60 min prior to loading into the XF96 Extracellular Flux Analyzer. The mitochondrial stress test conditions included the following sequential injections: oligomycin (25 μL at 20 μM to a final concentration of 2.5 μM), carbonyl cyanide-4-(trifluoromethoxy)phenylhydrazone (FCCP; 25 μL at 18 μM to a final concentration of 2 μM), FCCP (25 μL at 18 μM to a final concentration of 3.6 μM), and rotenone/antimycin A (25 μL at 22 μM to a final concentration of 2 μM). Upon completion of each respirometry assay, the XF96 microplate was removed and fixed with 4% paraformaldehyde. After fixation, the cells were stained with Hoechst, and the cell number per well was assessed via high-content imaging. The respirometry well-level data (pmoles O2/min) were normalized per cell number (pmoles O2/min/103 cells) in each independent experiment. Following normalization of well data based on well cell counts, the non-mitochondrial respiration was subtracted from the other parameters to assess the following aspects of mitochondrial respiration: basal respiration, ATP-linked respiration, maximal respiration, and reserve respiratory capacity. Details regarding the different aspects of mitochondrial respiration are provided in Suppl. Table 1.
Intracellular daunorubicin concentrations
To evaluate if the differences observed between daunorubicin (+ cytarabine) and CPX-351 were due to differential uptake of liposomal versus free anthracyclines, hiPSC-CM were treated with 0 to 1000 ng/mL of daunorubicin (+ cytarabine) and CPX-351 for 24 h. Cells were then rinsed twice with PBS, dissociated, pooled at 6 wells per sample using pre-warmed TrypLE (Gibco, 12605010, Thermo Fisher Scientific, Waltham, MA, USA), and lysed using 100 μL per sample CelLytic MT Buffer (Sigma-Aldrich, C3228, St. Louis, MO, USA). The total protein concentration was assessed via Pierce BCA assay (Thermo Fisher Scientific, 23227) with absorbance measurements at 562 nm acquired on an EnVision (PerkinElmer) plate reader. Lysate supernatant was snap frozen and analyzed for total daunorubicin content.
A high-performance liquid chromatography system (Shimadzu, LC-20, Kyoto, Japan) connected with triple quadrupole mass spectrometer (Sciex, API 4500, Framingham, MA, USA) was used to measure the daunorubicin in CM cell lysate. A standard curve with nine points at 1, 2, 5, 10, 50, 100, 500, 800, and 1000 ng/mL and four quality control levels at 3, 30, 300, and 750 ng/mL were used in the assay. 25 μL of each standard, quality control, sample, and blank were added into the plate according to the analytical run sheet. Daunorubicin-13C,d3 was used as the internal standard and prepared at 25 ng/mL in methanol with 0.5% trifluoroacetic acid as the internal standard solution. 200 μL of the internal standard solution was added to each sample and vortexed at 1500 rpm for 5 min. The sample plate was then centrifuged at 3000×g for 10 min under refrigerated conditions. The supernatant (150 μL) was transferred into a new plate. Fifty (50) μL of methanol with 1% NH4OH was added to each well. The plate was vortexed and centrifuged and ready for injection.
Chromatographic separation was carried out with a Waters AMIDE column (2.5 μM, 2.1 × 100 mm). Mobile phase A was 10 mM ammonium formate with 0.1% NH4OH in water, and mobile phase B was 10 mM ammonium formate with 0.1% NH4OH in acetonitrile/water (90/10). The gradient for mobile phase B was 100% from 0 to 0.5 min, decreased to 60% at 2 min, kept at 60% until 3 min, quickly increased to 100% at 3.1 min, and stopped at 6 min. The follow rate was kept at 0.5 mL/min, and column temperature was set at 60 °C. A multiple reaction monitoring transition of 528.2 to 321.1 was chosen for daunorubicin and 532.2 to 325.1 was chosen for Daunorubicin-13C,d3.
Statistical analyses
Data were compiled, analyzed, and graphed using Microsoft Excel and GraphPad Prism 9. For the biological endpoints of intracellular ATP, LDH release, beat rate, contractile amplitude, mechanical output, and cardiac biomarkers, the number of replicates was six. All values, except LDH concentration, were expressed as a percent of vehicle control cells. For the oxygen consumption rate, the number of replicates was three and the data from each well were individually normalized based on the number of cells present within that well (based on Hoechst-stained nuclei counts). To assess the effect of repeated exposure/time and concentration on a given parameter within a specific treatment (e.g., the effect of the analysis Day [2, 4, 6, or 8] and concentration [62.5–1000 ug/mL] on basal respiration of cells treated with free doxorubicin), two-way analysis of variance (ANOVA) was used with Tukey’s multiple comparison test to assess the effect of concentration and the effect of the Day of assessment, with q-values less than 0.01 considered statistically significant. The repeated-measures ANOVA was not deemed appropriate since they were not consecutive samples from the same biological entity. To further evaluate whether liposomal encapsulation of the drugs had an impact at any given concentration and on any given day, multiple unpaired t-tests using two-stage step-up (Benjamini, Krieger, and Yekutieli) with a false discovery rate of 1% to account for the multiple comparisons were conducted between the two treatment groups for each endpoint (e.g., the effect on LDH release with treatment of 500 ug/mL free versus liposomal doxorubicin on Day 4). Only values considered to be discoveries are reported as significant (i.e., q-values < 0.01).
- SEO Powered Content & PR Distribution. Get Amplified Today.
- PlatoData.Network Vertical Generative Ai. Empower Yourself. Access Here.
- PlatoAiStream. Web3 Intelligence. Knowledge Amplified. Access Here.
- PlatoESG. Carbon, CleanTech, Energy, Environment, Solar, Waste Management. Access Here.
- PlatoHealth. Biotech and Clinical Trials Intelligence. Access Here.
- Source: https://www.nature.com/articles/s41598-023-47293-4