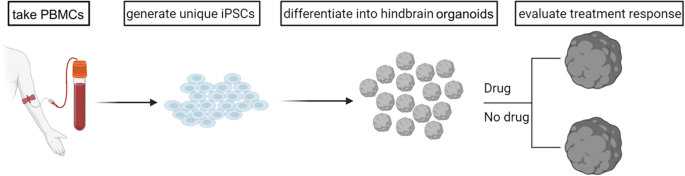
Reprogramming of PBMCs into iPSCs
iPSC lines were generated as previously described [34, 35]. Briefly, peripheral blood mononuclear cells (PBMCs) were isolated from the blood of 3 healthy individuals as well as from 3 AD patients after obtaining informed consent under the oversight of the Johns Hopkins Institutional Review Board. All samples except for AD_2 and AD_3 were obtained through the Johns Hopkins Alzheimer’s Disease Research Center (ADRC). PBMCs from patients AD_2 and AD_3 are from the ongoing Escitalopram for agitation in Alzheimer’s disease (S-CitAD) clinical trial (NCT03108846) [33]. PBMCs were expanded in culture, enriched for erythroblasts, and subsequently electroporated for the delivery of episomal vectors MOS, MMK and GBX (Addgene) using a 4D–Nucleofector (Lonza) according to the manufacturer’s instructions. After transfection, cells were transferred onto tissue culture plates coated with vitronectin (VTN) in DMEM with 10% FBS (v/v) and supplemented with 5 ng/mL of bone morphogenetic protein4 (BMP4). The following day and thereafter, the medium was replaced with xeno-free and feeder-free Essential 8TM medium (E8, ThermoScientific). Between day 13 and 15 of reprogramming, cells presenting the TRA‐1‐60 pluripotency marker were isolated from the newly generated iPSC colonies using the MACSTM MicroBeads magnetic beads (Miltenyi Biotec). Generated iPSC lines were kept in culture in E8 medium on VTN-coated plates for more than 12 passages before being characterized and used for experiments. For characterization, immunocytochemistry (ICC, see 2.7 below) was performed to check for the presence of multiple pluripotency markers (OCT4, NANOG and TRA-1-60). The iPSC lines underwent flow cytometric analysis to further validate the presence of TRA-1-60 (see 2.4 below).
Differentiation of iPSCs into hindbrain organoids
Human iPSC lines were differentiated into serotonergic (5-HT) neurons by activating WNT and SHH signaling in a 3D in vitro platform [32, 36, 37]. Briefly, to better mimic brain development, the iPSCs were first used to form embryoid bodies (EBs). Induced PSCs were first centrifuged (200 x g, 1 min) to form aggregates in ultra-low attachment, round-bottom 96-wells-plates (5’000 cells/well, 50 µL/well) in mTeSRTM medium supplemented with the selective ROCK inhibitor y-27632 (Tocris) on day 0. Starting on the following day, the EBs were cultured to differentiate into neural precursors cells (NPCs) specific to the hindbrain over the course of 3 weeks using serotonergic NPC medium (SNm, see Table S1 in the supplementary information for the full composition). On day 1, 50 µL of SNm with double the amount of trophic factors were carefully added to start diluting out the mTeSR. On days 2 and 3, 50 µL of SNm was added to the differentiating EBs. Having reached 200 µL, 50% (100 µL) of SNm medium was exchanged daily until day 21. After the 3 initial weeks, growing NPC organoids were transferred to 6-wells-plates (8 NPC-organoids/well, 2 mL/well), and they were grown in neural differentiation medium (NDm, see Table S1). NDm was exchanged every 3 days. While in the 6-wells-plates, the organoids were kept on an orbital shaker (ThermoFisher, orbital diameter: 22 cm, 50 rpm). Hindbrain organoids containing serotonergic neurons (5-HT-organoids) were ready for characterization and experiments after 6 weeks.
Organoid area and circularity
In order to evaluate morphological changes of the organoids over time, brightfield images (BF) were taken using an EVOS M5000 microscope (Invitrogen) daily for the first 21 days, then every 3 days until day 42, concurrent with medium changes time points. For the quantification of the area and circularity of the organoids, we developed an in-house algorithm using Python (the full code is available as an open resource on github [38]). Briefly, the images are treated by the code as gray-scale images ranging from 0–255 of intensity values. The organoids are segmented using Felzenswalb algorithm [39] with a previous Gaussian smoothing of the images with a 6 pixels size standard deviation kernel. We enforced a minimum size of 3 pixels for the segmentation. In the next step, to improve the results of the segmentation, we manually set a threshold to differentiate background from organoids to 90 (intensity values). Once the segmentation was performed, the code selects the largest region, excluding background, as a binary mask delimiting the organoid. Finally, the area (A) is then computed integrating the pixels inside the mask. To determine the perimeter (P) of the organoid, we computed the integral of the magnitude of the gradient of the binary mask delimiting the organoid [40]. The circularity (C) or roundness of the organoid can be defined from the area and the perimeter as:
$$C=frac{4pi A}{{P}^{2}}$$
(1)
The more round-like the shape, the closest it can approach the maximum of C = 1, whereas C values smaller than 1 are indicative of non-circular shapes. The values of the area and perimeter are converted from pixel units to mm using a scale bar given by the microscope, the circularity is adimensional. Representative images of segmentation results are found in Figure S1 (supplementary information).
Flow cytometry
To evaluate the successful reprogramming of PBMCs into iPSCs, cells were dissociated into single‐cell suspensions with TrypLETM (Life Technologies). They were then washed and resuspended in PBS with 1% BSA (wt/v). They were labeled with the primary antibody anti‐human TRA‐1‐60 (Millipore). For the subsequent detection, iPSCs were labeled with secondary anti‐mouse IgM‐Alexa®Fluor555 (Thermo Scientific) antibody.
To compare iPSCs and the 5-HT-organoids they were differentiated into, iPSCs and 5-HT-organoids were dissociated with TrypLETM and Gentle cell dissociation reagent (STEM cells technologies) respectively. Cells were washed and resuspended in PBS with 1% BSA (wt/v), following which they were fixed and permeabilized with Cytofix/Cytoperm solution (BD Biosciencence) according to manufacturer’s instructions. Samples were subsequently labeled using AlexaFluor®488 conjugated anti-human TUJ1 and AlexaFluor®647 conjugated anti-human TPH2 antibodies (ThermoScientific). The former is a general neuronal marker, whereas the latter is specific for serotonergic neurons.
All samples were analyzed on a BD LRS Fortessa (BD Biosciences) or on a SH800S cell sorter (SONY Biotechnology). The data was processed using FlowJoTM v10.8.1 software. A full list of the antibodies used for flow cytometry and ICC is available in Table S2 in the SI.
qRT-PCR
To evaluate the differentiation of iPSCs into 5-HT-organoids, quantitative reverse transcription PCR (qRT-PCR) analysis was performed. Messenger RNA (mRNA) was extracted from cellular pellets of iPSCs and 5-HT-organoids using RNA extraction kit (Zymo research), and it was transcribed into complementary DNA (cDNA) by reverse transcriptase using the Superscript III kit (Invitrogen) following manufacturers’ instructions. The generated cDNAs were used as the template for the qPCR reaction with iTaq Universal SYBR Green (Biorad), which was performed with a CFX Connect thermal cycler (Biorad). The primers used were obtained from Integrated DNA technologies and they were for TRA-1-60 (iPSC marker), NKX2.2 (serotonergic NPC), LMXbI and TUJ1 (neurons), TPH2 and FEV (serotonergic neurons). All forward and reverse primer sequences (purchased from Integrated DNA Technologies) are listed in Table S3 (SI).
Cryogenic tissue processing and sectioning of the 5-HT-organoids
Hindbrain organoids were washed three times with D-PBS (pH 7.4) and placed in a 1.5 mL centrifugation tube with 1.2 mL of freshly prepared 4% (v/v) paraformaldehyde and left incubating for 18 h at 4 °C. They were then washed for 10 min with D-PBS with 0.1% (v/v) Tween®20 (Sigma) 3 times. For cryoprotection, the organoids were placed in 30% (wt/v) sucrose in D-PBS and left to equilibrate at 4 °C until they did not float in it anymore (ca. 4 h, but it can vary depending on organoid size and density). The organoids were then transferred to an embedding mold which was carefully filled with O.C.T. compound embedding matrix (ThermoFisher). Snap freezing was done by submerging the molds with the embedded organoids in a slurry of dry ice added to 96% ethanol. The frozen organoids were then stored at −80 °C before being sectioned in 10 µm slices at the Johns Hopkins University SOM Microscopy facility.
Immunocytochemistry (ICC)
Evaluation of pluripotency markers by ICC on adherent human iPSCs was performed as previously described [35]. Briefly, adherent iPSCs in 12-well plates were washed in PBS and fixed with 4% (v/v) paraformaldehyde in PBS (pH 7.4) for 15 min, and permeabilized with Triton X-100 (0.1%, v/v in PBS). To limit non-specific binding, cells were blocked in 10% goat serum (v/v in PBS) for 1 h at 4 °C. They were then stained with either one of the primary antibodies for pluripotency markers, i.e., anti-human TRA-1-60, NANOG and OCT4 at 4 °C overnight. Cells were subsequently washed with PBS, and they were then incubated with the appropriate secondary antibody for 1 h at 4 °C. In the final step, cells were washed with PBS three times, and then stained with DAPI to visualize the nuclei.
Cryo-preserved and sectioned 5-HT-organoids were similarly stained for ICC to confirm the presence of neuronal marker TUJ1, serotonin (5-HT), and neural progenitor cells (NPCs) markers Nestin and NKX2.2 (necessary to determine serotonergic fate) [41]. Confocal fluorescence imaging was performed with a Leica SP8 inverted microscope (DMi8CEL), and the images were analyzed with a Leica LAS X software.
A full list of the antibodies used for flow cytometry and ICC is available in Table S3 in the SI.
Serotonin (5-HT) measurement and treatment with Escitalopram oxalate
Levels of 5-HT present in the extracellular supernatant were measured by enzyme-linked immunosorbent assay (ELISA) using the Serotonin ELISA kit (Enzo Life Sciences) according to the manufacturer’s instructions. To test the effect of the SSRI escitalopram oxalate, 10 and 100 µM of the drug were added to NDm and incubated with the eight 5-HT organoids for 1 h prior to repeat measurement of supernatant 5-HT. The concentration range was initially chosen based on prior literature [36]; a metabolic activity assay was performed to ensure that the used concentrations were not toxic in our systems (see Figure S3 in the supplementary information).
Statistical analysis
All experiments were performed in at least 3 biologically independent replicates (n), and at least 3–6 technical repeats (N) unless stated otherwise. The results are presented as mean ± standard deviation (SD). One-way ANOVA test, followed by Tukey’s Honest Significant Difference test, was performed to pairwise evaluate if there were statistically significant mean differences between groups for Fig. 6b–d. The results were displayed using GraphPad Prism version 9.0.0 (121) for Windows, GraphPad Software, San Diego, California USA, www.graphpad.com. Statistically significant results are indicated with their respective p-values and asterisks as follows: p ≤ 0.05 (*), p ≤ 0.01 (**) or p ≤ 0.001 (***).
- SEO Powered Content & PR Distribution. Get Amplified Today.
- PlatoData.Network Vertical Generative Ai. Empower Yourself. Access Here.
- PlatoAiStream. Web3 Intelligence. Knowledge Amplified. Access Here.
- PlatoESG. Carbon, CleanTech, Energy, Environment, Solar, Waste Management. Access Here.
- PlatoHealth. Biotech and Clinical Trials Intelligence. Access Here.
- Source: https://www.nature.com/articles/s41380-024-02629-y