Selective expression of a Gs-coupled designer receptor in mouse α-cells
To explore the metabolic outcome of selectively activating Gs signaling in pancreatic α-cells, we used DREADD technology to generate a mutant mouse strain that selectively expressed the Gs-DREADD (GsD) in α-cells of adult mice. Specifically, we intercrossed mice harboring the GsD allele preceded by a loxP-STOP-loxP (LSL) sequence (CAG-LSL-GsD mice)33 with Gcg-CreERT2 mice34 to generate heterozygous CAG-LSL-GsD mice containing one copy of the Gcg-CreERT2 transgene. These mutant mice were then treated with tamoxifen (TMX), thus promoting Cre activity and GsD expression in pancreatic α-cells and endocrine L cells of the gastrointestinal tract. Because intestinal L cells turn over rapidly, Cre-modified L-cells are known to be replaced by wild-type (WT) L-cells 4 weeks after TMX treatment34. Four weeks after the last TMX injection, the CAG-LSL-GsD Gcg-CreERT2 mice expressed GsD selectively in α-cells (hereafter referred to as α-GsD mice). TMX-treated CAG-LSL-GsD mice that did not harbor the Gcg-CreERT2 transgene and thus did not express the GsD receptor served as control animals throughout the study.
The expression of the GsD designer receptor was detected using an antibody specific to the HA tag that had been fused to the N-terminus of GsD33. Immunoblotting analysis revealed that α-GsD mice expressed GsD in pancreatic islets but not in any other tissues including intestinal tissue known to contain proglucagon-producing L-cells (Supplementary Fig. 1a). Immunofluorescence staining of slices prepared from pancreatic islets from α-GsD mice confirmed the expression of GsD in glucagon-expressing α-cells and the lack of GsD expression in insulin-containing β-cells or other islet cells (Supplementary Fig. 1b). As expected, GsD was not detectable in pancreatic slices prepared from control mice (Supplementary Fig. 1b). Moreover, immunofluorescence staining of brain slices prepared from α-GsD mice failed to detect GsD expression in proglucagon-producing neurons of the nucleus tractus solitarius (NTS; Supplementary Fig. 1c). These observations indicate that GsD is selectively expressed in pancreatic α-cells of α-GsD mice.
Stimulation of α-cell Gs signaling leads to hyperglucagonemia and hyperinsulinemia in vivo
The expression of GsD in pancreatic α-cells did not affect body weight, islet size, or α- and β-cell mass (Supplementary Fig. 1d–g). α-GsD mice (males) and their control littermates consuming regular chow were then injected with either saline (i.p.) or the selective DREADD agonist, DCZ (10 μg/kg, i.p.)27, followed by the monitoring of changes in plasma glucagon, plasma insulin, and blood glucose levels. Similar to previous observations13,35, i.p. injection of control and α-GsD mice with saline or of control mice with DCZ resulted in reduced plasma glucagon levels 15 and 30 min after injection (p < 0.0001; one-way repeated measures ANOVA, followed by post-hoc Bonferroni adjustment) (Fig. 1a, d). Although the precise mechanism underlying this phenomenon remains unclear, it is possible that the stress of the i.p. injection is confounding basal hormonal levels. Although there was a trend towards higher basal plasma glucagon level in α-GsD mice (time 0; Fig. 1d), this effect failed to reach statistical significance (p = 0.085; Student’s t test at time 0). Importantly, DCZ treatment of α-GsD mice led to a statistically significant increase in plasma glucagon levels (Fig. 1d), thus overcoming the inhibitory effect on glucagon release caused by the injection stress.
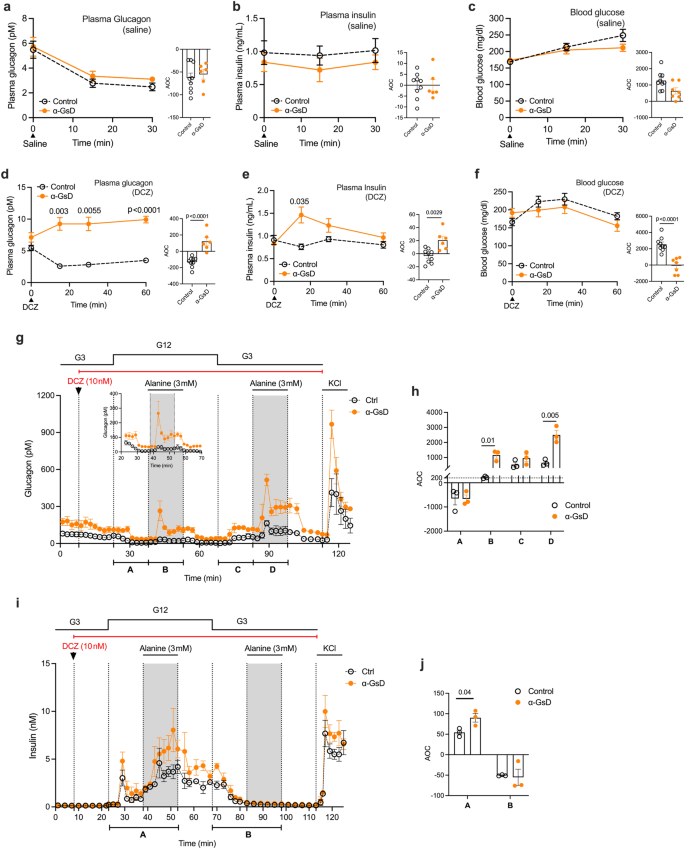
Freely fed α-GsD mice and control littermates were injected with saline (a–c) or DCZ (10 μg/kg, i.p.) (d–f). Plasma glucagon (a, d), plasma insulin (b, e), and blood glucose (c, f) levels were measured at the indicated time points. g–j Pancreatic islets prepared from control and α-GsD mice were perifused with the indicated glucose concentrations in the presence of DCZ (10 nM) and (alanine (3 mM)). Glucagon ((g); insert: glucagon from 23 to 70 min) and insulin secretion (i) were measured in the presence of low and high glucose levels (3 mM [G3] and 12 mM [G12], respectively). AOC values were calculated for glucagon (h) and insulin (j) secretion calculated for different stimulation periods. All experiments were carried out with male littermates (12–16 weeks old). Data are given as means ± SEM (in vivo studies: control, n = 9; α-GsD, n = 7; in vitro studies: 3 independent perifusion experiments with 75–100 islets per perifusion chamber). Data were analyzed via two-way repeated measures ANOVA for time with Bonferroni post hoc test for comparison of individual time points (d–f) or two-tailed Student’s t test (h, j). Numbers of above data points or horizontal lines in the bar graphs represent p values. AOC, area of the curve. Source data are provided as a Source Data file.
Saline treatment of α-GsD mice and control littermates resulted in statistically significant increases in blood glucose levels (p < 0.0001 at 15 and 30 min after injection (time 0); one-way repeated measures with time ANOVA for each group) (Fig. 1c). While this effect persisted in DCZ-treated control mice, blood glucose levels remained unchanged after DCZ injection of α-GsD mice (Fig. 1f), most likely due the increase in plasma insulin levels observed with DCZ-treated α-GsD mice (Fig. 1e) that “neutralized” the hyperglemic effect of the injection stress.
Acute DCZ (10 μg/kg, i.p.) treatment of α-GsD and control mice had no significant effect on the plasma levels of somatostatin and the two major incretin hormones, GIP and GLP-1 (note that GLP-1 is a cleavage product of proglucagon and is primarily secreted from intestinal L cells) (Supplementary Fig. 1h–j). These data support the concept that chemogenetic activation of α-cell Gs signaling promotes the secretion of glucagon which can then act on adjacent β-cells to stimulate the release of insulin11,12,13,14,15.
Stimulation of α-cell Gs signaling promotes glucagon release from perifused mouse islets
To confirm that the DCZ-induced changes in hormone secretion observed with α-GsD mice in vivo were indeed due to altered Gs signaling in pancreatic α-cells, we conducted perifusion experiments using islets prepared from α-GsD mice (α-GsD islets) and control littermates (control islets). Basal glucagon release at both G3 and G12 was significantly higher in α-GsD islets, as compared to control islets (Fig. 1g, h and Supplementary Fig. 1k). This observation is consistent with previous findings that the GsD designer receptor shows a certain degree of constitutive activity under distinct experimental conditions25,33.
Basal insulin secretion was similarly low in both α-GsD and control islets at G3 (Supplementary Fig. 1l). Treatment of α-GsD and control islets with a physiological amino acid mixture (AAM) or alanine which stimulate the secretory activity of mouse α-cells11,36 enhanced the secretion of both glucagon and insulin at G12 (Fig. 1g–j, Supplementary Fig. 1k, l), consistent with the concept that the paracrine effects of glucagon requires elevated glucose concentrations to stimulate insulin secretion11,12,13,14,15. DCZ (10 nM) treatment of α-GsD islets in the presence of 3 or 12 mM glucose resulted in significant increases in glucagon secretion only in the presence of alanine (3 mM) (Fig. 1g, h). To correct for differences in basal hormone secretion, we calculated area of the curve (AOC) values by subtracting the areas under or over the baseline37. This type of analysis is the method of choice when baseline levels between two or more experimental groups differ37.
Under physiological conditions, pancreatic islets are exposed to high levels of circulating amino acids which increase the responsiveness of α-cells to various glucagon secretagogues36,38, providing a likely explanation for the inability of DCZ to stimulate glucagon release from α-GsD islets in the absence of alanine (Fig. 1g, h). At G12, the DCZ/alanine-induced increases in glucagon release in α-GsD islets were accompanied by marked enhancements of glucose-stimulated insulin secretion (GSIS) (Fig. 1i, j). Thus, except for the enhanced basal activity of GsD in vitro, the islet perifusion data are in good agreement with the in vivo results described in the previous paragraph (Fig. 1d, e).
Activation of α-cell Gs signaling improves glucose tolerance in both lean and obese mice
To explore the impact of acute activation of α-cell Gs signaling on glucose homeostasis, α-GsD mice and control littermates maintained on regular rodent chow (lean mice) were subjected to an i.p. glucose tolerance test (ipGTT). Following co-injection of DCZ (10 μg/kg, i.p.) and glucose (2 g/kg, i.p.), α-GsD mice showed a significant improvement in glucose tolerance, as compared to control littermates (Fig. 2a). This beneficial metabolic effect was associated with pronounced increases in both plasma glucagon and insulin levels in α-GsD mice (Fig. 2b, c), suggesting that the increase in insulin secretion following activation of α-cell Gs signaling causes improved glucose tolerance. Co-injection of control and α-GsD mice with insulin (0.75 IU/kg, i.p.) (insulin tolerance test, ITT) and DCZ (10 μg/kg; i.p.) resulted in comparable decreases in blood glucose levels in both groups of mice, indicating that stimulation of α-cell Gs signaling does not affect peripheral insulin sensitivity (Fig. 2d). In the absence of DCZ, control and α-GsD mice did not show any significant differences in blood glucose excursions in the ipGTT and ITT assays (Supplementary Fig. 2a, b). Taken together, these findings indicate that activation of α-cell Gs signaling leads to improved glucose tolerance, most likely due to increased insulin release triggered by enhanced glucagon secretion.
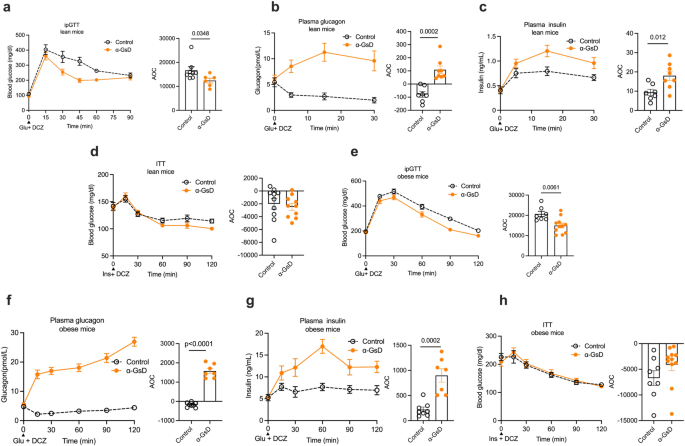
α-GsD mice and control littermates consuming regular chow (lean mice) or a high-fat diet (HFD; obese mice) were subjected to a series of metabolic tests. a Glucose tolerance test (ipGTT). Lean mice that had been fasted overnight were co-injected (i.p.) with glucose (2 g/kg) and DCZ (10 μg/kg) (control, n = 8; α-GsKO, n = 6). Changes in plasma glucagon (b) and plasma insulin (c) levels following i.p. co-injection of lean mice with glucose and DCZ (control, n = 7; α-GsKO, n = 8). d Insulin tolerance test (ITT). Lean mice that had been fasted for 4 h after were injected (i.p.) with a mixture of insulin (0.75 U/kg) and DCZ (control, n = 10; α-GsKO, n = 10). e ipGTT. Obese mice that had been fasted overnight were co-injected (i.p.) with glucose (1 g/kg) and DCZ (10 μg/kg) (control, n = 7; α-GsKO, n = 11). Changes in plasma glucagon (f) and plasma insulin (g) levels following i.p. co-injection of obese mice with glucose and DCZ (control, n = 8; α-GsKO, n = 7). h Insulin tolerance test (ITT). Following a 4 h fast, obese mice were injected (i.p.) with a mixture of insulin (1 U/kg) and DCZ (10 μg/kg) (control, n = 8; α-GsKO, n = 11). Blood samples were collected from the tail vein at the indicated time points. All experiments were carried out with male littermates that were at least 14 weeks old. Obese mice consumed the HFD for at least 8 weeks. Data are given as means ± SEM. Data were subjected to two-tailed Student’s t test (AOC bars) or to two-way repeated measures ANOVA for time with Bonferroni post hoc test for comparison of individual time points (a–c, e–g). AOC, area over the curve. Numbers in the bar graphs or next to specific data points data points refer to p values. AOC, area of the curve. Source data are provided as a Source Data file.
We next examined whether stimulation of α-cell Gs signaling also improved glucose homeostasis in obese, glucose-intolerant mice. To address this question, α-GsD mice and control littermates were maintained on a high-fat diet (HFD) for at least 8 weeks. Consumption of the HFD led to a similar degree of weight gain in both groups of mice (Supplementary Fig. 2c). The two cohorts of mice were then co-injected with glucose (1 g/kg, i.p.) and DCZ (10 μg/kg, i.p.) (ipGTT). Co-injected obese α-GsD mice displayed significantly improved glucose tolerance, as compared to obese control littermates (Fig. 2e). As observed with lean mice (Fig. 2b), DCZ-induced activation of α-cell Gs signaling resulted in a striking increase in plasma glucagon levels in obese α-GsD mice, but not in obese control littermates (Fig. 2f). Plasma insulin levels were also significantly elevated in obese α-GsD mice co-injected with glucose and DCZ (GSIS) (Fig. 2g). Co-injection of obese α-GsD mice and their control littermates with insulin (1 U/kg, i.p.) and DCZ (10 μg/kg, i.p.) (ITT) did not reveal any differences in insulin sensitivity between the two groups of mice (Fig. 2h). These data indicate that acute activation of α-cell Gs signaling results in an insulinotropic effect that improves glucose homeostasis in both lean and obese, glucose-intolerant mice.
Key role of α-cell adenosine A2A receptors in regulating α-cell function
Our next goal was to identify Gs-coupled GPCRs that are endogenously expressed by pancreatic α-cells with relatively high selectivity. Analysis of previously published scRNAseq data from human and mouse islets31,32 led to the identification of three Gs-coupled receptors that are selectively expressed in α-cells, as compared to other islet cell types. These receptors include GPR119 (gene name: Gpr119), the A2A adenosine receptor (A2AR; gene name: Adora2a), and the β1-adrenergic receptor (β1-AR, gene name: Adrb1) (Supplementary Fig. 3a, b). Because of the availability of highly selective A2AR agonists and antagonists39 and floxed A2AR mice40, we decided to explore the potential metabolic roles of α-cell A2ARs. This receptor subtype is also expressed at low to moderate levels in mouse islet δ-cells (Supplementary Fig. 3a; Fig. 4a).
A previous study using an enzyme-coated electrode biosensor demonstrated that the extracellular levels of adenosine in rodent islets are inversely correlated with glucose levels in the surrounding medium41. We therefore speculated that adenosine-mediated activation of α-cell A2ARs might play an important role in promoting glucagon release when glucose levels are low. To test this hypothesis, we perifused islets from WT mice with a selective A2AR agonist, UK 432097 (50 nM). As expected for an agonist acting on an α-cell Gs-coupled receptor, UK 432097 treatment of WT islets resulted in significant increases in glucagon release at both low and high glucose levels (G3 and G12, respectively), resembling the pattern observed with DCZ-treated α-GsD islets (Fig. 3a, b). This UK 432097 effect was completely abolished by pretreatment of WT islets with SCH 442416 (0.5 μM), a selective A2AR antagonist, confirming the involvement of A2ARs (Fig. 3a, b). Strikingly, at low, but not at high glucose concentrations, application of SCH 442416 alone caused a pronounced decrease in glucagon release (Fig. 3a), suggesting that the α-cell A2AR signaling is required to maintain sufficient glucagon release under hypoglycemic conditions.
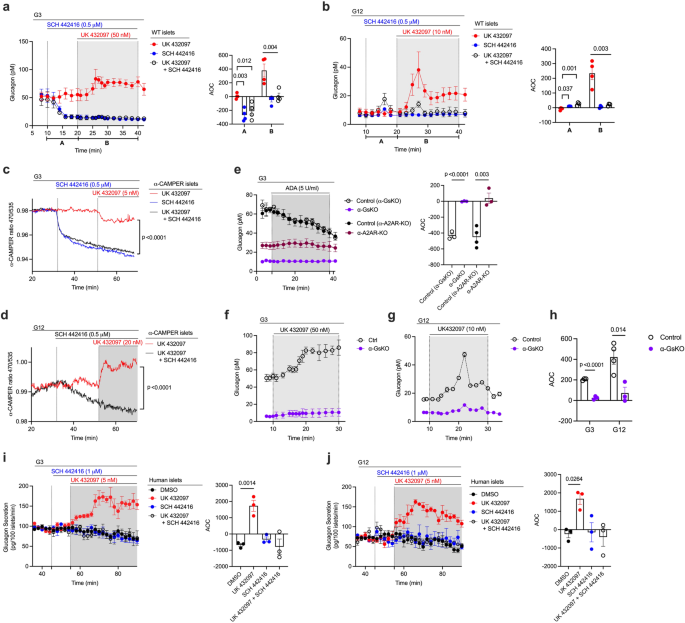
a, b Measurement of glucagon secretion from perifused mouse WT islets. Experiments were carried out at low and high glucose levels (3 mM [G3] and 12 mM [G12], respectively) either in the presence of UK432097 (A2AR-selective agonist: 50 nM at G3, 10 nM at G12) or SCH442416 (A2AR-selective antagonist, 0.5 μM) alone or in the presence of both ligands (n = 4 mice per group). cAMP production in α-cells from α-CAMPER mice at G3 (c) or G12 (d) in the presence of UK432097 (100 nM) or SCH442416 (0.5 μM) or in the presence of both ligands. e–h Glucagon release studies with islets lacking Gαs or A2ARs in their α-cells. Islets were prepared from α-GsKO and α-A2AR-KO mice and their corresponding littermates. In (e), islets were treated with ADA (5 U/ml) at G3 to enzymatically remove extracellular adenosine (n = 3 or 4 mice per group). In (f, g), α-GsKO and control islets were treated with UK432097 at G3 and G12 (n = 3 or 4 mice per group). AOC values (h) for glucagon release data shown in (f) and (g) (time period: 8–30 min). i, j A2AR activation stimulates glucagon secretion from human islets. Islets from human donors were perifused with G3 (i) or G12 (j), respectively, either in the presence of vehicle (DMSO), UK432097 or SCH442416 alone, or in the presence of both UK432097 and SCH442416 (n = 3 donors per group). Islets were obtained from male or female mice that were 14–24 weeks old. AOC values were calculated for different stimulation periods. Data are shown as means ± SEM (3 or 4 independent perifusions with 75–100 islets per perifusion chamber). Data were analyzed via two-tailed Student’s t test (AOC values in a, b, e, h–j) or two-way repeated measures ANOVA with time (c, d). Numbers above horizontal lines in the bar graphs represent p values. ADA, adenosine deaminase. AOC, area of the curve. Source data are provided as a Source Data file.
A2AR-mediated activation of Gs is predicted to increase intracellular cAMP levels via Gs-induced activation of adenylyl cyclase. To monitor A2AR-stimulated cAMP accumulation in α-cells, we employed islets from α-CAMPER mice that express a cAMP biosensor exclusively in α-cells36. We found that A2AR agonist treatment (UK 432097, 5 or 20 nM) of α-CAMPER islets resulted in a small reduction in cAMP levels at G3 but caused a significant increase in cAMP accumulation at G12 (Fig. 3c, d). The A2AR agonist-induced decrease in cAMP levels at G3 is probably due to the facts that A2ARs are already strongly stimulated by high endogenous adenosine levels41 and that α-cell cAMP levels are already high in a low glucose environment42. In agreement with these observations, addition of the A2AR antagonist SCH 442416 (0.5 μM) led to a very robust reduction of cAMP levels at G3 (Fig. 3c), raising the possibility that the inhibitory effect of the A2AR agonist at G3 was caused by A2AR desensitization or the activation of other, yet unknown, signaling pathways that interfere with adenosine-induced cAMP production. On the other hand, at G12, α-cell A2AR signaling is predicted to be reduced due to low extracellular adenosine levels41, explaining why the A2AR agonist (UK 432097) promoted cAMP production and the A2AR antagonist (SCH 442416) caused only a minor reduction in cAMP levels, as compared to basal levels prior to the addition of ligands (Fig. 3d).
To confirm the involvement of intraislet adenosine in stimulating α-cell A2ARs at low glucose levels (G3), we treated control islets with adenosine deaminase (ADA, 5 U/ml) which leads to the conversion of adenosine to inosine, a metabolite that is unable to activate A2ARs43,44. As shown in Fig. 3e, ADA treatment of control islets resulted in a pronounced decrease in glucagon secretion at G3. Strikingly, this effect was absent in islets prepared from mice that selectively lacked A2ARs receptors or the α-subunit of Gs (Gαs) in α-cells (α-A2A-KO mice and α-GsKO mice, respectively; see below) (Fig. 3e). Moreover, basal glucagon secretion at G3 was drastically reduced in α-A2A-KO islets (Fig. 3e). Taken together, these data strongly suggest that α-cell A2AR/Gs signaling plays a key role in stimulating sufficient glucagon release under hypoglycemic conditions.
Previous studies have shown that increases in intracellular Ca2+ levels resulting from the activation of α-cell Gq-coupled receptors can also trigger glucagon release from α-cells35,45,46. Prompted by this finding, we also studied islets from α-GCaMP6s mice (α-GCaMP6s islets) that express a Ca2+ reporter exclusively in α-cells36. Treatment of α-GCaMP6s islets with UK 432097 (A2AR agonist) or SCH 442416 (A2AR antagonist) had no significant effect on intracellular Ca2+ levels at G3 or G12 (Supplementary Fig. 3c, d), confirming that G proteins of the Gq family do not contribute to α-cell A2AR-mediated glucagon secretion.
Stimulation of α-cell A2ARs also promotes glucagon release in human islets
We next explored whether the functional role of the α-cell A2AR signaling cascade observed with mouse islets was also operative in human islets. To address this question, we treated islets obtained from human donors with the A2AR agonist UK 432097 (5 nM). As observed with mouse islets, UK 432097 treatment of human islets resulted in significant increases in glucagon secretion at both low and high glucose concentrations (Fig. 3i, j). This response was abolished in the presence of the A2AR antagonist SCH 442416 (1 μM) (Fig. 3i, j), indicative of the involvement of A2ARs. However, while SCH 442416 treatment of WT mouse islets caused a pronounced decrease of glucagon release at G3 (Fig. 3a), we did not observe this effect in human islets (Fig. 3i). One possible explanation for this observation is that mouse islets were freshly prepared for glucagon release studies, whereas human islets were first cultured for several days under conditions (see Methods for details) predicted to lower extracellular adenosine levels41.
α-Cell A2ARs stimulate glucagon secretion in vitro and in vivo
To elucidate the potential physiological relevance of α-cell A2ARs, we generated mice that lacked A2ARs selectively in α-cells. By crossing Adora2afl/fl mice40 with Gcg-CreERT2 mice34, we obtained Adora2afl/fl Gcg-CreERT2 mice. TMX treatment of Adora2afl/fl Gcg-CreERT2 mice resulted in a robust reduction of Adora2a mRNA selectively in pancreatic α-cells (Fig. 4a). In the following, we refer to these mice simply as α-A2AR-KO mice. TMX-treated Adora2afl/fl littermates that lacked the Cre transgene served as control animals in all studies in which α-A2AR-KO mice were used. The lack of α-cell A2ARs had no significant effect on pancreas weight, total pancreatic or islet glucagon and insulin content, or the expression of key α-cell genes including Gcg (Supplementary Fig. 4a–f).
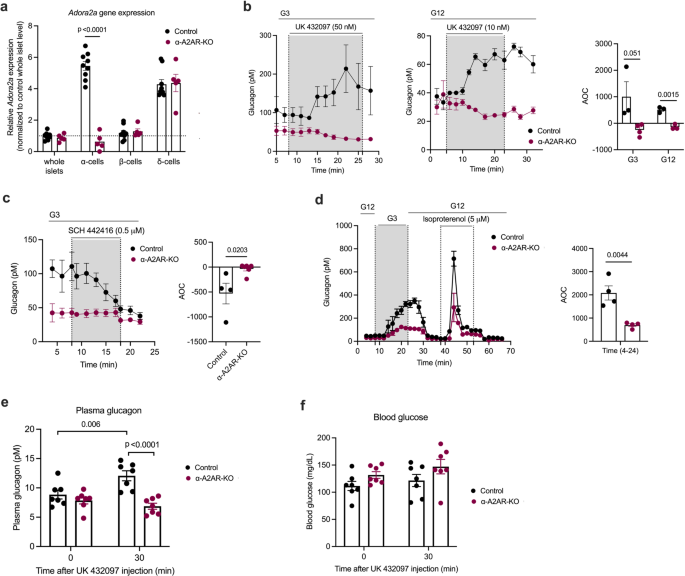
a Absence of Adora2a transcript in α-cells of α-A2AR-KO mice. qRT-PCR analysis of Adora2a gene expression (encoded protein: A2AR) in whole islets, α-, β- and δ-cells. The different cell types were isolated via FACS sorting using islets from control and α-A2AR-KO mice (males). b Glucagon secretion from control and α-A2AR-KO islets treated with the A2AR-selective agonist UK432097 (50 nM at G3, 10 nM at G12). c Glucagon secretion from perifused control and α-A2AR-KO islets treated with the A2AR-selective antagonist SCH442416 (0.5 μM) at G3. d Glucagon release from perifused control and α-A2AR-KO islets in the presence of different glucose concentrations and isoproterenol (5 μM), a β-adrenergic receptor agonist. Plasma glucagon (e) and blood glucose (f) levels measured after i.p. injection of control and α-A2AR-KO mice with UK432097 (5 mg/kg). AOC values were calculated for different stimulation periods. All experiments were carried out with male littermates (12–20 weeks old). Data are given as means ± SEM (in vivo studies: (n = 7 per group); in vitro perifusion studies: 3–5 independent perifusions with 75–100 islets per perifusion chamber). Data were analyzed via two-tailed Student’s t test ((a) and AOC values in (b–d)) or two-way repeated measures ANOVA for time with Bonferroni post hoc test for comparison of time (e, f). Numbers in the AOC panels represent p values. AOC, area of the curve. Source data are provided as a Source Data file.
Initially, we performed perifusion experiments using islets prepared from α-A2AR-KO mice and control littermates. Treatment of control islets with the UK 432097 A2AR agonist (50 nM at G3; 10 nM at G12) resulted in significant increases in glucagon secretion at both G3 and G12 (Fig. 4b). These effects were completely absent in α-A2AR-KO islets (Fig. 4b), confirming the involvement of α-cell A2ARs. We also noted that basal glucagon secretion at G3 was significantly decreased (P = 0.042861) in α-A2AR-KO islets (Fig. 4b, c). Consistent with studies carried out with WT islets (Fig. 3a), treatment of control islets with the SCH 442416 A2AR antagonist (0.5 μM) reduced glucagon release at G3 to levels observed with α-A2AR-KO islets (Fig. 4c). In contrast, SCH 442416 had no significant effect on basal glucagon secretion observed with A2AR-KO islets (Fig. 4c). G3-induced glucagon secretion (after exposure to G12) was also significantly reduced in α-A2AR-KO islets, as compared to control islets (Fig. 4d). Taken together, these in vitro data further corroborate the concept that α-cell A2ARs play a key role in maintaining adequate glucagon secretion when glucose levels are low.
In vivo studies showed that α-A2AR-KO mice maintained on regular chow did not differ from their control littermates in body weight (Supplementary Fig. 4g), fed and fasting plasma glucagon and insulin concentrations (Supplementary Fig. 4h, i), and blood glucose levels (Supplementary Fig. 4j). We first injected α-A2AR-KO mice and control littermates with the A2AR agonist UK 43209 (5 mg/kg, i.p.). Strikingly, the UK 432097-induced increase in plasma glucagon levels observed with control mice was completely absent in α-A2AR-KO mice (Fig. 4e), indicating that activation of α-cell A2ARs triggers glucagon release in vivo. UK 432097 treatment also led to enhanced plasma insulin levels in all control mice, but this response was absent in α-A2AR-KO mice (except for one mouse) (Supplementary Fig. 4k). Blood glucose levels remained unaltered in UK 432097-injected control mice (Fig. 4f), most likely due to hyperglucagonemia-activated counterregulatory responses in the UK 432097-injected control mice.
We next subjected α-A2AR-KO mice and control littermates that had been maintained on an obesogenic HFD for at least 8 weeks to a series of metabolic tests. Both groups of mice showed similar weight gain, glucose tolerance (ipGTT), and insulin sensitivity (ITT) (Supplementary Fig. 4l–n), suggesting that α-cell A2AR deficiency has no detectable effect on glucose homeostasis in obese, glucose-intolerant mice.
Since glucagon plays a crucial role as a counter-regulatory hormone in response to hypoglycemia in lean mice45, we investigated whether α-cell A2ARs contribute to the counter-regulatory increase in plasma glucagon levels under hypoglycemic conditions. To induce hypoglycemia, we injected α-A2AR-KO and control mice with insulin (1 U/kg, i.p.). During insulin–induced hypoglycemia, plasma glucagon levels and blood glucose levels did not differ significantly between the two groups of mice (Supplementary Fig. 4o, p).
2-Deoxy-D-glucose (2-DG) is a glucose analog that interferes with the production of glucose-6-phosphate from glucose, leading to glucopenia in the brain and other tissues47,48,49,50. As a result, 2-DG-induced glucopenia can activate α-cell signaling pathways that stimulate glucagon secretion35,46. We found that 2-DG-induced increases in plasma glucagon, plasma insulin, and blood glucose levels were not significantly affected by the lack of α-cell A2ARs (Supplementary Fig. 4q–s).
Selective inactivation of the gene coding for Gαs (Gnas) in mouse α-cells
To further explore the metabolic role of α-cell Gs (gene name: Gnas), we developed mice in which we selectively inactivated the Gnas gene in pancreatic α-cells in adult mice. To generate this new mouse line, we crossed Gnasfl/fl mice51 with Gcg-CreERT2 transgenic mice34 to obtain Gnasfl/fl Gcg-CreERT2 mice. TMX treatment of adult Gnasfl/fl Gcg-CreERT2 mice caused a robust reduction of Gnas mRNA levels specifically in pancreatic α-cells, as compared to TMX-injected Gnasfl/fl mice lacking the Cre transgene (control littermates) (Fig. 5a). Disruption of the Gnas gene in α-cells of TMX-treated Gnasfl/fl Gcg-CreERT2 mice (referred to simply as α-GsKO mice hereafter) had no significant effect on Gnaq expression levels (Fig. 5b). Gnaq codes for the α-subunit of Gq which, after activation by GPCRs, can stimulate glucagon release from pancreatic α-cells35,46,52,53.
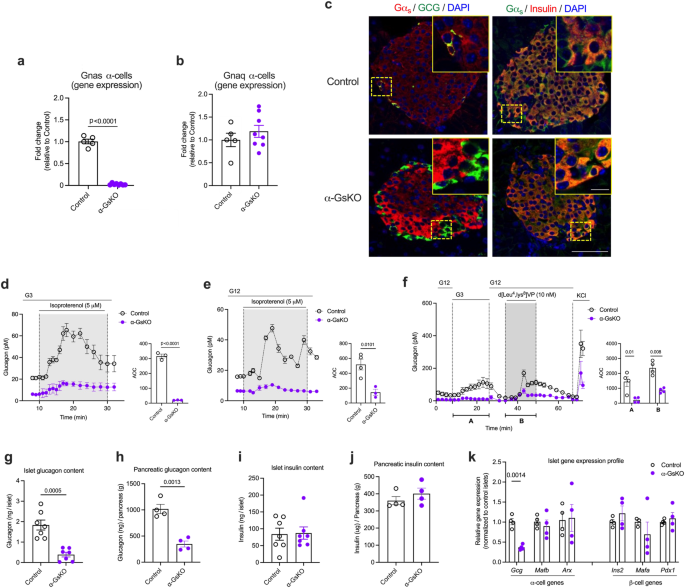
a–c Data confirming the absence of Gnas mRNA (encoded protein: Gαs) or Gαs protein in α-cells of α-GsKO mice (α-cell Gnas-/- mice). a Absence of Gnas mRNA in α-cells isolated from α-cell Gnas-/- mice via FACS (α-GsKO, n = 8 mice; control, n = 5 mice). Gene expression data were obtained via qRT-PCR. b The lack of α-cell Gnas expression does not affect α-cell Gnaq expression (encoded protein: Gαq) (α-GsKO, n = 8 mice; control, n = 5 mice). c Immunofluorescence staining of pancreatic slices from α-GsKO mice and control littermates. Slices were co-stained with either an anti-Gαs antibody (Alexa Fluor, red) and an anti-glucagon antibody (Alexa Fluor, green), or an anti-Gαs antibody (Alexa Fluor, green) and an anti-insulin antibody (Alexa Fluor, red), respectively. The inserts in the upper right of each panel show enlarged islets areas. Scale bar in inserts: 10 μm; scale bars in non-enlarged images: 50 μm. Contrast was adjusted for improved visualization. d, e Glucagon secretion studies carried out with perifused islets prepared from α-GsKO mice and control littermates. While treatment of control islets with 5 μM isoproterenol (β-adrenergic receptor agonist) strongly stimulated glucagon release at both G3 and G12, this response was almost completely abolished in α-GsKO islets (n = 3 or 4 mice per group). f Stimulation of glucagon release by low glucose (G3), a V1b receptor agonist (d[Leu4, Lys8]VP, 10 nM), and KCl (30 mM) from perifused α-GsKO mice and control islets (n = 4 mice per group). Glucagon content of islets and pancreata from control and α-GsKO mice (g, h: n = 7 and n = 4 mice per group, respectively). Insulin content of islets and pancreata from control and α-GsKO mice (i, j: n = 7 and n = 4 mice per group, respectively). k Expression levels of key α- and β-cell genes determined with RNA prepared from control and α-GsKO islets (n = 4 mice per group). AOC values were calculated for different stimulation periods. The data shown in (g–k) were generated using islets obtained from male mice (age: ~30-weeks). For islet perifusion studies, 75–100 islets per chamber were used. Islets were prepared from male mice (age: 16–20 weeks). Immunofluorescence images are representative of three independent experiments. Data are given as means ± SEM. Data were analyzed via two-tailed Student’s t test (a, g, h, k, and AOC values in d–f). Numbers in the AOC panels represent p values. AOC, area of the curve. Source data are provided as a Source Data file.
Immunofluorescence studies with pancreatic sections from α-GsKO mice confirmed the absence of Gαs protein in glucagon-expressing α-cells (Fig. 5c). Gαs expression remained unaffected in β-cells or other non-α-cells in α-GsKO islets (Fig. 5c). The selective deletion of Gαs in pancreatic α-cells had no significant effect on body weight, pancreas weight, or α-cell and β-cell mass (Supplementary Fig. 5a–e).
In vitro studies with α-GsKO islets and pancreata
To provide functional evidence for the absence of α-cell Gs signaling in α-GsKO islets, we carried out glucagon secretion studies with perifused pancreatic islets prepared from α-GsKO mice and control littermates. Specifically, we treated islets with isoproterenol which activates Gs-coupled β-adrenergic receptors which are known to be expressed by α-cells54. Isoproterenol treatment led to a robust stimulation of glucagon release in control islets but showed only residual activity in α-GsKO islets at either low or high glucose levels (G3 and G12, respectively) (Fig. 5d, e,), indicating that α-cell Gs signaling is disrupted in α-GsKO islets. Interestingly, in the absence of isoproterenol (or other ligands), glucagon release at both G3 and G12 was greatly reduced in α-GsKO islets, as compared to control islets (Fig. 5d, e).
As discussed above, glucagon secretion studies with α-A2AR-KO islets indicated that Gs signaling contributes to the intrinsic control of glucagon secretion in α-cells at low glucose. Consistent with this concept, G3-induced glucagon secretion (following exposure to G12) was significantly reduced in α-GsKO islets, as compared to control islets (Fig. 5f). We also treated α-GsKO and control islets with a vasopressin 1b receptor (V1bR) agonist (d[Leu4,Lys8]VP, 10 nM). Recent work demonstrated that arginine vasopressin stimulates glucagon secretion via activation of Gq-coupled V1bRs expressed by pancreatic α-cells35,46. Despite the absence of α-cell Gαs, the V1bR agonist was able to stimulate glucagon release. However, the amount of glucagon released after agonist activation of α-cell V1bRs was significantly reduced in α-GsKO islets (Fig. 5f).
Previous studies have shown that somatostatin (SST) release from δ-cells inhibits glucagon secretion from α-cells (reviewed in ref. 55). To investigate whether this effect was altered in α-GsKO islets, we incubated control and α-GsKO islets with a combination of two SST receptor inhibitors (PRL2915 + PRL3195, 1 μM each) which are known to block the major SST receptor subtypes expressed by mouse α-cells (SSTR2, SSTR3, and SSTR5)56. We monitored both basal glucagon and isoproterenol-induced glucagon secretion. The dramatic reductions in basal and isoproterenol-induced glucagon secretion caused by α-cell Gs deficiency in the absence of SST receptor blockade persisted in the presence of the SST receptor antagonists (Supplementary Fig. 5f, g). These data suggest that it is unlikely that altered SST release from δ-cells contributes to the functional deficits displayed by α-GsKO mice or α-GsKO islets.
α-GsKO mice show reduced plasma glucagon levels in vivo
We next subjected α-GsKO mice and control littermates maintained on regular chow to several in vivo metabolic tests. Interestingly, under fasting conditions, α-GsKO mice displayed a significant reduction in plasma glucagon levels, as compared to fasted control littermates (Fig. 6a). This effect was not observed in mice that had free access to food (Fig. 6a). Plasma insulin and blood glucose levels did not differ significantly between α-GsKO and control mice under both fed and fasting conditions (Fig. 6b, c). Additional metabolic tests showed that α-GsKO and control mice displayed no significant differences in glucose and insulin tolerance (Supplementary Fig. 6a, b).
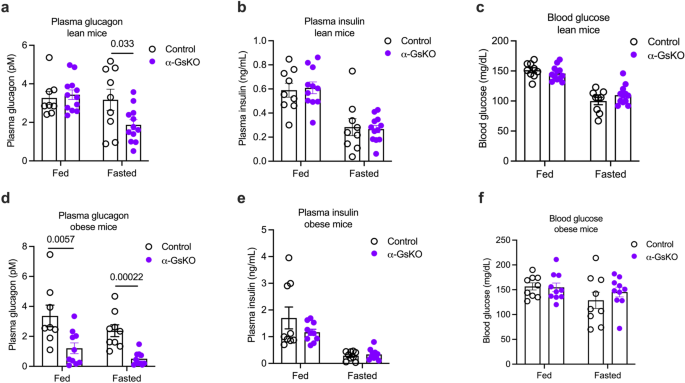
Plasma hormone ((a), glucagon; (b), insulin) and blood glucose (c) levels in α-GsKO mice and control littermates consuming regular chow (lean mice). Mice had either free access to food (fed) or were fasted overnight. Plasma hormone ((d), glucagon; (e), insulin) and blood glucose (f) levels in α-GsKO mice and control littermates maintained on a HFD (obese mice). Mice had either free access to food (fed) or were fasted overnight. Blood samples were collected from the tail vein. All experiments were carried out with male littermates. At the time of testing, lean mice were 14 weeks old. Obese mice were maintained on the HFD for at least 8 weeks, after having consume regular chow for 18 weeks. Data are given as means ± SEM (lean mice: control, n = 9; α-GsKO, n = 12; obese mice: control, n = 9; α-GsKO, n = 10). Data were analyzed via two-tailed Student’s t test (a, d). Numbers above the horizontal lines in the bar graphs represent p values. Source data are provided as a Source Data file.
To further corroborate the involvement of α-cell Gs signaling in A2AR-stimulated glucagon secretion, we treated control islets and α-GsKO islets with the A2AR agonist UK 432097 (50 nM) (Fig. 3f, g). We found that UK 432097-induced glucagon secretion was absent or nearly completely abolished in α-GsKO islets at both G3 and G12, respectively. In addition, we carried out vivo experiments with PSB 0777 (1 mg/kg, i.p.), another selective A2AR agonist57. In agreement with the in vitro data (Fig. 3f, g), PSB 0777-induced increases in plasma glucagon levels were abolished in α-GsKO mice, as compared to control littermates (Supplementary Fig. 6c). Plasma insulin and blood glucose levels were similar in PSB 0777-treated in both groups of mice (Supplementary Fig. 6d, e). These data clearly indicate that A2AR-stimulated glucagon secretion requires α-cell Gs signaling.
When maintained on a HFD for 8 weeks, both α-GsKO mice and control littermates showed similar weight gain (Supplementary Fig. 7a). Notably, obese α-GsKO mice showed decreased plasma glucagon levels under both fed and fasting conditions, as compared to obese control littermates (Fig. 6d). Despite reduced plasma glucagon levels, obese α-GsKO and control mice did not differ significantly in fed and fasting plasma insulin and blood glucose levels (Fig. 6e, f), or glucose tolerance and insulin sensitivity (Supplementary Fig. 7b, c).
Glucagon mRNA and protein are greatly reduced in islets lacking functional Gαs
We speculated that the hypoglucagonemia phenotype displayed by the α-GsKO mice (Fig. 6a, d) was due to reduced basal glucagon release from α-GsKO islets (Fig. 5d–f). To further explore this hypothesis, we measured the amount of glucagon present in pancreatic islets and whole pancreata isolated from control and α-GsKO mice. Strikingly, glucagon content was significantly reduced in α-GsKO islets and pancreata, as compared to the corresponding control preparations (Fig. 5g, h). Pancreatic SST content was similar in control and α-GsKO mice (Supplementary Fig. 7d). Moreover, islet and pancreatic insulin content did not differ significantly between the two groups of mice (Fig. 5i, j). Similar findings were obtained with pancreata prepared from obese α-GsKO and control mice (Supplementary Fig. 7e, f).
qRT-PCR studies demonstrated that the expression of the Gcg gene was significantly decreased in α-GsKO islets, as compared with control islets (Fig. 5k). The expression levels of other key α-cell (Mafb and Arx) and β-cell (Ins2, Mafa, and Pdx1) genes were not significantly affected by α-cell Gαs deficiency (Fig. 5k). To investigate the mechanism underlying the decrease in Gcg expression caused by α-cell Gs deficiency, we carried out additional studies with cultured mouse α-TC6 cells, an adenoma-derived clonal α-cell line. Treatment of α-TC6 cells with PKI 14-22 (10 μM), a highly selective inhibitor of PKA, a protein kinase activated by Gs signaling, led to significantly reduced Gcg RNA levels (Supplementary Fig. 7g), in agreement with published work demonstrating that activation of PKA promotes Gcg transcription58,59.
In sum, these data strongly suggest that disruption of α-cell Gs signaling suppresses the expression of the Gcg gene, leading to reduced glucagon synthesis and storage. This deficit is most likely responsible for the hypoglucagonemia phenotype displayed by the α-GsKO mice (Fig. 6a, d).
α-Cell Gs contributes to glucagon secretion caused by hypoglycemia and glucopenia
To explore the potential involvement of α-cell Gs signaling in hypoglycemia-induced glucagon secretion, we treated control and α-GsKO mice with exogenous insulin (1 U/kg, i.p.) (Fig. 7a, b). Strikingly, insulin-induced hypoglycemia resulted in significantly smaller elevations of plasma glucagon levels in α-GsKO mice (Fig. 7a), probably partially due to the reduction in pancreatic glucagon content caused by α-cell Gαs deficiency (Fig. 5g, h). However, this deficit had no significant effect on the magnitude of insulin-induced decreases in blood levels (Fig. 7b). One possible explanation for this observation is that the mice received a supraphysiological dose of insulin that masked the metabolic effects of altered plasma glucagon levels.
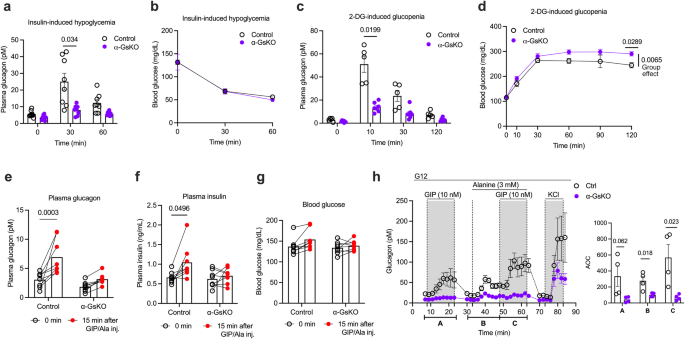
a, b Glucagon release following insulin-induced hypoglycemia. α-GsKO mice and control littermates were injected with insulin (1 U/kg, i.p.), and plasma glucagon (a) and blood glucose (b) levels were measured at the indicated time points (n = 8 per group). c, d Glucagon secretion after 2-DG-induced glucopenia. α-GsKO and control mice were injected with 2-DG (500 mg/kg, i.p.), and plasma glucagon (c) and blood glucose (d) levels were measured at the indicated time points (control, n = 5; α-GsKO, n = 7). e–g Treatment of mice with a mixture of GIP and alanine. α-GsKO and control mice were injected i.p. with a combination of GIP (4 nmol/kg) and alanine (0.325 g/kg), and plasma glucagon (e), plasma insulin (f), and blood glucose (g) levels were measured 15 min later (n = 8 per group). h Treatment of isolated islets with a GIP/alanine mixture to induce glucagon secretion. Perifused islets isolated from control and α-GsKO mice were treated with a combination of GIP (10 nM) and alanine (3 mM) at G12. KCl (30 mM) was added at the end of the experiment (n = 4 mice per group). Note that GIP- and GIP/alanine-induced glucagon secretion was virtually abolished in α-GsKO islets. AOC values were calculated for different stimulation periods. All experiments were carried out with male littermates (14–20 weeks old). Blood was collected from the tail vein. Data are given as means ± SEM (in vitro studies: 4 perifusions with 75–100 islets per perifusion chamber). Data were analyzed via two-way repeated measures ANOVA for time with Bonferroni post hoc test for comparison of time (a, c, d–f) or two-tailed Student’s t test (AOC values in (h)). Numbers above the horizontal lines in the bar graphs represent p values. AOC, area of the curve. Source data are provided as a Source Data file.
We next examined whether α-cell Gαs deficiency affected the increase in plasma glucagon levels caused by glucopenic conditions (2-DG test). Interestingly, glucagon secretion in response to 2-DG injection (500 mg/kg, i.p.) was significantly impaired in α-GsKO mice (Fig. 7c). It is likely that reduced pancreatic glucagon content (Fig. 5g, h) contributed to this deficit. At the same time, the 2-DG-dependent increase in glucose-driven insulin secretion was also significantly reduced (Supplementary Fig. 8a, b). In α-GsKO mice, elevated plasma insulin levels returned to baseline more rapidly than in control littermates (Supplementary Fig. 8a, b). It is likely that this effect is responsible for the elevated blood glucose levels observed with 2-DG-treated α-GsKO mice, as compared to 2-DG-treated control littermates (Fig. 7d).
α-Cell Gs signaling is essential for GIP- and GIP/alanine-induced glucagon secretion
A recent study demonstrated that alanine and GIP have a synergistic effect on glucagon secretion, and that this activity is crucial for the proper regulation of postprandial insulin secretion36. El et al.36 also showed that the combined treatment of mice with GIP and alanine mimics the major metabolic effects of a mixed meal. Previous work has shown that the GIP receptor is selectively linked to Gs60. To investigate whether α-cell Gs signaling is involved in postprandial glucagon secretion, we treated control and α-GsKO mice with a combination of GIP (4 nmol/kg, i.p.) and alanine (0.325 g/kg, i.p.) (Fig. 7e–g). Strikingly, the combination of GIP and alanine synergistically increased plasma glucagon and insulin levels in control mice but not in α-GsKO littermates (Fig. 7e, f). Blood glucose levels remained unaffected by these changes in plasma hormone levels (Fig. 7g).
In agreement with the in vivo data (Fig. 7e) and the findings by ref. 36, treatment of isolated control islets with a GIP (10 nM)/alanine (3 mM) mixture led to a robust increase in glucagon secretion (Fig. 7h). To mimic the postprandial state, studies were carried out at elevated glucose levels (G12). This response was significantly greater than that observed after addition of GIP alone (Fig. 7h). Importantly, the ability of GIP and of the alanine/GIP mixture to stimulate glucagon secretion was completely abolished in α-GsKO islets (Fig. 7h). On the other hand, KCl (30 mM) treatment of α-GsKO islets resulted in a robust stimulation of glucagon secretion (Fig. 7h). However, the magnitude of this response was smaller than that observed with KCl-treated control islets (Fig. 7h), most likely due to the reduced glucagon content of α-GsKO islets (Fig. 5g, h).
- SEO Powered Content & PR Distribution. Get Amplified Today.
- PlatoData.Network Vertical Generative Ai. Empower Yourself. Access Here.
- PlatoAiStream. Web3 Intelligence. Knowledge Amplified. Access Here.
- PlatoESG. Carbon, CleanTech, Energy, Environment, Solar, Waste Management. Access Here.
- PlatoHealth. Biotech and Clinical Trials Intelligence. Access Here.
- Source: https://www.nature.com/articles/s41467-024-49537-x