Generation and characterization of GBA-PD patient-specific MOs
To investigate whether mutant GCase is linked to an altered metabolism leading to neurodevelopmental defects, iPSCs derived from 3 healthy controls (CTRL1, CTRL2, and CTRL3) and 3 GBA-PD patients (PD1, PD2, and PD3) were used to generate midbrain organoid models (Supplementary Table 1). All iPSC lines displayed embryonic stem cell-like morphology and expressed the pluripotency markers SOX2, TRA-1-81, TRA-1-60, OCT4, SSEA4, and NANOG, as well as presenting a normal karyotype. They were subsequently screened for the GBA-N370S heterozygous mutation, which was absent in all the healthy controls and was confirmed in all three GBA-PD cell lines. In addition, the LRRK2-G2019S mutation was discovered in the patient PD3 (Full iPSC characterization available in “Data availability”). Human iPSCs were differentiated into midbrain floorplate neural precursors (mfNPCs) as described before15. The successful derivation of mfNPCs was assessed by confirming the expression of the neural stem cell markers Nestin and SOX2 along with the absence of the dorsal marker Pax6 (Supplementary Fig. 1a, b). Next, we generated midbrain organoids (MOs) from the mfNPCs based on a protocol previously described16. Organoids were either embedded in a droplet of geltrex or kept unembedded in a low-attachment 96-well plate (Fig. 1a, Supplementary Fig. 2), depending on the intended downstream assays.
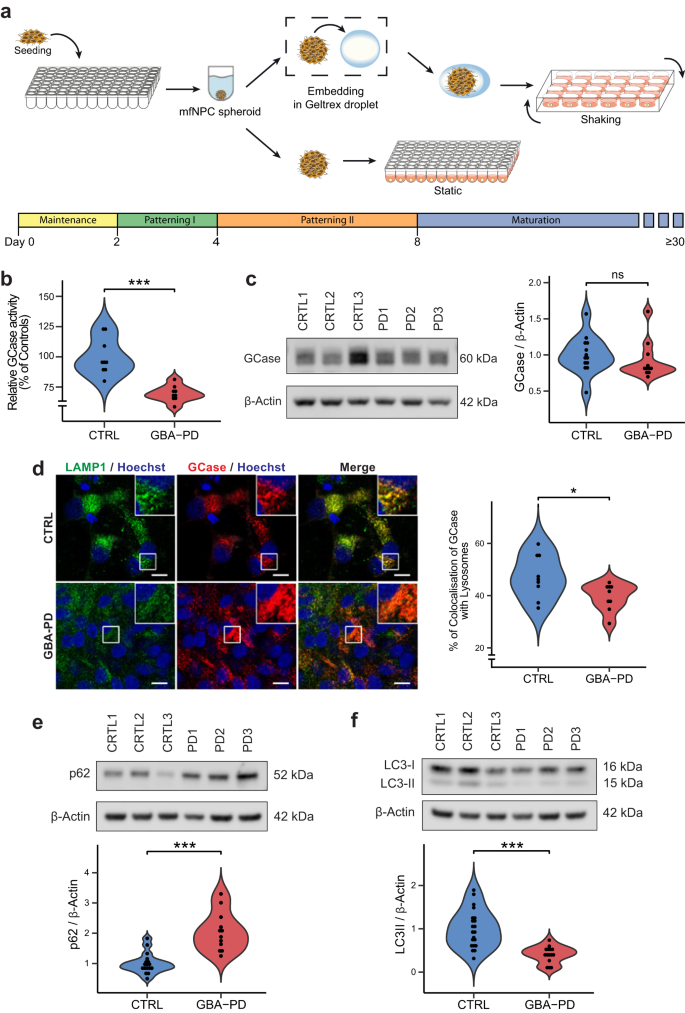
a Schematic overview of the protocol used for the generation of midbrain organoids. mfNPCs, floorplate neural precursors. b GCase enzyme activity in differentiated MO cultures was significantly decreased (40% reduction) when compared with controls. The data represent a summary of three independent differentiation experiments per line each analyzed in triplicate at DIV30. Values are normalized to the average of controls per experiment. Wilcoxon T-test; ***p < 0.001. c GCase protein levels are not altered at DIV30. Representative western blot analysis and respective quantification. The data represent a summary of at least three independent differentiation experiments per line each analyzed in triplicate. Values are normalized to the average of controls per experiment. d Decreased percentage of colocalization of GCase with lysosomes in GBA-PD organoids at DIV30. GCase (red), LAMP1 (green). Representative confocal images with their respective zoomed region of interest (ROI) and their quantification (scale bar, 10 μm). The data represent a summary of three independent differentiation experiments for all cell lines, normalized to the average of controls per experiment. Wilcoxon T-test; *p < 0.05. e, f Representative western blot and quantification of expression of the autophagy markers p62 and LC3 at DIV30. Data represents a summary of at least five independent differentiation experiments. Values are normalized to the average of controls per experiment. Wilcoxon T-test; ***p < 0.001.
We then sought to confirm the decrease of GCase activity that is associated with the N370S mutation. As expected, the enzyme activity of GCase in GBA-PD MOs was significantly reduced (Fig. 1b). No differences were found in the levels of GCase protein at 30 days of in vitro organoid differentiation (DIV) (Fig. 1c), but they were significantly decreased at DIV60 (Supplementary Fig. 3a). Moreover, mutations in the GBA gene are known to cause GCase retention in the ER, leading to reduced levels of the enzyme in the lysosomes17,18. Therefore, we measured the amount of GCase protein found in the lysosomal compartment by colocalization analysis with the lysosomal marker LAMP1 and found a significant reduction of the enzyme located in lysosomes (Fig. 1d).
GCase deficiency has been shown to impair the lysosomal degradation capacity of dopaminergic neurons18, we therefore examined the glycohydrolase activity of the lysosomal enzymes β-hexosaminidase, β-galactocerebrosidase and β-galactosidase. No significant differences were observed in β-hexosaminidase or β-galactocerebrosidase activity of GBA-PD MOs compared to unaffected controls, however, an increase in β-galactosidase activity was detected in patient-derived MOs (Supplementary Fig. 3b). To further investigate a possible impairment of the lysosomal degradation capacity, we examined the autophagy markers p62/SQSTM1 and LC3 to assess autophagy flux. We found that p62 levels were increased in GBA-PD MOs under basal conditions (Fig. 1e) as previously shown18, whereas LC3-II levels as well as LC3-II/-LC3 I ratio were decreased (Fig. 1f, Supplementary Fig. 3c), suggesting that the formation of autophagosomes might be impaired.
Mitochondrial dysfunction has been proposed as a key mechanism in the pathogenesis of PD and has been reported in GBA-PD cellular and animal models19,20,21. We investigated mitochondrial mass by quantification of the mitochondrial membrane proteins VDAC and TOM20. Whereas we found no differences in TOM20 levels (Supplementary Fig. 3d), there was a significant decrease in VDAC (Supplementary Fig. 3e), probably indicating that while mitochondrial mass is unaffected in GBA-PD MOs, their content in the voltage-dependent anion channel, VDAC, is reduced. Based on this, we speculated that mitochondria functionality might be impaired. In order to evaluate this, we measured mitochondrial oxygen consumption rates (OCRs); indeed, GBA-PD organoids displayed significantly reduced mitochondrial ATP as well as decreased coupling efficiency, and higher proton leak compared to unaffected controls (Supplementary Fig. 3f), which clearly indicates that mitochondrial functionality is compromised.
In summary, patient-specific midbrain organoids exhibit characteristic pathological features of GBA-associated PD, such as impaired GCase activity, reduced lysosomal content of GCase, impaired autophagy flux and mitochondrial phenotypes. All together this qualifies this model as an excellent tool for further investigations.
Computational modeling shows that the GBA-N370S mutation has a high impact on cellular metabolism
After the establishment and validation of a midbrain PD model consistent with GBA-PD-associated phenotypes, we addressed the effect of the heterozygous GBA-N370S mutation on metabolic changes. Genome-scale metabolic (GEM) models are an in silico tool for the identification of metabolic flux alterations underlying disease phenotypes and has proven to be useful to generate accurate predictions and relevant hypothesis for metabolism research22,23. Here, we use one of the most comprehensive human metabolic models, Recon324 to reconstruct context-specific models of healthy and GBA-PD midbrain organoids. RNA-seq analysis was conducted on DIV30 midbrain organoids from the CTRL1, CTRL2, PD1, and PD2 cell lines and was used to build cell line-specific models with rFASTCORMICS25 capturing GBA-N370S associated metabolic alterations.
First, we performed structural model analysis to identify differences between the control and GBA-PD models in gene, metabolite, and reaction composition (Fig. 2a and Supplementary Table 3). We identified 97 genes, 449 reactions, and 302 unique metabolites present only in the control models but not in patient-derived models. In contrast, GBA-PD models shared 71 genes, 1055 reactions, and 676 unique metabolites that were absent in the control models. Next, we performed gene enrichment analysis for the control and patient model unique genes (Supplementary Fig. 4a). We found that the most enriched biological processes of control-specific genes were associated to lipid metabolism, transmembrane transport, and polyol transport, while GBA-PD model-specific genes showed a particular enrichment in the glycosylation and carbohydrate metabolic processes. Further, we analyzed the Recon3 subsystems of the control and patient-specific reactions (Fig. 2b). Among the top five subsystems containing the highest number of control-specific reactions we identified mitochondrial transport, sphingolipid metabolism, extracellular transport, and fatty acid oxidation. The highest number of reactions specific to the GBA-PD models belong to glycerophospholipid metabolism, fatty acid oxidation, peptide metabolism, and extracellular transport (Fig. 2b). Importantly, within the extracellular metabolite transport reactions, dopamine extracellular transport belongs to the subset of reactions present only in control models and was not found in the GBA-PD models (Supplementary Table 4). Next, we pooled the count of control- and mutant-specific reactions per subsystem in order to identify metabolic pathways with the most different reaction composition between the two conditions (Fig. 2c, Supplementary Table 5). The subsystems with the most different reactions were extracellular metabolite transport, exchange/demand reactions, and peptide metabolism, followed by fatty acid oxidation, sphingolipid metabolism, and glycerophospholipid metabolism. We then performed flux variability analysis (FVA) on these subsystems optimizing for ATP production to mimic a situation of high energetic demand similar to the physiological state of a mDA neuron26. We included in our analysis the central energy pathways as there is evidence that these pathways could be dysregulated27. For the subsystems of interest, we then compared flux distribution similarity based on FVA between mutants and controls using a similarity index (SI) (Fig. 2d). In addition, we computed the SI between both control models and between both mutant models separately (Fig. 2d). This allowed us to assess the variability between cell lines of the same condition. We found that in a situation of high ATP demand, the most different flux distribution was observed in exchange/demand reactions and extracellular transport, followed by sphingolipid and glycerophospholipid metabolism. However, when considering the subsystems with a relative low variability within the same condition, the biggest differences between patients and controls were observed in the glycolysis pathway, after exchange/demand reactions and extracellular metabolite transport.
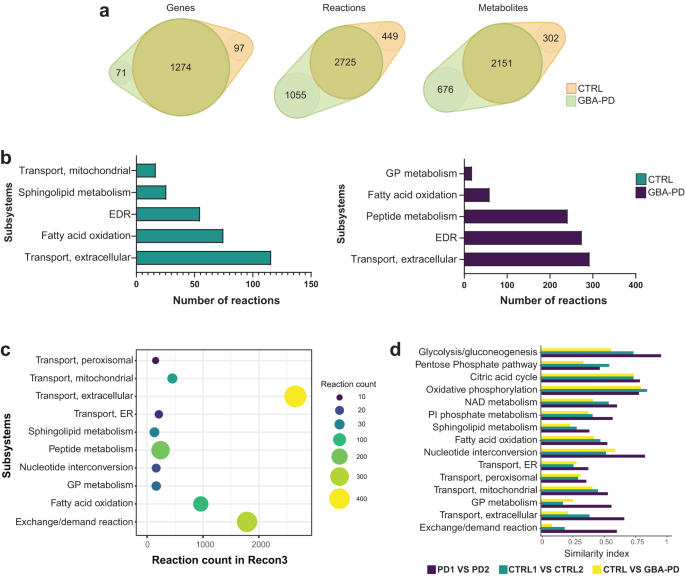
a Venn diagram representation of the structural model analysis. b Comparison of model composition by reactions. Reactions found exclusively in control models (green) or in GBA-PD (purple) were mapped to the Recon 3 subsystems, and the top five most different subsystems based on the reaction number are listed for each condition. EDR = exchange/demand reaction, GP = glycerophospholipid. c The top 10 most different subsystems between control (CTRL1 and CTRL2) and GBA-PD (PD1 and PD2) models after pooling the exclusive reactions of the two conditions. The size and color of the dot represent the number of reactions per subsystem. The location in relation to the x-axis represents the size of the subsystem in the generic Recon3. Subsystems are positioned on the y-axis in alphabetical order. GP = glycerophospholipid, ER = endoplasmic reticulum. d Similarity index of flux variability analysis optimizing for ATP demand for subsystems of interest. SI between CTRL1 vs CTRL2 and SI between PD1 and PD2 models were compared, as well as the SI between the CTRL (CTRL1 and CTRL2) and GBA-PD (PD1 and PD2). SI of 0 represents a complete mismatch in flux variability between the models, whereas a SI of 1 represents the highest similarity in flux variability. PI = Phosphatidylinositol, ER = endoplasmic reticulum, GP = glycerophospholipid.
Interestingly, we observed that the SI between both mutant models were, in general, higher than between both control models for all the metabolic pathways of interest. This indicates that the variability within the GBA-PD condition is lower than in the controls, suggesting that the GBA-N370S mutation has a substantial effect on metabolism.
Overall, these findings suggest that lipid metabolism in GBA-PD organoids could be largely affected, along with important disturbances in the extracellular transport.
Lipid alterations in PD-N370S midbrain organoids
Among the predicted metabolic changes, glycerophospholipid metabolism and sphingolipid metabolism were recurrently highlighted pathways (Fig. 2b–d), implying that lipid metabolism in GBA-PD organoids could be largely affected. In order to confirm that, we performed a comprehensive lipidomic analysis including over 2000 lipid species across 16 different lipid classes. We visualized the results using the t-SNE dimensionality reduction technique and observed that the lipidomics data from GBA-N370s MOs and controls formed two clearly separated distinct clusters (Supplementary Fig. 4b), respectively, suggesting a dramatic difference in the lipidomes between the two conditions. We further scrutinized these results by analyzing the levels of hexosylceramides (HexCer), which comprise glucosylceramide (GlcCer), the primary physiological substrate of GCase, as well as galactosylceramide. The predominant HexCer species was C18:0 (Supplementary Fig. 4c) as reported in the human brain28,29 and its levels were significantly lower in GBA-PD organoids, whereas HexCer C22:0 was significantly higher (Supplementary Fig. 4c). However, the total HexCer levels where not significantly different in GBA-PD MOs compared to controls (Fig. 3a).
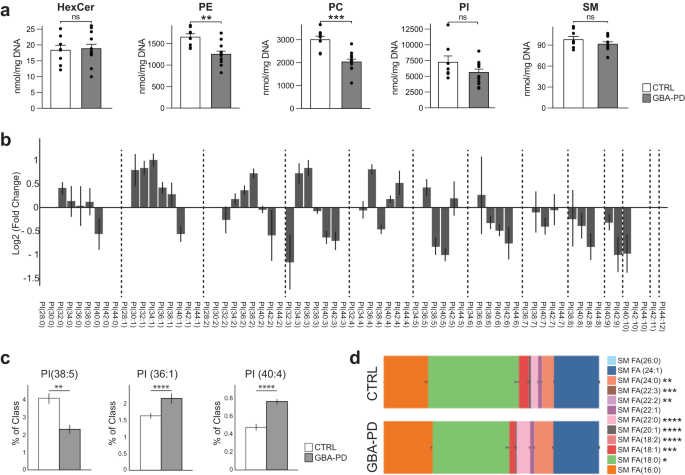
a Differences in phosphatidylethanolamine (PE) and phosphatidylcholine (PC) levels but not hexosylceramides (HexCer), sphingomyelins (SM) or phosphatidylinositol (PI) in HILIC LC-MS/MS based lipidomic analysis of DIV30 organoids. Data represent a summary of four independent organoid differentiations, Mann–Whitney U test. **p < 0.01, ****p < 0.0001. Error bars represent standard error of the mean. b Pairwise comparison between GBA-PD vs control of phosphatidylinositol (PI) lipid species denoted by their sum notation. Data expressed as the Log2 of the fold change. Error bars represent standard error of the mean. c Plots for PI molecular species PI (38:5), PI (36:1), PI (40:4), each plot corresponds to the most enriched species for that sum notation: (18:1/20:4), PI (18:0/18:1), and PI (18:0/22:4), respectively. Data represent a summary of four independent organoid differentiations and is expressed as the percentage of the entire PI class. p-values were calculated using a one-way ANOVA test. FDR adjusted p-values were calculated using the Benjamini–Hochberg procedure. **p < 0.01, ****p < 0.0001. Error bars represent standard error of the mean. d Fatty acid composition of the lipid species within the sphingomyelin lipid class. Data represent a summary of four independent organoid differentiations expressed as relative quantification, where each species is normalized to the total amount of lipid of its class. p-values were calculated using a one-way ANOVA test. FDR adjusted p-values were calculated using the Benjamini–Hochberg procedure. *p < 0.05, **p < 0.01, ***p < 0.001, ****p < 0.0001. Error bars represent standard error of the mean.
Interestingly, the two most abundant phospholipids in the brain, phosphatidylethanolamine (PE) and phosphatidylcholine (PC)30, were both decreased in GBA-PD derived organoids (Fig. 3a), this was accompanied with statistically significant differences in other lipid classes, such as triglycerides (TG), monoglycerides (MG) and phosphatidylglycerol (PG) (Fig. S4d). Even though there were no differences in the total levels of phosphatidylinositol (PI), there was an important dissimilarity in the PI species composition (Fig. 3b, c). A total of 45 lipid species were found to differ significantly in their abundance between the two conditions. A lipidomics study of the human PD brain identified a specific decrease in PI (38:5) accompanied by an increase in PI (36:1) and PI (40:4) in the visual cortex31. In agreement with this report, the same differences were detected here (Fig. 3c). PIs are the precursors of phosphoinositides (PIPs), that are signaling molecules required for many important cellular processes. The fatty-acyl chain profiles of PIPs correlate with that of PIs32, we therefore assumed that the significant differences observed in PI molecular species would translate to an abnormal PIP profile. Consistently, many phosphoinositide signaling genes expressed in the human fetal brain33 were differentially expressed in GBA-PD organoids (Supplementary Fig. 4e).
Surprisingly, we did not detect any differences in total levels of sphingomyelins (Fig. 3a), which are synthesized from ceramide and PC, both of which were significantly reduced in patient-derived MOs. However, their species profile was significantly different between the two conditions in terms of fatty acid composition (Fig. 3d).
Our lipidomics results indicate that GBA-PD organoids present a drastically deregulated lipid profile, including differences in steady-state levels for several lipid classes, as well as significant changes in the molecular species within the same class. Strikingly, they recapitulate lipid composition differences that previously have been described in the brain of human PD patients31.
Impaired Dopaminergic neuronal differentiation in GBA-PD midbrain organoids
Based on the metabolic modeling, the most affected subsystem is the extracellular transport (Fig. 2b–d), since some of the reactions present exclusively in control models belong to the dopamine extracellular transport (Supplementary Table 4), we sought to experimentally validate whether dopamine release was impaired in GBA-PD organoid cultures. Indeed, we found that dopamine extracellular levels were profoundly decreased in all the MOs with the GBA-N370S mutation compared with control-derived MOs at DIV60 (Fig. 4a). Next, we assessed the levels of tyrosine hydroxylase (TH), the rate-limiting enzyme in the biosynthesis of dopamine, and found that they were equally reduced, not only at DIV60 (Fig. 4b) but also at every time point collected from DIV15 to DIV90 (Supplementary Fig. 5a). To determine whether decreased levels of DA and TH result from a lower enzymatic content in cells or rather a lower number of DA neurons in patient MOs, we quantified the amount of dopaminergic neurons using an automated image analysis algorithm. The proportion of TH+ neurons was significantly decreased (Fig. 4c–e, S5b–d) in GBA-PD organoids compared to controls, at DIV30 and DIV60, but also at earlier timepoints (Supplementary Fig. 5b). Moreover, the neurites of these dopaminergic neurons seemed to be less ramified (Fig. 4f), quantified by the number of links and nodes and this difference becomes even more significant at later timepoints (Supplementary Fig. 5e). In addition to a less complex arborization, the neurites of these dopaminergic neurons presented a higher fragmentation index (Supplementary Fig. 5f), which can be an early sign of neurodegeneration34.
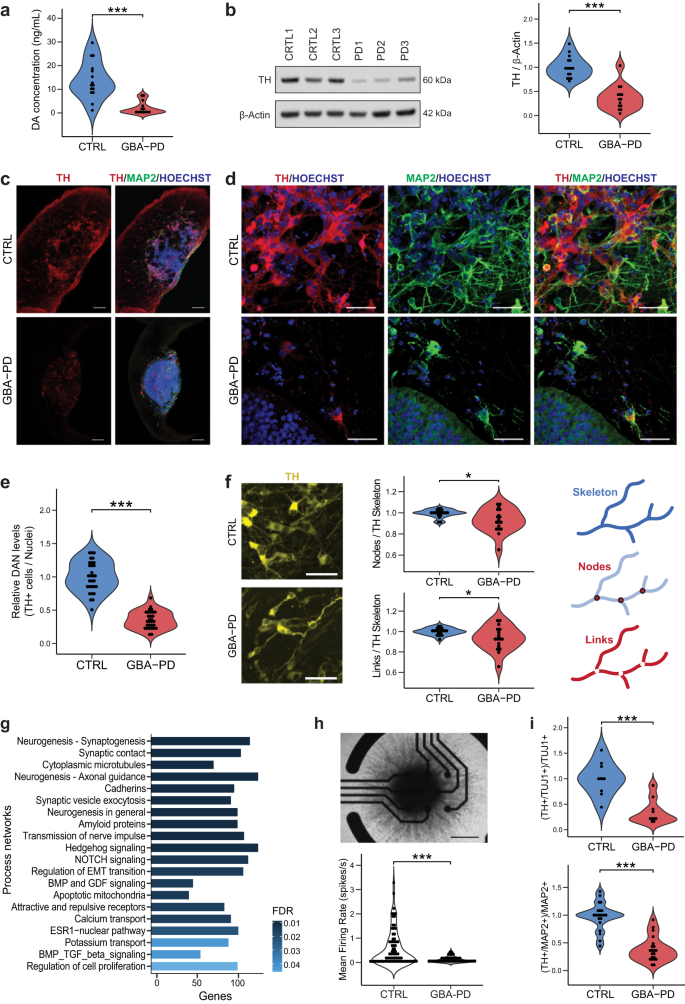
a Levels of extracellular dopamine in culture media at DIV60 were lower for GBA-PD organoids when compared with controls, measured by ELISA. The data represent a summary of five independent differentiation experiments for all cell lines. Wilcoxon T-test; ***p < 0.001. b Quantification of TH protein levels and representative western blot at DIV60 showing decreased levels of the protein in heterozygous GBA–N370S organoids. Data represents a summary of five independent differentiation experiments normalized to the mean of the controls per batch. Wilcoxon T-test; ***p < 0.001. c Representative images of DIV30 midbrain organoids sections stained for TH (red), MAP2 (green), nuclei (blue) (scale bar, 200 μm). d Immunofluorescence images of sections from Fig. 3c acquired at 40× (scale bar, 50 μm). e High-content automated image analysis of immunofluorescence stainings of dopaminergic neurons in organoids at DIV30 expressed as the proportion of cells expressing TH normalized by total nuclei. Data represents a summary of six independent differentiation experiments normalized to the mean of the controls per batch. Wilcoxon T-test; ***p < 0.001. f Neurite branching is less complex in dopaminergic neurons from GBA-PD organoids at DIV30 when compared with controls, measured by the number of nodes (branching points) and links (branches) extracted from the skeletonization of TH mask by the algorithm used for image analysis. Representative immunofluorescence images of TH+ neurons (yellow) showing less complex arborization in GBA-PD condition (scale bar, 50 μm) and graphic illustration of the morphometric features; links, nodes and skeleton. Data is normalized to the mean of the controls per experiment. n = 6, Wilcoxon T-test; *p < 0.05. g GeneGO MetaCoreTM enrichment analysis by process networks showing the top 20 overrepresented processes in DIV30 organoids. h Mean firing rate detected by individual electrodes of a multi-electrode array (MEA) system at DIV15 showing that mutant organoids are less electrophysiologically active. The data represent a summary of four independent differentiation experiments for all cell lines. Values are normalized to the mean of the controls per experiment. Wilcoxon T-test; ***p < 0.001. Upper panel shows a representative image of a midbrain organoid positioned on an 8-electrode array in a 96-well tissue culture plate (scale bar, 500 μm). i Decreased levels of TH+ cells normalized to the total neuronal population at DIV15 using the early neuronal marker TUJ1 and DIV30 using the late neuronal marker MAP2.
We performed an enrichment analysis by process networks on the transcriptomic data obtained from the two control lines (CTRL1 and CTRL2) and the two GBA-PD lines (PD1 and PD2), in order to gain insight into the deregulated processes that might explain the inefficient dopaminergic differentiation in all the GBA-PD organoids (Fig. 4g). Most of the enriched processes were related to neurogenesis and neuronal differentiation, which led us to hypothesize that the defects in neuronal differentiation observed might not be specific to the dopaminergic system but the general neuronal population. Accordingly, we measured the levels of TUJ1+ and MAP2+ cells which are significantly lower at every time point assessed between DIV15 and DIV90 in the PD models (Supplementary Fig. 6a, b), thereby confirming a generalized neuronal deficit in GBA-N370S mutant MOs. These results were confirmed by western blot (WB) analysis of TUJ1 (Supplementary Fig. 6c).
In order to investigate whether the reduction in the neuronal population is already present during the early differentiation process, we evaluated the amount of neuroblast-like cells. These were identified by the expression of doublecortin (DCX), which is expressed during a limited phase in the brain development and is a reliable marker of neurogenesis35,36, and Nestin, a neural stem cell marker whose expression persists in immature neurons37. The proportion of DCX+/Nestin+ cells is significantly decreased in the PD models (Supplementary Fig. 6d, e), confirming that an immature neuronal population is not prevalent in GBA-N370S MOs and there is indeed an impairment in the differentiation process.
Finally, this neuronal differentiation defect was further confirmed by extracellular neuronal activity recordings using a multi-electrode array (MEA), which showed lower electrophysiological activity in patient-specific MOs (Figs. 4h and S6f, g).
To determine if the lower proportion of dopaminergic neurons in patient-specific MOs was simply a consequence of an impaired general neuronal differentiation, we quantified the amount of TH+ neurons and normalized to the total amount of neurons. This analysis confirmed that although general neurogenesis was impaired, the DA system was even more profoundly affected (Fig. 4i). Altogether, these data indicate that the amount of dopaminergic neurons is reduced in patient-derived midbrain organoids, hence recapitulating the major neuropathological feature of PD.
Increased number of neural progenitor cells in GBA-N370S mutant MOs in cell cycle arrest
To better understand the mechanisms leading to decreased amounts of DA neurons, we investigated the genes involved in dopaminergic differentiation (Fig. 5a), among the top 10 DEGs, a downregulation of NR4A (NURR1) was identified, which is a well-known essential transcription factor for the differentiation, maturation, and maintenance of midbrain DA neurons38,39,40. TH expression was equally decreased, consistent with our immunofluorescence and WB data. Additionally, RET receptor tyrosine kinase, was downregulated along with its interactive partners, including GDNF, a known neurotrophic factor (Supplementary Fig. 7a).
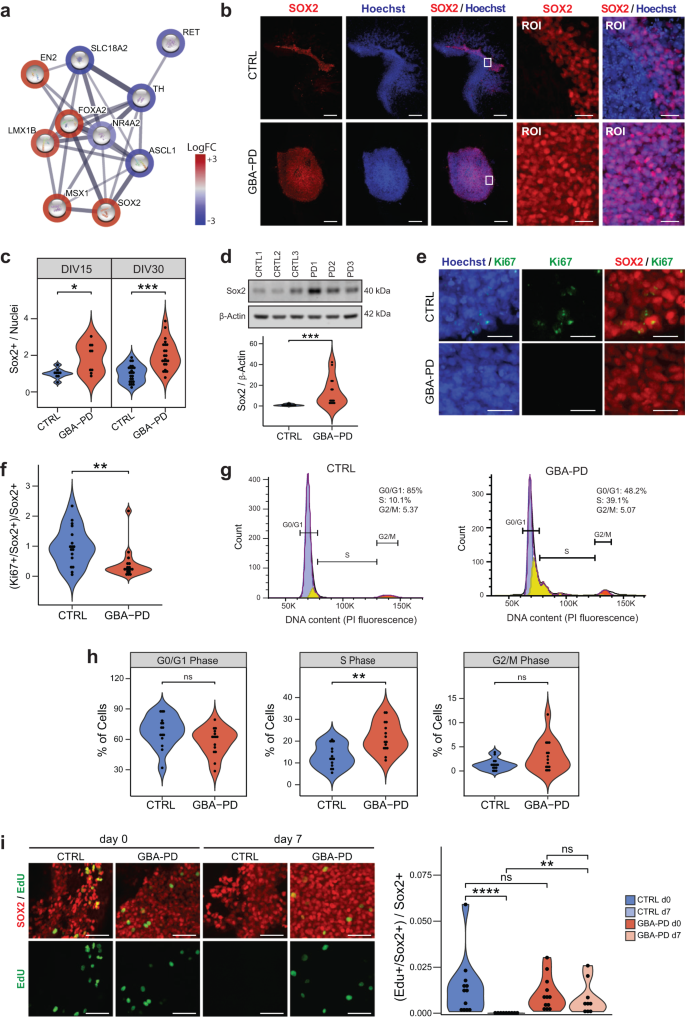
a DEGs involved in dopaminergic differentiation (PathCards) depicted via protein–protein associations obtained from the STRING database. The border of the nodes represents the log fold-change (logFC) of the gene expression in the comparison of control GBA-PD organoids vs controls. Edges depict protein–protein associations. b Representative immunofluorescence staining of SOX2 (red) in midbrain organoid sections at DIV15 (CTRL1 and PD1), along with an amplified region of interest (ROI) of the original. Nuclei stained with Hoechst 33342 (blue), scale bar is 200 μm and 25 μm, respectively. c Quantitative analyses of SOX+ population shows increased proportion of cells expressing the neural stem cell marker in GBA-PD MOs at DIV15 and DIV30. Each data point represents the average of technical replicates for each independent differentiation. Values are normalized to the mean of the controls per experiment. Wilcoxon T-test; *p < 0.05, **p < 0.01, n = 3. d Validation of the immunofluorescence results by immunoblotting against SOX2 in whole cell lysates obtained from organoids at DIV15. The data represent a summary of four independent differentiations. Values are normalized to the mean of the controls per experiment. Wilcoxon T-test; ***p < 0.001. e Representative images CTRL2 and PD2 expressing SOX2 (red) and Ki67(green) at DIV15. Nuclei stained with Hoechst 33342 (blue) (scale bar, 20 μm). f Decreased proportion of proliferative neural stem cells in mutant MOs (DIV30) compared to controls, represented by cells expressing both SOX2 and Ki67. Values are normalized to the mean of the controls per experiment. Wilcoxon T-test; *p < 0.05. g, h Propidium iodide (PI) fluorescence profiles of CTRL3 and PD3 with cell cycle distribution (Watson pragmatic model) (G). Percentage of cells in each cycle phase analyzed by flow cytometry using propidium iodide showing accumulation of cells in the S-phase at DIV30 in GBA-PD organoids. The experiment was repeated five times using organoids from five independent differentiations. Wilcoxon T-test; *p < 0.05. i Representative images (left) of EdU staining (green) for evaluation of the proliferation of SOX+ neural precursors (red) at the day of the exposure (day 0) and 7 days after the initial exposure to EdU (day 7). Images correspond to organoids at DIV30 of CTRL1 and PD1 cell lines (scale bar, 50 μm). Respective quantification (right) of the proportion of neural precursors with a positive signal for EdU showing a significant loss of the EdU staining in CTRL organoids at day 7 after EdU exposure. Data represents a summary of at least three independent differentiation experiments. Kruskal–Wallis with post hoc Dunn tests; **p < 0.01, ****p < 0.0001.
Interestingly, FOXA2 and SOX2 were upregulated (Fig. 5a), both of which are known to be highly expressed in dopaminergic neural progenitors41,42. An increase of FOXA2+ progenitor cells has been reported in MOs from PD patients carrying the LRRK2-G2019S mutation15. This might indicate that although the neural progenitors do not differentiate into neurons, they do not differentiate into other cell types either and remain in an undifferentiated state instead. Thus, we quantified the amount of cells expressing the neural progenitor marker SOX2 (Fig. 5b, c) and FOXA2 (Supplementary Fig. 7b–d), which proved to be significantly higher in GBA-PD organoids compared to controls. We confirmed these results via WB (Fig. 5d) and found SOX2 levels to remain markedly increased at later timepoints as well (Supplementary Fig. 7e). This would indicate a defect in the differentiation of neural stem cells, which probably leads to an enlarged progenitor pool in GBA-PD organoids.
We hypothesized that an upregulation of the neural progenitor population might be a compensatory response to an impaired DA neuron specification, as similar compensatory mechanisms have been reported in PD before43. However, such a response would be accompanied by an increase in organoid size and proliferation markers. Nevertheless, we did not find differences in size between the two conditions throughout the differentiation process (Supplementary Fig. 8a, b). Likewise, we measured the expression of the proliferation marker Ki67 at DIV15 and DIV30 and found no evidence of increased levels in patient-derived organoids (Supplementary Fig. 8c). To exclude that differences were masked by other cell types, we assessed the proliferating neural stem precursors by quantifying cells expressing both Ki67 and SOX2. Surprisingly, we found a decrease in the co-expression of the two markers in patient-specific MOs (Figs. 5e, f and S8d), implying that even though there is a higher proportion of neural progenitors in the GBA-PD condition, they have a lower proliferative capacity. This is an indicator that the progenitors in GBA-PD MOs might be under cell cycle arrest. In the pathway enrichment analysis of the transcriptomics data, we indeed detected several pathways related to cell cycle regulation (Supplementary Fig. 8e). Thus, we analyzed the cell cycle by flow cytometry using propidium iodide (PI) staining. Although we found no differences in the proportions of cells in G0–G1 or G2–M phase, there was a significant accumulation of cells in the S-phase population (Fig. 5g, h). To further monitor S-phase progression, the thymidine analog, EdU (5-ethynyl-2′-deoxyuridine) was used to tag cells in S-phase as it is incorporated into cellular DNA during replication. As expected, immediately after the EdU pulse, the proportion of neural precursors that incorporated the dye was similar between CTRL and GBA-PD DIV30 MOs (Figs. 5i and S9). However, because of dilution through multiple cell divisions, the EdU signal was lost completely in pulse-labeled progenitors of control organoids after 7 days from initial EdU pulse, whereas it was retained in GBA-PD organoids (Figs. 5i and S10), indicating that the neural precursors of patient-derived MOs did not divide and were therefore arrested in S-phase.
Neural progenitors of GBA-PD organoids display signs of oxidative damage and cellular senescence
A common trigger of cell cycle checkpoint activation is DNA damage44, and a significant amount of the damage is caused by reactive oxygen species (ROS)45. Moreover, oxidative stress is known to play an important role in PD pathogenesis, therefore we assessed DNA oxidative damage by measuring the levels of 8-Hydroxydeoxyguanosine (8-OHdG), a major oxidative DNA-damage product45. The levels of 8-OHdG released into the medium was significantly increased in the GBA-N370S condition (Fig. 6a), indicating that patient-derived MOs are under severe oxidative stress, thereby restraining the cell cycle progression.
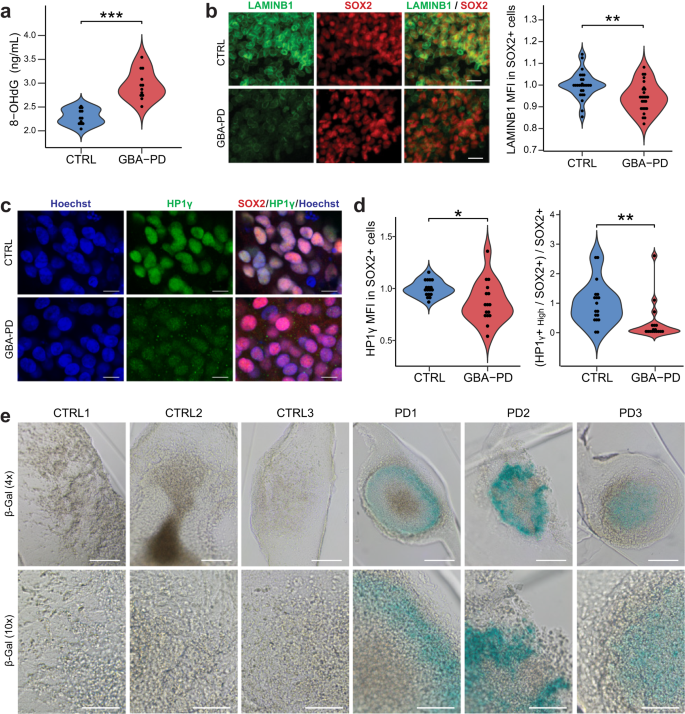
a Extracellular concentration of 8-OHdG in DIV30 organoids measured by ELISA. The data represent a summary of four independent differentiation experiments for all cell lines. Wilcoxon T-test; ***p < 0.001. b High content automated image analysis showed decreased MFI of LAMINB1 (green) within Sox+ population (red). Data is a summary of eight independent differentiation experiments, normalized to the average of controls per organoid batch. Wilcoxon T-test; **p < 0.01 (scale bar, 20 μm). c, d Representative images of HP1γ (green) and SOX2 (red) in CTRL2 and PD2 organoid sections acquired at 60× (C) (scale bar, 10 μm). Quantification of MFI of HP1γ within the SOX2+ population (D left) and proportion of neural precursor cells (SOX2+) expressing high levels of HP1γ (D right) in DIV30 organoid sections acquired at 20× using the automated image analysis pipeline. Data represents a summary of five independent differentiation experiments normalized to the mean of the controls per batch. Wilcoxon T-test; *p < 0.05, **p < 0.01. e Senescence-associated β-galactosidase staining (blue) of DIV30 organoids (scale bar, 200 μm, 4×; 100 μm, 10×).
Persistent DNA damage response may result in a permanent cell cycle arrest, leading to cellular senescence46,47. A well-established marker for senescence is the loss of nuclear LAMINB148. Accordingly, we quantified the expression of nuclear LAMINB1 in the neural precursor population and were able to detect a significant decrease (Figs. 6b and S11). The senescent phenotype is associated with the loss of heterochromatin, which can be assessed by immunostaining of heterochromatin protein 1 gamma (HP1γ)49,50. Organoids from GBA-PD patients present a lower mean fluorescence intensity (MFI) than control-derived organoids (Figs. 6c, d left and S12a), despite the presence of a bright dotted pattern in GBA-PD MOs resembling senescence-associated heterochromatin foci (SAHF)51, which is absent in control MOs (Supplementary Fig. 12b, c). When the threshold of the image analysis quantification was adjusted to account for this, in order to identify a population that uniformly expresses high levels of HP1γ, the decrease in GBA-PD MOs became more significant (Fig. 6d right). Moreover, the activity of the lysosomal enzyme beta-galactosidase (β-gal) is commonly used as a marker for senescent cells52 and increased activity of this enzyme in GBA-PD MOs was already shown in (Supplementary Fig. 3b). To confirm these results, we performed senescence-associated beta-galactosidase (SA-β-gal) staining, showing an accumulation of SA-β-gal positive cells in GBA-PD organoids (Fig. 6e).
Collectively, these data suggest that GBA-N370S mutation causes cell cycle arrest and cellular senescence in neural progenitor cells, resulting in impaired neurogenesis.
- SEO Powered Content & PR Distribution. Get Amplified Today.
- PlatoData.Network Vertical Generative Ai. Empower Yourself. Access Here.
- PlatoAiStream. Web3 Intelligence. Knowledge Amplified. Access Here.
- PlatoESG. Carbon, CleanTech, Energy, Environment, Solar, Waste Management. Access Here.
- PlatoHealth. Biotech and Clinical Trials Intelligence. Access Here.
- Source: https://www.nature.com/articles/s41531-023-00616-8