Pathological features of TNBC patients.
Total 190 patients serum samples (TNBC = 139 and Healthy = 51) were used in the present study. The age of patient’s ranges between 39 to 60 years. The 139 TNBC cases includes 35 stage-I (25.1%), 43 stage-II (30.9%), 31 stage-III (22.3%), and 30 stage-IV (21.5%) samples. Further we built three different cohorts based on 139 TNBC samples stages and their clinicopathological features. Cohort-I consists of all TNBC (n = 139) and control (n = 51) samples irrespective of stages, cohort II consist of stage I + II TNBC cases (n = 78; 56.11%), while cohort III consist of stage III + IV TNBC cases (n = 61; 43.8%). Moreover, Samples were bifurcated by metastatic nature (74 metastatic (53.2%) and 65 non-metastatic (46.7%) and menopausal status (91 patients had menopause (65.4%), while 48 patients were in a premenopausal state (34.5%)). The overall patient clinical features are elaborated in Table 1.
Selection of miRNA
We performed In-Silico analysis for the identification of miRNA exclusively associated with breast cancer study. Therefore, miRNA association with the disease was evaluated using three independent online databases (miRDB. TargetScanHuman7.2, miRnet 2.0). As a result, 510 miRNA were significantly enriched in breast cancer (padj-value < 0.05) (Fig. 2a.). The significantly enriched overlapping common miRNA from each database were sorted. Further, we set queries “only to TNBC subtype” and common miRNA (n = 210; padj < 0.05) were used to build the miRNA-disease enrichment network analysis with default parameter using miRNet 2.0 a freely available online tools (www.mirnet.ca)22. Based on betweenness, enrichment score, and padj-value (padj < 0.05) we selected three candidate miRNA (miRNA-205, miRNA-155, and miRNA-21) for further analysis. Before moving ahead we also reviewed the recently published paper confirming the role of dysregulated miR-205, miR-155 and miR-21 in TNBC progression. Selected candidate miRNAs were evaluated for target enrichment analysis using miRnet 2.0 tools. The result of this analysis helps us to identify the putative target genes of miRNA exclusively associated with breast cancer disease progression. More than 7000 genes were enriched in our analysis, and upon applying the filter (exclusively in breast cancer and Padj < 0.05), only 250 genes showed to have significant enrichment scores with TNBC (Fig. 2b), and genes such as E2F2, EGFR, PTEN, STAT3, BCL2, HOXA9, and AGO2 shown to have higher log2FC with a padj-value and betweenness score in the enriched network (Fig. 2b).
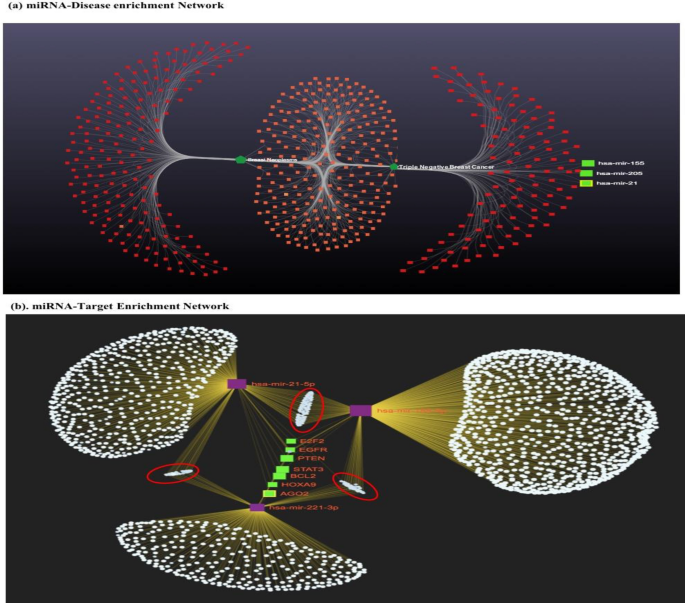
Represents bioinformatics based miRNA-disease enrichment, Target enrichment and function annotation of selected miRNA-Target genes in breast cancer (a) miRNA-disease enrichment analysis revealed miRNA-205, miRNA-155 and miRNA-21 was significantly enriched in breast cancer (based on betweenness, enrichment score and padj < 0.05) and (b) Highly enriched candidate miRNA-target genes are presented in green colour (padj < 0.001) and other significantly enriched genes are marked in red circle (padj < 0.05). The disease network analysis and miRNA-Target enrichment analysis was performed using miRNet 2.0 online tools (www.mirnet.ca), and the statistical analysis was performed using R programming based package of miRNet 2.0 available on GitHub.
Functional annotation of selected miRNA in breast cancer progression
After the selection of miRNA and Targets enrichment, we performed functional annotation of miRNA-Target genes (KEGG and Gene Ontology) using the DAVID database(https://david.ncifcrf.gov/)23. Functional annotation could reveal the association of miRNA-Target genes in breast cancer progression. KEGG Pathway enrichment analysis revealed eight pathways ‘Pathways in cancer’, ‘PI3K-Akt signalling pathway’, ‘miRNA in cancer’, ‘MAPK signalling pathway’, ‘Hepatitis B’, ‘Salmonella infection’, and ‘Breast cancer’ were highly enriched terms (Fig. S1). Similarly, Gene Ontology (GO) analysis revealed top ten terms in each Biological process (BP), Cellular Component (CC) and Molecular Function (MF). Most importantly, cytosol (GO:0,005,829), regulation of transcription from RNA polymerase II promoter (GO:0,006,357), negative regulation of gene expression (GO:0,010,629), metal ion binding (GO:0,046,872), and RNA binding (GO:0,003,723) were highly enriched terms in MF, CC and BP of Gene Ontology (Fig. S2).
Relative expression analysis of candidate miRNA
The quantitative expression analysis of miRNA (miRNA-205, miRNA-155, and miRNA-21) was performed by RT-qPCR in TNBC and in contrast to control samples. In cohort-I (TNBC = 139, control = 51), the expression level of miRNA-155 and miRNA-21 was overexpressed, and miRNA-205 was downregulated in TNBC cases with respect to controls samples with a fold change of 7.26 (P < 0.0001), 6.05 (P < 0.0001), − 7.03 (P < 0.0001) respectively (Fig. 3a). In cohort-II (Stage I + II; TNBC = 78, control = 51), the expression of miRNA-155 and miRNA-21 was overexpressed, and miRNA-205 was downregulated in TNBC cases with respect to controls with a fold change of 5.21 (P < 0.0001), 4.68 (P < 0.0001), and − 5.30 (P < 0.0001), respectively (Fig. 3b). Similarly, In cohort-III (stage III + IV; TNBC = 61, control = 51), the expression of miRNA-155 and miRNA-21 was significantly overexpressed, and miRNA-205 was downregulated in TNBC cases with respect to controls with a fold change of 9.89 (P < 0.0001), 7.93 (P < 0.0001), − 9.24 (P < 0.0001), respectively (Fig. 3c).
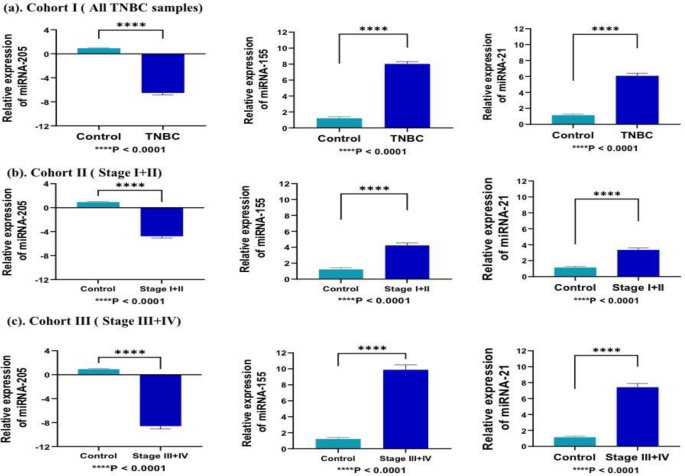
Represents relative expression of selected miRNA in different cohorts compared to healthy patients samples. (a) In cohort-I (TNBC = 139, control = 51), miR-155 and miRNA-21 significantly overexpressed (7.26; P < 0.0001, and 6.05; P < 0.0001)., while miRNA-205 was downregulated (− 7.03; P < 0.0001) in all TNBC samples as compared to control (b) In cohort-II (TNBC = 78, control = 51), miRNA-205 was downregulated, while, miR-155 and miRNA-21 significantly overexpressed in early stage (stage I + II) samples as compared to control with fold change of − 5.30 (P < 0.0001), 5.21 (P < 0.0001), and 4.68 (P < 0.0001), respectively (c) In cohort-III(TNBC = 61, control = 51), miRNA-205 was downregulated, while, miR-155 and miRNA-21 significantly overexpressed in late stage (stage III + IV) samples as compared to control with fold change of − 9.24 (P < 0.0001), 9.89 (P < 0.0001), and 7.93 (P < 0.0001), respectively. Statistical significance was determined by p < 0.05 by Mann Whitney U-test. Data represented as mean and standard deviation, ****P < 0.0001.
Evaluation of diagnostic potential of candidate miRNA
Further, to predict the diagnostic potential of miRNA, built separate model for each of the cohorts using R-software. The model was based on Stratified K-Fold Cross-Validation framework implying the multivariate binary logistic regression analysis. For each cohort, we built separate model where randomly 75% of data were selected for training dataset while remaining 25% of data was used for validation in test dataset. Each trained model of respective cohort (cohort-I, cohort-II and cohort-II) was exposed to test dataset and performance of model was evaluated. The performance of model from cohort-I to predict TNBC was found to have 73.47% accuracy, 0.445 kappa value with statistical significance (p < 0.05). Similarly, the cohort-II have accuracy of 84.22% with 0.711 kappa value while cohort-III showed to have 69.32% accuracy with 0.324 kappa value (Table 2). Since, our model for each cohort doesn’t showed any overfitting issue we further moved to analyse the association of each miRNA in disease progression, for this the multivariate regression analysis of each model was evaluated. In our k-fold regression model, miRNA-205, miRNA-155, and miRNA-21 were coupled with disease outcome in each of the tested cohorts with p < 0.05. During analysis, the 95% CI was used as the accuracy of regression coefficients, while statistical significance was denoted as a p-value (P < 0.05) (Table 3).
Next, we evaluated the diagnostics capability of each individual miRNA from each cohort using ROC curve analysis. The diagnostic capability of miRNA was measured as AUC, sensitivity, and specificity with an optimal cut-off value at 95% CI. In cohort-I, the AUC, sensitivity, specificity of individual miRNA-205, miRNA-155, and miRNA-21 was 81.9% (sensitivity = 77.5%, specificity = 66.4%), 87.0% (sensitivity = 87.7%, specificity = 63.7%), and 86.9% (sensitivity = 79.0%, specificity = 64.5%) (Fig. 4a). Moreover, in cohort-II the AUC, sensitivity, specificity of individual miRNA-205, miRNA-155, and miRNA-21 was 83.3% (sensitivity = 84.6%, specificity = 82.5%), 85.8% (sensitivity = 84.1%, specificity = 81.3%), 89.9% (sensitivity = 88.5%, specificity = 80.4%) (Fig. 4b). While, in cohort-III the AUC, sensitivity, specificity of individual miRNA-205, miRNA-155, and miRNA-21 was 84.3% (sensitivity = 86.9%, specificity = 82.4%), 84.7% (sensitivity = 90.2%, specificity = 80.4%), and 80.0% (sensitivity = 95.1%, specificity = 72.5%) (Fig. 4c).
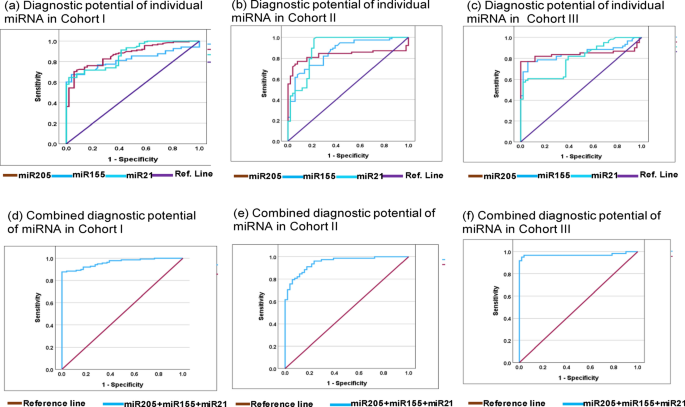
Represents ROC curve analysis of individual miRNA and miRNA-panel toward diagnosis of Triple negative breast cancer. (a) Represent diagnostic potential of individual miRNA-205, miRNA-155 and miRNA-21 in cohort-I with AUC at 95% CI was 81.9% (0.761–0.876 ), 87.0% (0.819–0.921 ), and 86.9% (0.919–0.920) respectively. (b) Represent diagnostic potential of individual miRNA-205, miRNA-155 and miRNA-21 in cohort-II with AUC at 95% CI was 83.3% (0.756–0.909), 85.8% (0.794–0.923), and 89.9% (0.839–0.960) respectively. (c) Represent diagnostic potential of individual miRNA-205, miRNA-155 and miRNA-21 in cohort-II with AUC at 95% CI was 84.3% (0.758–0.928), 84.7% (0.770–0.923), and 80.0% (0.720–0.880) respectively. (d) Represents combined diagnostic potential of miRNA-205 + miRNA-155 + miRNA-21 in cohort-I with AUC at 95% CI was 96.1% (0.938–0.985). (e) Represents combined diagnostic potential of candidate miRNA with AUC at 95% CI was 94.9% (0.915–0.983). (f) In cohort-III, the combined diagnostic potential candidate miRNA with AUC at 95% CI was 97.1% (0.933–1.009). AUC area under curve, SEN sensitivity, SPE specificity.
In addition, we evaluated the combined diagnostic capabilities of miRNA-205, miRNA-155, and miRNA-21 from each cohort. Therefore, predicted probability of each model was used to evaluate the diagnostic potential of miRNA-panel in predication of TNBC using ROC-AUC analysis. The combined diagnostic value of miRNA-205, miRNA-155, and miRNA-21 in cohort-I was AUC = 96.1% (sensitivity = 89.9%, specificity = 85.6%) (Fig. 4d). Similarly, in cohort-II, the combined AUC was 94.9% (sensitivity = 91.0%, specificity = 82.3%) (Fig. 4e), while, in cohort-III, the AUC was 97.1% with 96.7% of sensitivity and 81.2% of specificity (Fig. 4f). The detailed diagnostic potential of individual and combined miRNA panel is elaborated in Table 4.
Comparative analysis of miRNA expression with different pathological features in TNBC cases
Further, we evaluated the expression pattern of candidate miRNA in different clinicopathological features, including stages, metastases, and menopausal status of patients. Relative expression of miRNA-155 and miRNA-21 was significantly upregulated, while miRNA-205 was downregulated in combined stage III + IV, with fold changes of 9.89, 7.99, and − 9.24 compared to combined stage I + II with a fold change of 5.2, 4.64 and − 5.30, respectively with significant P value (P < 0.001) and can discriminate between late stage patients of TNBC with early-stage patients (Fig. 5a). Similarly, metastatic samples show higher expression of miRNA-155, and miRNA-21 compared to non-metastatic samples with greater fold change and significant P-value (P < 0.0001), while miRNA-205, was negatively expressed in metastatic samples (P < 0.0001) (Fig. 5b). In addition, miRNA-205, miRNA-155, and miRNA-21 expression were not significant in the menopausal status of patients compared to the non-menopausal status of patients.
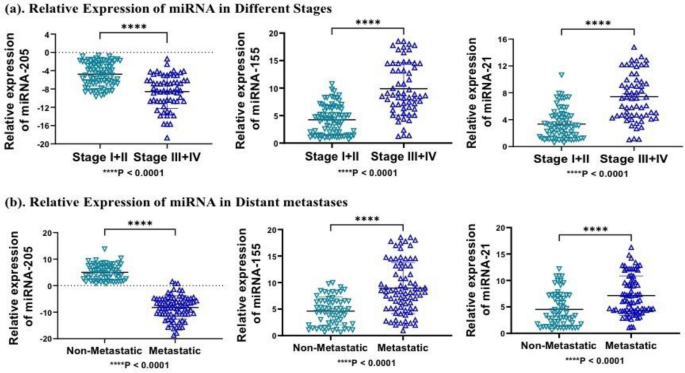
Represents relative expression of miRNA in different stages and distant metastatic nature of samples (a) miRNA-205, miRNA-155 and miRNA-21 was significantly overexpressed in combined stage III + IV compared to stage I + II (P < 0.0001). (b) Similarly, miRNA-205, miRNA-155 and miRNA-21 was significantly overexpressed in metastatic samples compared to non-metastatic samples (P < 0.0001). Statistical significance was determined by p < 0.05 by Mann Whitney U-test. Data represented as mean and standard deviation, ****P < 0.0001.
Further, samples were bifurcated according to patient’s clinicopathological features such as age, distance metastasis, and menopausal status and we evaluated the dysregulated expression of the each miRNA in individual parameter. This analysis would tell us how does miRNA behave in each pathological condition. Further, we applied Spearman’s rank-order correlation analysis to evaluate the correlation between change in expression of miRNA with each pathological features. In cohort-I, expression level of miRNA-205, miRNA-155, and miRNA-21 showed to have significant negative correlation with the age (r = − 0.224, r = − 0.382, r = − 0.386), while positive correlation with menopausal status (r = − 0.408, r = 0.288, and r = 0.645), and distance metastasis (r = 0.312, r = 0.309, and r = 0.532). In cohort-II, the expression of miRNA-205, miRNA-155, and miRNA-21 showed negative correlation with age (r = − 0.564, r = − 0.280, r = − 0.226), while positive correlation was seen with menopausal status (r = 0.221, r = 0.178, and r = 0.243) and distance metastases (r = 0.243, r = 0.321, and r = 0.379. Similarly, in cohort-III, all candidate miRNA (miR-205, miR-155 and miR-21) showed a strong negative correlation with age (r = − 0.398, r = − 0.266, and r = − 0.321), while miRNA-205, miRNA-155, and miRNA-21 showed a strong positive correlation with menopausal status (r = 0.462, r = 0.388, and r = 0.427) and distant metastases (r = 0.639, r = 0.765, and r = 0.785) respectively (Table 5).
- SEO Powered Content & PR Distribution. Get Amplified Today.
- PlatoData.Network Vertical Generative Ai. Empower Yourself. Access Here.
- PlatoAiStream. Web3 Intelligence. Knowledge Amplified. Access Here.
- PlatoESG. Carbon, CleanTech, Energy, Environment, Solar, Waste Management. Access Here.
- PlatoHealth. Biotech and Clinical Trials Intelligence. Access Here.
- Source: https://www.nature.com/articles/s41598-023-48896-7