Single-cell multidimensional mass cytometry identifies distinct cardiac fibroblast subpopulation expressing mesenchymal and lymphoid markers
Although several inflammatory subsets have been identified in the myocardium, the role of resident cardiac fibroblasts in the promotion of inflammation remains unclear. Recent studies in human cardiac fibroblasts isolated from patients with heart failure show that these cells are immunocompetent24. We sought to characterize pro-immune features of cardiac fibroblasts through immunophenotyping with multiparametric mass cytometry, a method that categorizes cell populations into lineages based on marker expression (Fig. 1a). We also independently established the identity of commercially sourced and validated human primary ventricular cardiac fibroblasts (hVCF), with multiple fibroblast markers αSMA, vimentin, collagen-1, FSP-1, PDGFRβ, periostin and endothelial cell marker, VE-cadherin27. While >90% of the cells were positive for all fibroblast markers and negative for the endothelial cell marker, VE-cadherin, <2% PDGFRβ-positive cells were negative for FSP-1, and some FSP-1-positive cells were negative for PDGFRβ (Supplementary Fig. S1a)28,29,30,31. FSP-1 is also expressed by immune cells and endothelial cells and therefore is not a specific fibroblast marker32,33,34. It has been suggested that all myeloid and lymphoid cells are bone marrow-derived and play a prima facie role in inflammation, repair and tissue regeneration35. However, recent evidence suggests that tissue-resident cells including CCR2+ macrophages may, in fact, initiate inflammatory processes36. In the setting of myocardial injury, cardiac fibroblasts may epigenetically assume a pro-inflammatory phenotype and secrete cytokines, whereas chemokines may recruit macrophages and lymphocytes before the arrival of the bone marrow immune cells3. By staining single-cell suspensions of 3 human male and female donors (all clinical information is provided in Supplementary Table S1) immune lineage markers in the CYTOF panel (Supplementary Table S2), we identified in all human donors a subpopulation of cardiac fibroblasts phenotypically distinct from the central cluster of homogenous cells, which expresses Vimentin, αSMA and CD4, a hallmark T-helper cell marker (Fig. 1b; red dotted lines, Supplementary Fig. S2a–d). Manual gating of the isolated population of cells and re-application of the viSNE algorithm to qualitatively visualize the expression of markers at a single-cell level provided high-resolution maps of the cardiac myofibroblast markers, αSMA and Vimentin (Fig. 1b), along with lymphoid lineage markers, CD4, CCR6, and CD183 (Fig. 1c). Myeloid CD68+ cells (<6%) and HLA-DR+ dendritic cells (<0.8%) were also identified to a lesser extent (Supplementary Fig. S8). Consistent with the viSNE algorithm, a uniform manifold approximation and projection (UMAP) non-linear dimensionality reduction algorithm also showed the same distinct cell population (Fig. 1d). This approach profiled human cardiac fibroblast cells in isolation as opposed to bulk transcriptomic profiling that can miss smaller populations37,38. Measures were taken to ensure that the populations being analyzed were free from beads and only live, nucleated single cells were manually gated, as presented in Supplementary Fig. S1b, c.
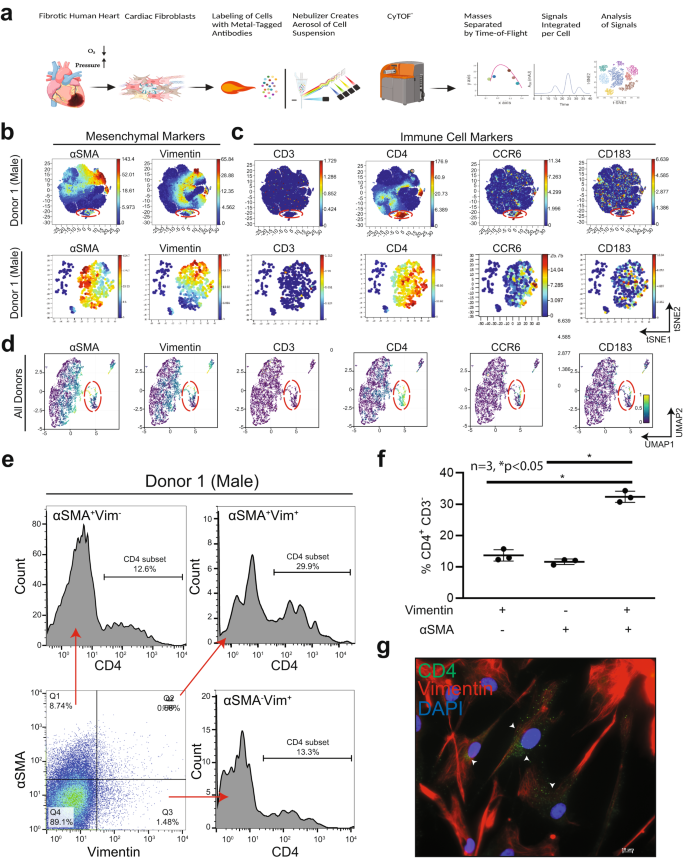
Immunophenotyping of hVCFs derived from human subjects (2 males (ID# 62122, ID# 1281202) and 1 female (ID#534282)) was performed by staining 3 × 10⁶ cells with heavy metal-tagged antibodies, followed by mass cytometry to identify frequencies of populations in human cardiac fibroblasts. a Schematic summary of mass cytometry analysis. hVCFs were immunostained with epitope-specific antibodies conjugated to transition element isotope reporters of different masses. The cells were nebulized into single-cell droplets, followed by the acquisition of an elemental mass spectrum. Conventional flow cytometry methods were used to analyze integrated elemental reporter signals for each cell. This diagram was drawn exclusively by the authors using BioRender (Toronto, Canada) under the aegis of an academic license with Brown University. b viSNE graphs of manually gated live, nucleated, hVCF cell clusters expressing varying marker intensities and distribution for a representative donor showed a subpopulation of cells (island) distinct from the majority of cardiac fibroblasts marked by the expression of Vimentin and αSMA+. c The hVCFs expressing cluster of differentiation (CD) CD4, CCR6, and CD183 associated with lymphoid cells on hVCF. Protein expression levels are demonstrated on the secondary y-axis scale with blue showing no expression, green, the least expression, and red, the highest expression. Each dot represents the expression profile of a single cell. The red box shows the newly identified population separated from the rest of the cell cluster. Bottom panel of (b) and (c) are the viSNE of viSNE after gating the newly identified population. d UMAP-based clustering of the cells showing the distinct population of cells isolated from the main cluster of homogenous cardiac fibroblast cells. e Representative flow cytometry histograms showing frequencies of CD4+ subset of αSMA+Vim+ hVCFs for all the human donor cells. f Quantification of CD4+ CD3− cells gated from Vimentin+αSMA−, Vimentin−αSMA+ and Vimentin+ αSMA+ populations is represented as a scatter plot of Mean ± SD (n = 3 biological replicates, 2 males and 1 female); *P < 0.05, as determined using one-way ANOVA and Tukey’s post-hoc multiple comparison. g Representative hVCF cells immunostained CD4, Vimentin and DAPI antibodies showing co-expression of Vimentin and CD4. Scale bars are 20 µm.
Quantification of the cells showed that 29.6% of the total cells were Vimentin+αSMA+CD4+, 11.91% ± 2.32% cells of the total cells were Vimentin+αSMA−CD4+ resident cardiac fibroblasts, and 10.53% ± 2% of the total cells were αSMA+Vimentin−CD4+ activated cardiac fibroblasts (Fig. 1e, f) indicating that this cell population expresses different levels of αSMA or Vimentin or CD4 or their combinations. The data for the remaining donors are presented in Supplementary Figs. S4–S7. Finally, we validated the expression of CD4 in Vimentin+ primary human cardiac fibroblast cells by immunostaining and found a punctate staining pattern of CD4 in one or two Vimentin-positive cells (Fig. 1g). To eliminate ambiguity associated with staining artifacts, CD4 antibody specificity was tested by immunostaining of rat spleen sections and blood samples using flow cytometry (Supplementary Fig. S3c). To exclude the possibility of contaminating T-cells, the cells were cultured in fibroblast growth media for at least two to three passages. Besides size-based exclusion, strongly adherent cardiac fibroblasts were washed several times to ensure that any loosely adhered immune cells were removed. Based on these data, we report the presence of a resident primary human ventricular cardiac fibroblast subpopulation that co-expresses mesenchymal vimentin+αSMA+ and the helper T-cell marker, CD4.
Distribution and expression of spindle-shaped αSMA+ CD4+-co-expressing cells in the fibrotic right ventricle (RV) of patients with pulmonary arterial hypertension (PAH)
Following the identification of a CD4+ human ventricular cardiac fibroblast (hVCF) subpopulation in vitro using mass cytometry, we determined the clinical relevance of this population by mapping the distribution and expression of αSMA+CD4+ cells in autopsy specimens of patients diagnosed with RV fibrosis and PAH. The clinical history and autopsy diagnosis of all the donors designated as either the PAH group or the no PAH group are presented in Supplementary Table S4. Global tissue analysis with Hematoxylin and Eosin (H&E) staining showed variable amounts of cardiac myocyte hypertrophy and age-associated fibrosis in interstitial, perivascular, and subendocardial locations in all donors (Fig. 2a). Sirus red staining identified specific collagen-rich regions and bands of interstitial and subendocardial fibrosis surrounding the myocytes (Fig. 2a). The posterior papillary muscle of the RV showed interstitial fibrosis typical of fibrotic remodeling. The endocardial surfaces of the RV showed hypertrophic changes with big “boxcar” nuclei, hypertrophic cardiac myocytes, subendocardial and interstitial fibrosis, with entrapped cardiac myocytes in the areas of fibrosis (Fig. 2a). To determine the localization of αSMA+CD4+ cells in the diseased RV, we co-stained formalin-fixed tissues using human-specific αSMA and CD4 antibodies. We noted αSMA cells with a spindle-shaped morphology and membranous CD4 staining in the perivascular connective tissue in cases with minimal interstitial fibrosis and in the dense fibrous tissue but not in non-fibrous tissue (Fig. 2a). Moreover, we found significant increases in spindle-shaped cardiac fibroblasts expressing both αSMA and CD4 in the fibrotic regions compared to the nonfibrotic regions of preserved autopsy RV tissue in humans with a clinical diagnosis of RV hypertrophy and dilation, compared to RVs from those without an autopsy diagnosis of PAH (Fig. 2b). Cells with a round shape and membranous CD4 staining typical of traditional T-cells were predominantly identified inside capillaries (Fig. 2b). Human autopsy tissue is relevant for understanding fibrotic features that phylogenetically distant rodent models fail to fully replicate39. We generally observed a higher frequency of cell populations expressing αSMA and CD4 in the human fibrotic tissue compared to tissue obtained from rats and mice having a smaller proportion of cardiac fibroblasts compared to humans.
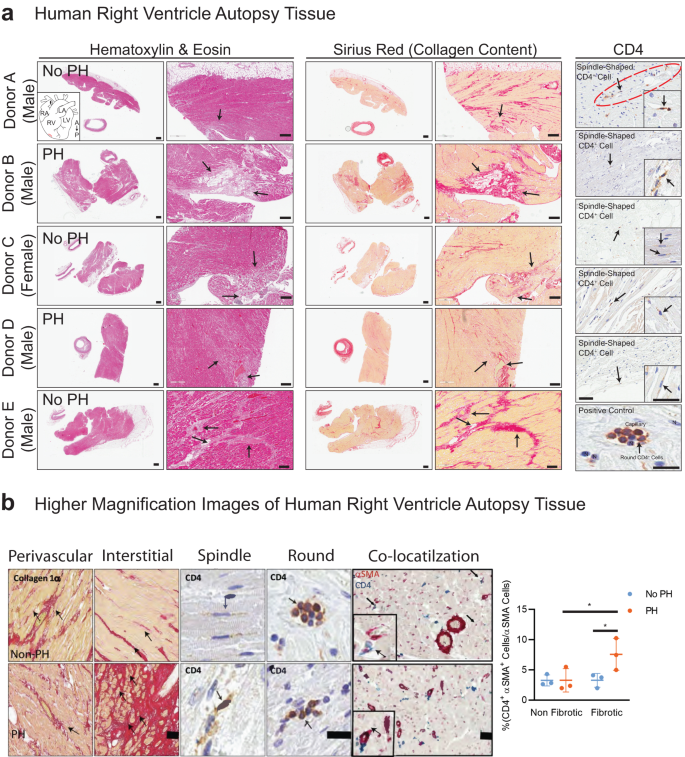
a Human right ventricular tissues from 5 autopsied donors diagnosed with other conditions (Donor A, C and E) or PH (Donor B, D and F) were stained with standard hematoxylin & eosin (H&E) and Sirius Red. Donors A-E were immunostained for CD4 and counterstained with methyl green to identify nuclei. Donor F was used as a negative control for CD4 immunostaining. The black arrows point to fibrotic areas in H&E-, Sirius Red- and CD4-stained sections. CD4+ expressing spindle-shaped cells in the RV of donor tissue was determined; arrows point to CD4+ spindle-shaped cells. b Magnified images of Sirus red staining, CD4 staining (brown) and CD4/αSMA dual-staining in human RV. Arrows indicate the spindle-shaped cells expressing CD4. Quantification of CD4+αSMA+ cells in nonfibrotic and fibrotic regions in the human RV determined by a pathologist blinded to the groups. Scale bars, 75 µm. *P < 0.05, one-way ANOVA and Tukey’s multiple comparison test. Quantification of CD4+/αSMA+ manually by a double-blinded observer from at least 15–20 sections/slide for n = 6 samples (*P < 0.05), one-way ANOVA and Tukey’s multiple comparison test; Nonfibrotic vs. Fibrotic and no PH vs. PH. Scale bars are 10 µm.
Distribution and expression of spindle-shaped αSMA+ CD4+ co-expressing cells in the fibrotic RV in rats treated with SUGEN/hypoxia
Genetic lineage tracing studies show that resident cardiac fibroblasts derived from a subset of endocardial cells through endoMT mediate pressure overload-induced fibrosis in mice31. To determine the role of αSMA+ CD4+ co-expressing cells in myocardial fibrosis, we utilized Fischer rats genetically prone to develop PAH as a model of inducible cardiac fibrosis40. Fischer rats were treated with a single intraperitoneal injection of the VEGF inhibitor SUGEN (25 mg/kg) and then subjected to 3 weeks of hypoxia (Hx), followed by 5 weeks of normoxia (Nx) (Fig. 3a). We noted significant increases in the expression of Collagen I/III in both perivascular and interstitial regions in rat RV and LV sections, as determined by Sirius red staining and Masson trichrome staining (Fig. 3b). Control animals were injected with vehicle and housed in room air or Nx for 8 weeks. The SUGEN/Hypoxia rats had lower body weights compared to control rats (Fig. 3c). Fulton index measured from the RV and LV weights using the formula (RV/LV+S) was not significantly increased (Fig. 3d), however, tricuspid annular plane systolic excursion (TAPSE) shows a trend toward reduction in SUGEN/Hypoxia-treated rats (Fig. 3e). None of the other echocardiographic parameters measured, such as cardiac output, ejection fraction, and mean pulmonary arterial pressure, differed significantly from controls. Further, changes in cardiac fibroblast number and localization in response to SuHx treatment were determined using the fibroblast marker FSP-1 (Supplementary Fig. S10a, b).
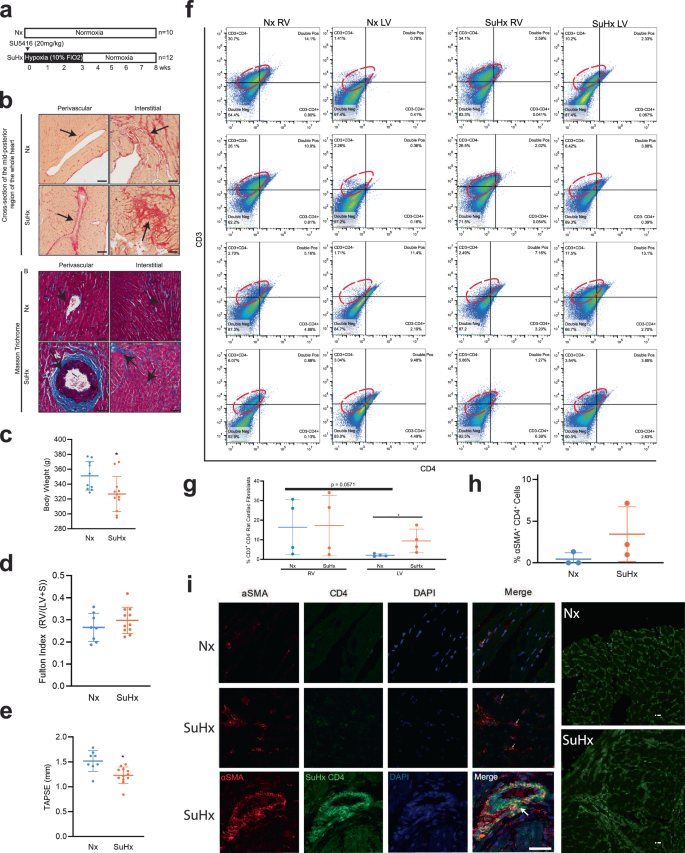
a Schematic representation of SUGEN/hypoxia for simulating PH in rats. Male Fischer rats were given a single bolus of SUGEN (20 mg/kg) and exposed to hypoxia (10% FiO2) for 3 weeks, followed by exposure to normoxia (Nx) for an additional 5 weeks (SuHx). In parallel, control animals were exposed to Nx (room air) for 8 weeks. The Nx and SuHx groups were comprised of n = 10 and n = 12 rats, respectively. Quantification of TAPSE trace measured using M-mode echocardiography is presented for Nx and SuHx rats. The Fulton index was determined from the weight of the RV and LV + septum. b (Top). Representative images of collagen content in the perivascular or interstitial RV and LV indicated by the Sirius Red-positive regions in the transverse region of Nx and SuHx rats (10 µm thickness), whole heart section cut transversely at the mid-ventral region and perivascular and interstitial regions of both Nx and SuHx animals. (Below) Representative images of Masson trichrome staining the whole heart section and perivascular and interstitial regions of both Nx and SuHx animals. Arrows suggest collagen I-rich regions. Scale bars are 10 µm. c Body weight of Nx and SuHx in grams is represented. d Fulton Index of Nx and SuHx is represented. Values are mean ± SD (n = 10 rats), unpaired t-test. e TAPSE of Nx and SuHx animals measured using echocardiography. Values shown as the mean ± SD (n = 10), unpaired t-test. f 2D plots depicting cell cytometry of CD3−CD4−, CD3+CD4−, CD3−CD4+, and CD3+CD4+ in cardiac fibroblasts following induction of hypoxia in the RV and LV of Nx and SuHx animals, with CD3 shown on the vertical axis and CD4 shown on the horizontal axis. The specific CD3+CD4− population is encircled by an interrupted red line on each graph. g Quantification of CD3+CD4− cells in the RV and LV under Nx and SuHx conditions derived from cell cytometry is shown. h αSMA+CD4+ cardiac fibroblast cells following induction of hypoxia protocol in the right and left ventricle of Nx and SuHx animals. i High magnification of the perivascular region of Nx, SuHx, and SuHx (x 40) RV tissue expressing αSMA+ (red), CD4+ (green), and DAPI (blue). Collagen I staining shows the collagen expression in the fibrotic regions of Nx and SuHx ventricle (Right panel). Scale bar is 10 μm.
To determine the percentage of cardiac fibroblasts expressing CD4 in the right and left ventricle of rat hearts in response to SUGEN/Hypoxia (SuHx), we quantified CD3+ CD4− and CD3+CD4+ primary cardiac fibroblasts populations isolated from the RV and LV of Nx and SuHx rats using flow cytometry (Fig. 3f). CD3+CD4− cardiac fibroblast populations were elevated in RV under both Nx (16.39% ± 14.06%) and SuHx conditions (17.24% ± 15.46%) compared to CD3+CD4+ and were found to be less prominent in LV, under both Nx (2.10% ± 0.71%) and SuHx conditions (9.41% ± 6.04%) (Fig. 3g). In the LV, the percentages of CD3+ CD4− cardiac fibroblasts were higher in the SuHx conditions and trending toward significance compared to Nx conditions (2.10% ± 0.71% vs 9.41% ± 6.04%, P = 0.053). Percentages of CD3+CD4+ populations expressing cardiac fibroblast cells showed some increase in RV (5.79% ± 4.92%) under SuHx conditions in comparison to Nx, (5.50% ± 5.75%) although it did not reach significance (Fig. 3g). In the RV, there is no change in the percentage of CD3+ CD4− cardiac fibroblast population after treatment with SuHx. In the LV, there is an increase in the percentage of CD3+ CD4− cardiac fibroblast population after treatment with SuHx (Fig. 3g). Next, we quantified the number of cardiac fibroblasts co-expressing αSMA+CD4+ cells that accompanied fibrotic changes in the RV of Nx and SuHx rats using confocal microscopy (Fig. 3h). We found three cell populations: T-cells (αSMA− CD4+), cardiac fibroblasts (αSMA+CD4−), and cardiac fibroblasts expressing CD4 (αSMA+CD4+) in rat RV (Fig. 3i). Two distinct morphologies of conventional CD4 cells, round αSMA+CD4+ and spindle-shaped αSMA+CD4+ were noted in the RV regions, both which were significantly increased in SuHx compared to Nx rats (Fig. 3i). The number of αSMA+CD4+ cells tended to be higher in the perivascular fibrotic regions of the RV of SuHx rats compared to control.
Shifts in human cardiac fibroblast cell population lineages in response to recombinant IL-1β
Identification of CD4-expressing cardiac fibroblasts in both human and rat RV prompted us to explore possible mechanisms underlying the induction of CD4 expression in cardiac fibroblasts. PAH patients have high levels of plasma IL-1β that correlate with the severity of PAH41,42, and reduction of IL-1β reduces inflammation and improves right heart function42. Based on these and related findings43,44,45,46, we postulated that the pro-inflammatory cytokine, IL-1β, contributes to the induction of CD4 expression in resident cardiac fibroblasts. Our single-cell mass cytometry profiles showed an increase in immunocompetent cardiac fibroblast sub-populations with recombinant IL-1β suggesting a role of IL-1β in cardiac fibroblast re-phenotyping (Supplementary Fig. S8a). Further, CD4 expression varied with IL-1β treatment specifically for male donors (Supplementary Fig. S8b). The non-redundancy scores suggested that CD4 is expressed at levels similar to those of vimentin and αSMA, markers of cardiac fibroblasts (Supplementary Fig. S8c). The percentages of HLA-DR+ dendritic cell, CD4+ lymphocyte, and CD68+ monocyte populations also shifted in response to IL-1β treatment (Supplementary Fig. S8d). αSMA+ and CD4+ expressing cardiac fibroblast populations increased with IL-1β treatment, as seen in the normalized density distribution plots (Supplementary Fig. S8e). The changes in the expression of specific immune cell lineage markers with IL-1β treatment were shown as a heatmap for all three human donors (yellow is high expression and blue is low expression). The vertical pink and green boxes highlighted increases in marker expression in association with IL-1β. Based on the pattern of marker expression (X-axis) for all proteins tested, a cell identity can be defined on the Y-axis. As the pattern of expression has not previously been described in human cardiac fibroblasts, we have not labeled the lineages on the Y-axis47 (Supplementary Fig. S9a). However, identified the more common patterns for lymphoid lineages, myeloid lineages and memory T-cells and expressed our data in the form of SPADE visualization48 (Supplementary Fig. S9b–f).
IL-1β proliferates and differentiates primary human cardiac fibroblasts into immunocompetent cells
To determine the mechanisms of IL-1β mediated phase shifts in cardiac fibroblast phenotypes to immune cells, we studied IL-1β-mediated cell proliferation and differentiation. Inflammatory processes involving immune cell proliferation, recruitment, reprogramming, secretion of cytokines and chemokines are critical to the IL-1β-linked biological responses49. Previous reports suggest that IL-1β is a paracrine growth factor for fibroblasts during intestinal fibrosis50 and regulates collagenase expression51. To determine the proliferative and collagen regulation of IL-1β, hVCFs were treated with vehicle or recombinant IL-1β for 24 h, followed by BrdU and MTT assays and Ki67 staining. IL-1β treatment resulted in an increase in cardiac fibroblast proliferation in a dose-dependent and time-dependent manner (Fig. 4a, b). IL-1β similarly affected the proliferation rates of primary hVCF cells isolated from males and females (Fig. 4c). IL-1β treatment tended to stimulate the deposition of Collagen Iα, as determined from total collagen in the lysates (Fig. 4d) and confocal microscopy (Supplementary Fig. S9g); however, these effects were not statistically different. To determine whether IL-1β differentiates cardiac fibroblasts and induces phenotypic changes, human hVCFs were treated with IL-1β (10 ng/mL) for 96 h, which resulted in the induction of significant morphological changes in hVCF cells by day 4 at this dose and time, including increased detachment and rounding of cells (Fig. 4e). Therefore we used IL-1β dose of 10 ng/mL and 96 h of treatment for all subsequent experiments. Round cells with nonhomogeneous DAPI-stained nuclei appeared with 96 h of IL-1β treatment (Fig. 4e). The round cells, but not the surrounding cells, were positive for both αSMA and CD4 T-cells (Fig. 4e). The round cells were viable and not apoptotic, as determined using trypan blue staining. Additionally, myeloid-specific CD68 positive clusters were also seen in IL-1β hVCF but not in Veh (Fig. 4f). We sought to expand the number of cardiac fibroblasts with T-cell features by growing the cells in T-cell expansion media for 10 days with added IL-1β (Supplementary Fig. S14). We noted the formation of cell clusters in all the human donors, suggesting that IL-1β induced cell clustering from day 7 onward (Fig. 4g). We next characterized the subcellular phenotypic switching of cardiac fibroblasts with IL-1β after 96 h using transmission electron microscopy. Transmission electron microscopy showed more prominent endoplasmic reticulum and Golgi apparatus, suggesting activation and secretory transformation of cardiac fibroblasts in the presence of IL-1β (Fig. 4h). Increased intracellular and budding extracellular microvesicles were seen in the IL-1β-treated cells immunostained with IL-1β receptor (IL-1R) (Fig. 4i). Our data demonstrated that cardiac fibroblasts have the capacity to assume a secretory cell phenotype in the presence of IL-1β.
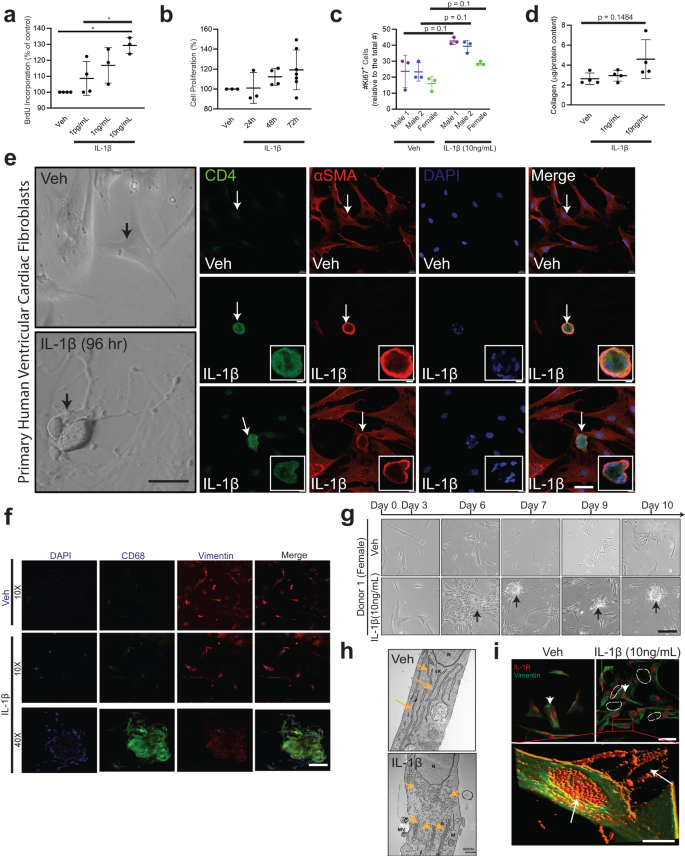
Primary hVCF cells (2.0 × 10⁶ cells/mL) from donors (2 males (ID# 62122, ID# 1281202) and 1 female (ID#534282)) were cultured in Fibroblast Basal Media (FBM) for 4 days with 10 ng/mL of IL-1β or in T-cell media with CD3/CD28 T-cell activator for 13 days. a hVCF proliferation in response to IL-1β exposure was assessed by BrdU incorporation. Data are Mean ± SD for 3 biological replicates. *P < 0.05, one-way ANOVA with multiple comparisons. b Cell proliferation response of hVCF to IL-1β after 24 h, 48 h and 72 h of incubation was assessed using MTT assay. Data are Mean ± SD for 3 biological replicates (n = 3–6 technical replicates). c Cell proliferation response to IL-1β determined by Ki67 staining of nuclei. Data are Mean ± SD for 3–4 biological replicates, P = 0.1, one-way Kruskal–Wallis ANOVA with Dunn’s multiple comparisons. d Collagen content in response to IL-1β doses (1 ng/mL and 10 ng/mL) measured in the cell lysates using the Sircol assay. The data are represented as Mean ± SD values from individual subjects (n = 4) biological replicates, no significance (ns), Kruskal–Wallis one-way ANOVA with Dunn’s multiple comparisons. e Left Panel: Bright-field images of live hVCF cells indicating the shifts in cellular morphology from a spindle-shaped fibroblast to a round cell with a large nucleus in response to 96 h of treatment with IL-1β (10 ng/mL). Arrows indicate a change in morphology of hVCF with IL-1β treatment, but not with vehicle treatment. Right Panel. Immunostaining of fixed hVCF with lymphoid CD4 T-cell marker (green), mesenchymal αSMA (red) and DAPI (blue) markers to characterize the transformed cells. The arrow indicates the emergence of round, multinucleated αSMA+ CD4+ expressing cells. Representative magnified images of multinucleated notch-shaped giant cells immunostained with αSMA+ CD4. f Immunostaining of the cardiac fibroblast cell membrane with CD68, Vimentin, DAPI and Merge showing cell clustering phenotype with IL-1B at 40x magnification. g Differentiation of cardiac fibroblast in T-cell media with T-cell activators followed for 13 days. hVCF were treated with rIL-1β (10 ng/mL) in fibroblast media for 4 days. Cells were then transferred to T-cell expansion media with T-cell activators (CD3, CD2, CD28) for 10 days. Representative bright-field images taken day 3, day 6, day 7, day 9 and day 10 are presented sequentially. Cells start clustering by day 6 and form prominent circular colonies by day 7. Arrows show multicellular clusters. h Transmission electron microscopy micrograph of ultramicroscopic subcellular structures of the vehicle and IL-1β (10 ng/mL) 24 h treated hVCF. N Nucleus, ER Endoplasmic Reticulum, MV Secreted Microvesicle, G Golgi body, M Mitochondria. Scale bar, 400 nm. n = 3 technical replicates. i Representative immunostained images of Vimentin (green) and IL-1R expression (red) and distribution across the nucleus and cytoplasm of hVCF treated with Veh or IL-1β. The white dotted lines indicate the bright red puncta of IL-1R expression on hVCFs after 24 h treatment with IL-1β. Z stack images of IL-1β treated hVCFs were projected in 3D using image J. Arrows indicate overexpression and extracellular release of IL-1R.
Expression of extracellular matrix and inflammatory genes in response to IL-1β
Recognizing that differentiated cardiac fibroblasts express both mesenchymal and lymphoidal lineage markers, we evaluated gene responses related to extracellular matrix deposition and inflammatory functions due to IL-1β. We used a targeted qPCR approach gene expression method employing a validated taqman array plate preset with primers specific to extracellular matrix genes or inflammatory genes, specifically assessing the expression of these genes in the presence of Veh or IL-1β. A comprehensive list of both extracellular matrix genes and inflammatory genes modulated by IL-1β is presented as a heatmap (Supplementary Fig. S11e, f) and in Supplementary Tables S6 and S7. Heatmaps of IL-1β responsive and unresponsive inflammatory and extracellular matrix genes are listed from the highest Z-score to the lowest Z-score (Supplementary Fig. S11a, b). Notably, the CD44 gene, highly expressed during T-cell development, is upregulated 3-fold in IL-1β-treated cardiac fibroblast cells (Supplementary Table S7). The heatmap may reflect the specific transitions of the extracellular matrix and inflammatory gene responses due to IL-1β. Further, relationships between genes, including activation, inhibition, and binding partners of genes differentially expressed with IL-1β (Supplementary Fig. S11c) were represented by STRING analysis (Supplementary Fig. S11g). STRING analysis of significantly expressed inflammatory genes predicts interactions between the IL-1R1 gene and the inflammatory regulator NFkB1 (Supplementary Fig. S11c, g). In addition, ANXA1, which is modulated with IL-1β, was predicted to interact with multiple binding partners, such as PTAFR, LTB4R and HRH1. String analysis of significantly expressed extracellular matrix genes showed a cluster of ITGA modulated by IL-1β interacting with binding partners and CD44 interacting with MMP14 and VCAN. MMP1 was predicted to interact with MMP11 and A2M (Supplementary Fig. S11c, g). Further, pathway analysis using CYTOSCAPE suggested that immune-responsive genes with a false discovery rate (FDR) of 2.85 × 10⁻¹³ belonged to gene ontology terms “cellular response to cytokine stimulus”, “cytokine-mediated signaling pathway”, “inflammatory response”, “defense response and immune system process” (Supplementary Fig. S11g; Bottom table), while extracellular matrix-associated genes with the FDR of 2.13 × 10⁻¹⁷ belonged to gene ontology term “extracellular matrix organization” (Supplementary Fig. S11g; Bottom table). We further validated the gene expression of CCR2 and IL-1R, (Fig. 5a) in primary adult rat ventricular fibroblasts isolated using Langendorff’s method and expression of IL-8 and TGF-β in primary human ventricular fibroblasts using qPCR (Fig. 5b).
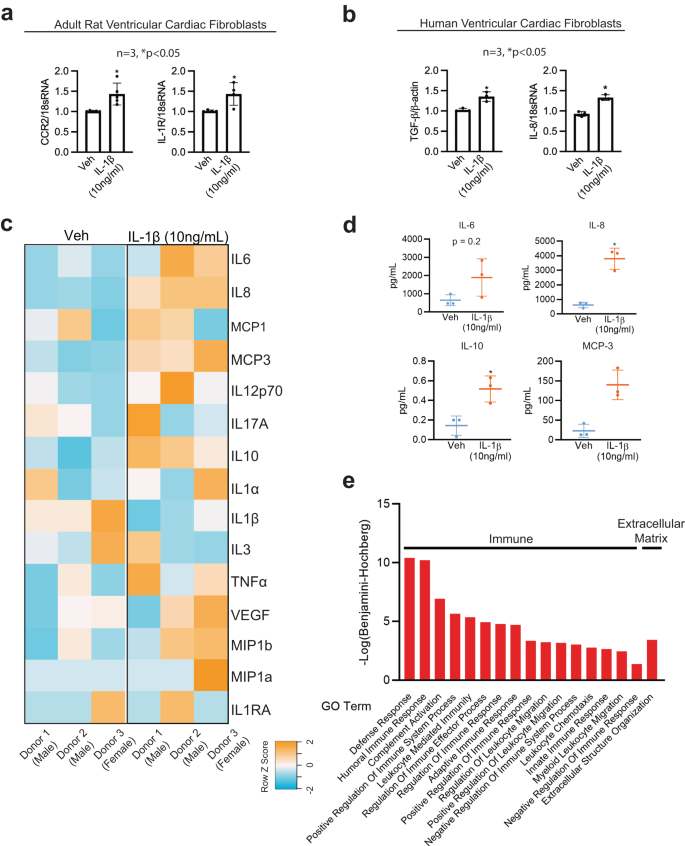
a Chemokine CCR2 and cytokine IL-1R gene expression performed in adult rat ventricular cardiac fibroblasts treated with Veh or IL-1β (10 ng/mL) after 24 h using quantitative PCR (qPCR). n = 3, *P < 0.05. b IL-8 and pro-differentiation TGFβ gene expression levels in primary hVCF treated with Veh or IL-1β (10 ng/mL) after 24 h using quantitative PCR (qPCR). n = 3, *P < 0.05. c Heatmap representation of secreted cytokines and chemokines (IL6, IL8, MCP-1, MCP-3, IL12p70, IL17A, IL10, 1L1a, IL1β, IL3, TNFa, VEGF, MIP1b, MIP1a and IL1RA) in the conditioned media after 24 h of treatment with Veh or IL-1β (10 ng/mL) profiled using a milliplex bead-based detection method. The values in the heatmap are expressed in Raw Z-score, ranging from blue (-2) to orange (+2). d Scatterplots of cytokines and chemokines (IL-6, IL-8, IL-10 and MCP-3) quantified in the condition media from Veh and IL-1β treated cardiac fibroblasts. The scatterplots represent Mean ± SD values (n = 3 biological replicates, *P < 0.05) by unpaired-student t-test with Mann–Whitney post hoc test. e GO Function analysis to identify the function of the 158 secretory proteins unique to conditioned media from IL-1 β treated cells using LC-MS/MS. Benjamini–Hochberg score of false discovery rate.
Induction of immunomodulatory proteins in response to inflammatory cytokine
In human preadipocytes, IL-1β stimulates the production of cytokines and chemokines in a manner that is similar to the inflammatory response of mature adipocytes52. To determine the effect of IL-1β on the cardiac fibroblast secretome (immunomodulatory cytokines, chemokines, proteins, and metabolites), we performed quantitative cytokine and chemokine analysis, proteomics, and metabolomics using MAP Human Cytokine/Chemokine Magnetic Beads and LC-MS/MS from three human donors. Heatmaps of the expression of secreted cytokines and chemokines showed significant changes in the secretome, as represented by orange color (high expression) or blue color (low expression) (Fig. 5c). We noted that 24 h treatment with IL-1β significantly increased secretion of IL-8, IL-10, and MCP-3, while the secretion of IL-6, IL-12p70, TNF-β, and VEGF tended to increase but were not significant. We next optimized a protocol to identify proteins solely secreted in the conditioned media by human cardiac fibroblasts in response to IL-1β using unlabeled proteomics detected by LC-MS/MS. A total of 274 and 301 proteins were secreted in the conditioned media uniquely by cardiac fibroblasts treated with Veh or IL-1β (10 ng/mL) (Supplementary Fig. S12b and Supplementary Tables S8–S11). Out of the annotated 394 proteins, the Venn diagram demonstrated that 120 proteins were unique to IL-1β and that 181 proteins were common to both Veh and IL-1β (Supplementary Fig. S12b). Conditioned media replicates for the Veh and IL-1β groups were internally consistent, as represented in Supplementary Fig. S12c.
Functional gene ontology (GO) enrichment analysis of the conditional media secreted proteins using the g:profiler web server showed humoral immune response, immune effector process, leukocyte-mediated immunity, vesicle-mediated transport, platelet degranulation, neutrophil activation and lymphocyte-mediated immunity as highly significant for a search of biological processes (BP) (Fig. 5e) similar to the gene expression data. In addition, cellular component (CC) enrichment for the secreted proteins was predicted to be a part of the extracellular exosome, collagen-containing extracellular matrix, extracellular matrix, secretory granule lumen and cytoplasmic vesicle lumen (Fig. 5e). In Supplementary Fig. S12d, the gene ontology terms synonymous with functions of secreted proteins are listed, showing the proteins involved in extracellular matrix regulation and inflammation secreted by hVCF in response to IL-1β, as analyzed with PANTHER. Supplementary Tables S6–S11 demonstrate the functions of designated proteins in terms of biological processes, molecular function and immune subset population identified uniquely in the conditioned media of IL-1β-treated hVCF. Specifically, proteins involved in the activation of innate and adaptive immune responses, leukocyte activation, and leukocyte migration were displayed in the biological process analysis, molecular function, and immune subset biological processes (Supplementary Fig. S12d–f).
Transcriptome profile of IL-1β-induced CD4 fibroblast cell population
Extending our cell cytometry data (Fig. 6a), we characterized the identity of the IL-1β-induced CD4+-fibroblast cell population by flow sorting hVCF cells into CD4+ cardiac fibroblasts and CD4− cardiac fibroblasts after 10 days treatment in T-cell differentiation media, and then characterized the genetic footprint of the newly identified CD4-expressing cardiac fibroblasts using next-generation deep total RNA sequencing (Fig. 6b–e and Supplementary Fig. S11b–e). We observed both the unique transcriptomic signatures of the IL-1β induced CD4+ hVCF population (Fig. 6b) and differential gene expression between Veh and IL-1β groups (Fig. 6b). Heatmaps based on non-hierarchical clustering showed differences in transcriptomic signatures for the CD4+ and CD4− populations (Fig. 6b). The number of significant genes common to all four groups were represented by the volcano plot (Fig. 6c). Venn diagrams showed no common genes shared by the newly identified Veh CD4 and IL1β CD4 populations (Fig. 6d), whereas 255 genes were unique to the IL-1β group (Fig. 6d).
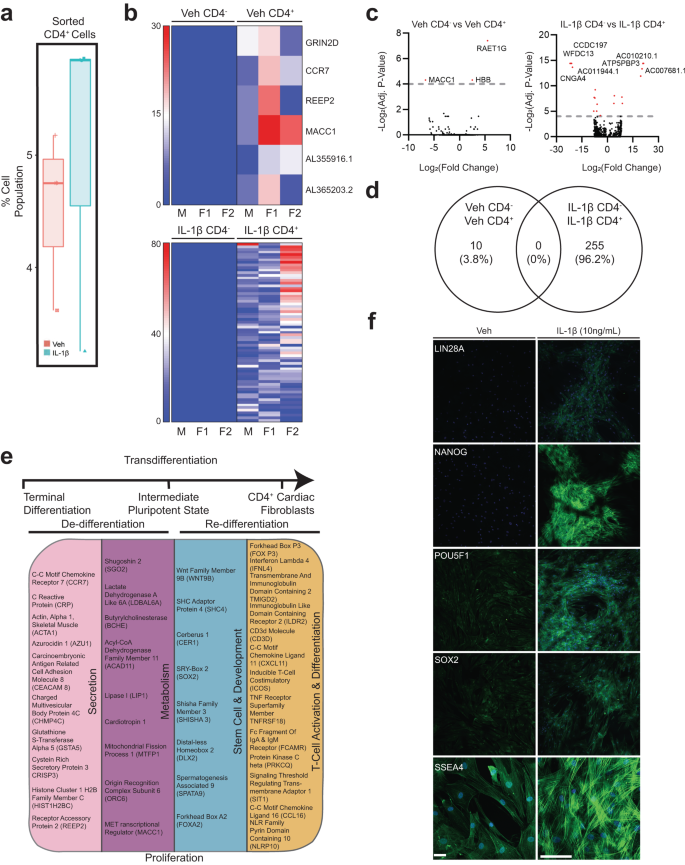
Primary hVCFs from 3 human donors (males and female) were differentiated for 10 days in T-cell media with or without IL-1 β (10 ng/mL) and flow-sorted into CD4+ and CD4− populations, followed by next-generation RNA sequencing using the Illumina platform. a Box plot of shifts in CD4+ human cardiac fibroblast population in response to IL-1 β. b Heatmaps showing the expression pattern of genes uniquely identified in Veh CD4+, Veh CD4−, IL-1 β CD4+ and IL-1β CD4− populations. c Volcano plot showing the number of significantly upregulated and downregulated genes for each of the comparisons. False discovery rate (FDR) (adjusted P-value < 0.01). d Venn diagram showing the number of common genes among the Veh and IL-1β among the unique genes identified for all the populations. e Summary of gene ontology hits using a database for annotation, visualization, and integrated discovery (DAVID) online platform showing the enrichment of genes involved in secretion, pluripotency, development, metabolism and T-cell activation and differentiation. Benjamini–Hochberg score of false discovery rate. f Validation of expression of stemness markers (Lin28A, Nanog, POU5F1, SOX2, SSEA4) in Veh and IL-1β treated cardiac fibroblasts.
The IL-1β induced CD4 cardiac fibroblast population differed from the parent population by the manifestation of a stem cell-like activated state, as evidenced by the presence of genes associated with pluripotency and reprogramming (WNT9B, SHC4, CER1, SOX2, SHISHA3, DLX2, SPATA9 and FOXA2). Moreover, CD4+ stem cell-like cells were secretory, in contrast to the CD4− cells, as evidenced by their expression of microvesicle- and exosome-associated genes (CCR7, CRP, ACTA1, AZU1, CAECAM 8, CHMP4C, GSTA5, CRISP3, HIST1H2BC and REEP2). In addition, these stem cell-like secretory cells were metabolically active (CCR7, CRP, ACTA1, AZU1, CEACAM8, CHMP4C, GSTA5, CRISP3, HIST1H2BC and REEP2) and possessed characteristics of lymphoidal cells (FOXP3, CD3D, IFNL4, TMIGD2, ILDR2, CXCL11, ICOS, TNFRSF18, FCAMR, PRKCQ, SIT1, CCL16 and NLRP10), as annotated based on their biological function using Database for Annotation, Visualization, and Integrated Discovery (DAVID) (Fig. 6e). Innate immunity-linked genes (2’-5’-oligoadenylate Synthase Like (OASL)), absent in melanoma 2 (AIM2) and adaptive immunity-linked genes (CD1c molecule, CD207 molecule), co-stimulatory signal during T-cell activation (inducible T-cell co-stimulatory (ICOS)), T-cell chemotaxis (CXCL11), TNF receptor superfamily member (TNFRSF18) involved in leukocyte migration, B-cell proliferation genes (GRB2-binding adapter protein) and genes associated with phagocytosis (carcinoembryonic antigen-related cell adhesion molecule 4 (CEACAM4)) were unique to the IL-1β CD4+ group (Fig. 6e). These experiments showed that a subset of terminally differentiated resident cardiac fibroblasts may convert into lymphoid-like cells in the presence of the inflammatory cytokine, IL-1β. Further, we validated the expression IL-1β induced stemness of adult cardiac fibroblast using stem cell-specific markers (LIN28A, NANOG, POU5F1, SOX2 and SSEA4) by immunofluorescence staining. Clusters of differentiated cardiac fibroblast cells expressed all the stemness-associated markers. While SSEA4 expression was also seen in low quantities in Veh, the expression increased in IL-1β treated cells (Fig. 6f). RNA seq analysis and immunostaining of this unique cell population provided evidence that IL-1β mediates the expression of stemness markers on adult cardiac fibroblasts.
Inflammatory cytokine (IL-1β)-induced secretion of immune response-associated metabolites
We analyzed human cardiac fibroblast-specific metabolites in conditioned media, following treatment with IL-1β, by assaying changes in the metabolic status of cardiac fibroblasts using non-targeted LC-MS/MS (Supplementary Fig. S13). Principal component analysis based on overall differences between the metabolites demonstrated separation of the vehicle group and IL-1β-treated groups (Supplementary Fig. S13a). The volcano plot distinguished metabolites with negative log with a false discovery rate higher than 1 modulated by IL-1β treatment (Supplementary Fig. S13b) Heatmap comparisons of differentially secreted metabolites between vehicle and IL-1β presented in Fig. 6c showed differential metabolite secretion with IL-1β. Interestingly, the metabolic profile for the female donor of the cardiac fibroblast cells with and without IL-1β treatment was different from that of the male donors (Supplementary Fig. S13c). The top 25 differentially upregulated and downregulated metabolites are represented on the heatmap (Supplementary Fig. S13d). Pathway analysis of the differentially expressed metabolites identified significant upregulation of metabolites involved in cardiolipin biosynthesis, a key inner mitochondrial membrane protein and mitochondrial oxidant producer in IL-1β treated cardiac fibroblast cells (Supplementary Fig. S13e). Typical CD4+ metabolite signatures of activated T-cells involving methionine metabolic pathways and pyrimidine metabolism, methyl histidine metabolism, phenylacetate metabolism, and de novo triacylglycerol biosynthesis were also upregulated (Supplementary Fig. S13e). Interestingly, metabolites serving as a link between glycolysis and the citric acid cycle, including thiamine pyrophosphate, were differentially secreted in response to IL-1β stimulation. Specifically, metabolites associated with ATP generation, carbohydrate metabolism, and the production of amino acids, nucleic acids, and fatty acids, such as spermidine, spermine and atrolactic acid, were upregulated, while others were downregulated, such as sedoheptulose-1-7-phosphate, oxaloacetate, N6-acetyl-L-lysine, succinate, 1,3 diphosphate glycerate, and citrate-isocitrate (Supplementary Fig. S13f and Supplementary Tables S12 and S13). Our data confirmed that cardiac fibroblasts assumed immune cell features in the presence of IL-1β by upregulating inflammatory and ECM genes and by secreting cytokines, chemokines, immunomodulatory proteins, and metabolites involved in both innate and adaptive immune responses.
Lineage tracing of cell fate for endogenous cardiac fibroblasts following IL-β induction
To confirm the cellular identity of endogenous cardiac fibroblasts following IL-1β induction, we utilized an in vivo lineage tracing mouse model. Experimental pdgfraCreERt2/+;R26R-tdTomato mice were generated by combining a fibroblast-specific tamoxifen-dependent cre recombinase-expressing allele knocked into the platelet-derived growth factor receptor-α (pdgfrα) locus30,53,54,55 with a cre-dependent tdTomato fluorescent protein-expressing reporter allele54 (Fig. 7a). Eight- to ten-week-old mice were fed with chow including tamoxifen in order to promote the permanent labeling of pdgfrα positive cardiac fibroblasts allowing fate change experiments of the pdgfrα lineage fibroblasts with the reporter allele expression regardless of the pdgfrα expression following labeling54 (Fig. 7b). Utilizing a separate reporter mouse line in which pdgfrα positive cells can be detected with the expression of GFP fluorescence protein driven by the endogenous pdgfrα promoter (pdgfraGFP/+)53, we demonstrated that the isolated GFP positive cardiac cells are, in fact, pdgfrα positive fibroblasts, which are, prior to induction, negative for CD4 or CD45. (Supplementary Fig. S14a). Following the in vivo labeling protocol, mice hearts were harvested and enzymatically digested, and then cardiac ventricular fibroblasts were sorted with FACS utilizing the red fluorescence (Fig. 7c). We monitored the stable expression of tdTomato expression within cultured primary cardiac fibroblasts via real-time imaging of the red fluorescence and showed that, regardless of treatment, the reporter allele was expressed at all times (Fig. 7d). Following IL-1β induction, tdTomato cells were subjected to flow cytometric analyses for their expression of fibroblast origin cell identity markers (mesfk430 and pdgfrα) and immune cell markers (CD4 and CD45) (Fig. 7e). Compared to controls, IL-1β treated cells showed a substantial presence of transdifferentiated fibroblasts, which were positive for CD45 and CD4 (Fig. 7e right panels). Upon analysis of the pdgfrα lineage traced cardiac fibroblasts that acquired CD4 and CD45 labeling following IL-1β induction, we showed that in 92% of these cells, the fibroblast cell identity markers were lost (Fig. 7f). However, when we analyzed the rest of the cells compared to CD45 and CD4 double positive cells we still detected the fibroblast markers, as shown with overlayed histogram (Fig. 7g). Compared to the CD45 identity, CD4 expression in cardiac fibroblasts seemed to be acquired or detectable much readily even in the vector group, hence we confirmed these results by analysis of the CD4 flow cytometry plots with overlayed histogram (Fig. 7h). Human fibroblasts and mouse cardiac fibroblasts showed a similar conversion rate to immune cell phenotype with IL-1β treatment (Fig. 7i). Similarly, human cardiac fibroblasts that were originally pdgfrα positive and CD4 negative were shown to acquire a pdgfrα negative CD4 positive phenotype (Supplementary Fig. S14b). We have therefore demonstrated that lineage-traced primary endogenous mouse cardiac fibroblasts lose their fibroblast identity upon IL-1β induction and acquire an immune phenotype.
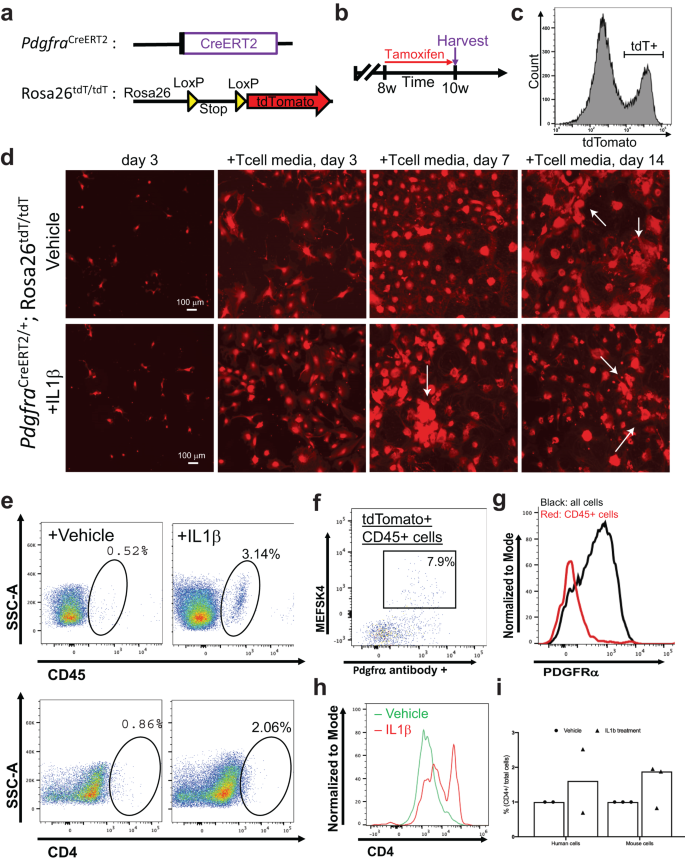
Lineage tracing of Pdgfrα+ cardiac fibroblasts was performed to confirm that these explicit cells become CD4-expressing cells in association with IL β1 induction. a Generation of the lineage tracing mouse model in which tamoxifen-dependent Cre recombinase is expressed under the influence of a Pdgfra promoter. Combined with a Cre-dependent tdTomato (red fluorescence) expressing reporter, the allele permanently labels all resident cardiac fibroblasts. b Experimental scheme in which PdgfraCreERT2/+; Rosa26tdT/tdT mice are given tamoxifen chow for two weeks prior to harvesting to tag cardiac fibroblasts in vivo. c Flow cytometric sorting of tdTomato labeled cardiac fibroblasts. Bracket shows the tdTomato positive population that is sorted and cultured. d Live red fluorescence imaging of cultured fibroblasts. Throughout all of the steps of the culturing protocol, tdTomato signal has been maintained due to the permanent recombination of the reporter allele. (Scale bar is 100 mm). e Flow cytometry analysis showing CD45+ and CD4+ phenotype acquisition of tdTomato+ fibroblasts following IL1β treatment. f Flow cytometry analysis demonstrating that originally Pdgfra+ cardiac fibroblasts do not maintain their fibroblast markers upon transitioning to immune phenotype. g Normalized histogram analysis of Pdgfra positivity among tdTomato+CD45+ cells. h Normalized histogram analysis of CD4 positivity from flow cytometry among tdTomato+ cells. i Quantification derived from flow cytometry of both mouse and human fibroblasts that acquired CD4 phenotype, shown as a percentage of CD4 cells/total cells sampled. Each experiment has a biological n = 3 and technical replicates of n = 3.
- SEO Powered Content & PR Distribution. Get Amplified Today.
- PlatoData.Network Vertical Generative Ai. Empower Yourself. Access Here.
- PlatoAiStream. Web3 Intelligence. Knowledge Amplified. Access Here.
- PlatoESG. Carbon, CleanTech, Energy, Environment, Solar, Waste Management. Access Here.
- PlatoHealth. Biotech and Clinical Trials Intelligence. Access Here.
- Source: https://www.nature.com/articles/s42003-023-05463-0