NF-κB signaling is significantly enriched throughout HSC ontogeny
To understand the precise involvement of the inflammatory signaling pathways throughout HSC ontogeny, we scrutinized a publicly available dataset of single-cell sequencing of HSCs at various stages of development, i.e., AGM, FL, and bone marrow13. Cells clustered according to their cell fate, with AGM endothelial cells (EC) situated at the opposing end to the bone marrow HSCs (Fig. 1A). In between these two fates, the T1/T2 HSC of the AGM, and the FL HSCs (E12.5 and E14.5) formed a continuum towards the bone marrow HSCs (Fig. 1A).
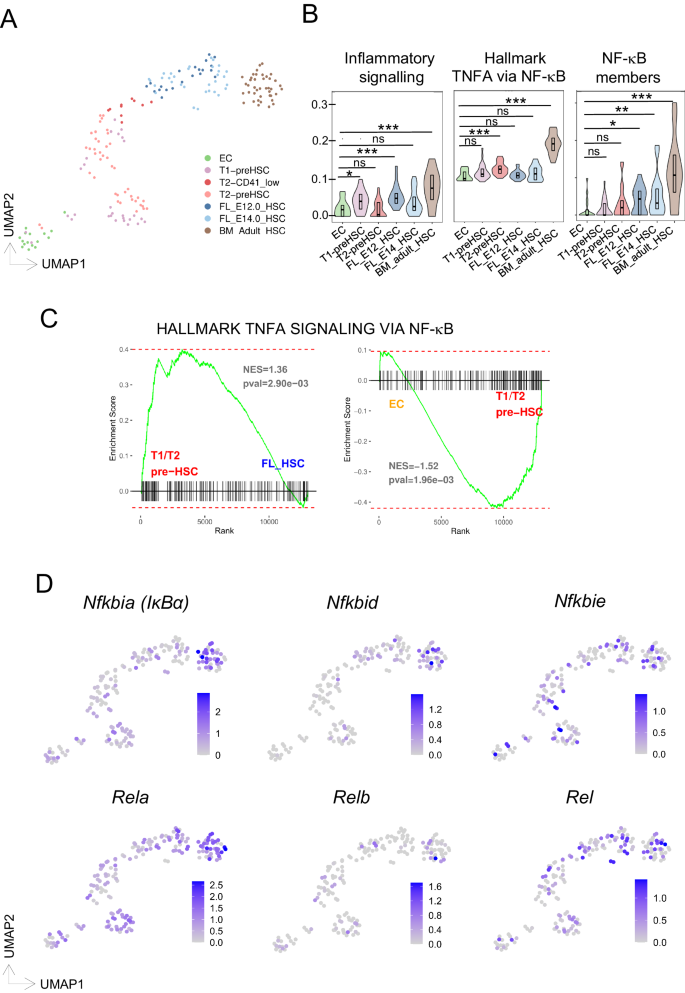
A UMAP projection colored by scRNAseq clusters where different HSC populations are highlighted. Single-cell RNA-sequencing data derived from Zhou et al.13. EC = CD31+Cdh5+CD41-CD43-CD45-; T1 PreHSC = CD31+cKIT+CD41lowCD201highCD45-; T2 PreHSC = CD31+cKIT+CD201highCD45+; E12 FL-HSC= lin-SCA+CD201highMac1low; E14 FL-HSC = CD45+CD201CD48-CD150+; adult BM-HSC= lin-SCA1+cKIT+CD135-CD34- CD48-CD150+ (B), enrichment score analysis of indicated HSC populations for inflammatory, NF-κB pathway and NF-κB signaling molecules. Boxplot shows indicate the upper- (75%) and lower- (25%) percentile, with the median value shown as a solid black line. Statistical significance determined with a two-sided t-test. No adjustments were made for multiple comparisons. *** < 0.001, ** < 0.01, * < 0.05 (C), GSEA results comparing T1/T2 HSC cells to FL-HSC (left) or endothelial cells (EC) to T1/T2 HSC for correlation to the Hallmark “TNFA_SIGNALING_VIA_ NF-κB” gene set. The indicated p-value is a nominal p-value obtained from GSEA. D UMAP projection colored by the expression of selected genes from the NF-κB signaling pathway.
We assessed these different HSC populations specifically for gene expression levels of inflammatory signaling and NF-κB signatures (Fig. 1B, Supplementary Data 1), and found its enrichment to increase from early HSC stages to bone marrow LT-HSCs, with a subtle decrease at fetal stages. Altogether, these findings indicate a dynamic involvement of inflammatory pathways from (pre-) HSC stages to phenotypically adult HSC development.
We next compared the status of NF-κB signaling activity at the early developmental stages by performing Gene Set Enrichment Analysis (GSEA). Ranked T1/T2 HSC vs E12/14.5 fetal liver (FL-HSC) and EC vs T1/T2 HSC differentially expressed genes significantly correlated to the hallmark “Tnfa signaling via NF-κB” (Fig. 1C and Supplementary Data 1). Subsequently, we examined the expression profile of specific NF-κB signaling elements across identified cell populations (Fig. 1D, Supplementary Fig. S1) finding more cells in the adult bone marrow HSCs showing higher expression of these genes. Nevertheless, some cells in the T1/T2 and FL-HSC populations also expressed NF-κB signaling elements RelA, Rel, Nfkbia, and Nfkbie, supporting a role for NF-κB in mouse HSC development, as previously shown for HSPC generation in zebrafish30.
The number of LT-HSCs is reduced in the hematopoietic sites of IκBα KO
To examine the putative effect of NF-κB over-activation in HSC development, we took advantage of the IκBα KO mice which show normal embryonic development but then succumb to death beyond 7 days after birth due to massive inflammation35,36. We analyzed the stem cell compartment of IκBα deficient mice at early postnatal stages (postnatal days 5 and 6, P5/6) in the liver and bone marrow and FL at E14.5 (Fig. 2A).
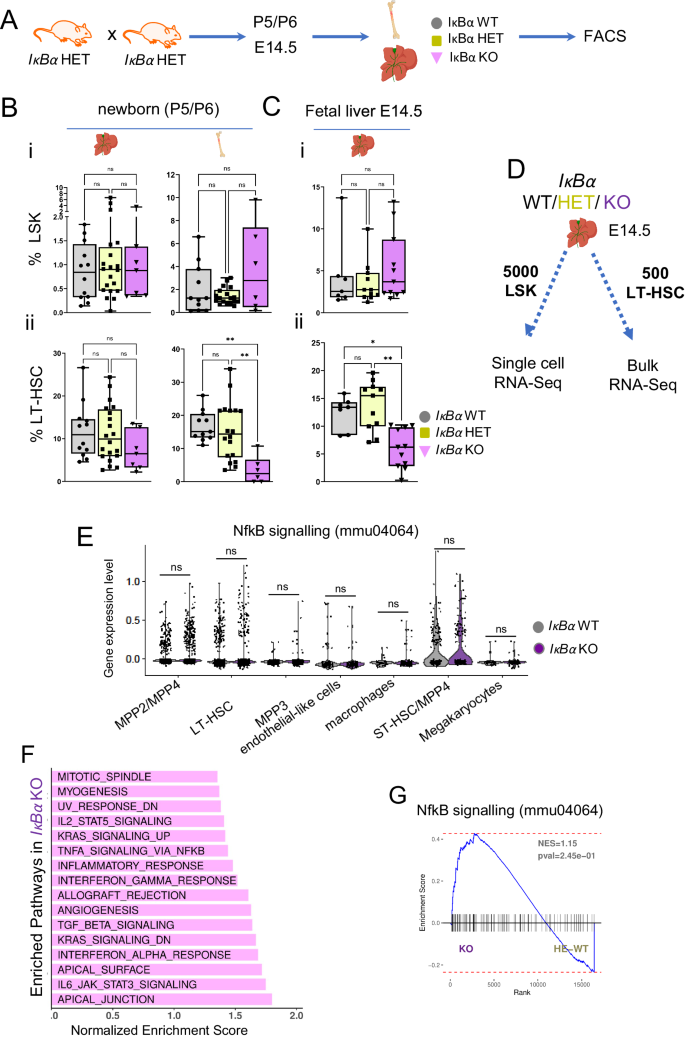
A Scheme of the mouse mating to obtain IκBα WT, HET, and KO hematopoietic tissues. B Box plot with individual values of the frequency of (i) LSK (lin-SCA1+cKIT+) in the liver or bone marrow of newborn (P5/6) both obtained from n = 39 pups in 5 independent experiments and, (ii) LT-HSCs (LSKCD48-CD150+) from the previous gate (LSK) in the liver of newborn (P5/6) IκBα WT (n = 12), HET (n = 20) and KO (n = 7) and in the bone marrow of newborn (P5/6) IκBα WT (n = 11), HET (n = 18) and KO (n = 6). C Box plot with individual values of the frequency of (i) LSK in the fetal liver of E14.5 IκBα WT (n = 7), HET (n = 11) and KO (n = 11), and (ii) LT-HSCs (LSKCD48-CD150+) in E14.5 IκBα WT (n = 7), HET (n = 11) and KO (n = 11), both cased obtained from n = 19 embryos in 3 independent experiments. Statistical test for (B), (C): unpaired two-tailed Dunn’s non-parametric all-pairs comparison test after Kruskal–Wallis test (**p-value < 0.01, *p-value < 0.05, ns p-value > 0.05). Boxplots show the median (center line) first and third quartiles (box limits), and whiskers extend to minimum and maximum values. D Scheme illustrating the two strategies followed to explore the molecular changes in IκBα WT, HET, and KO. E14.5 FL were FACS sorted to obtain 5000 LSK cells for single-cell RNA-sequencing and 500 cells/sample of LT-HSCs for bulk RNA-sequencing. n = 4 embryos per genotype. E Violin plots with individual values depicting the expression levels from scRNAseq data of genes from NF-κB signaling (KEGG ID mmu04064) signature within each annotated cell population. Statistical test: two-tailed Wilcoxon rank sum test (ns p-value > 0.05). F Bar plot depicting significantly enriched MSigDB HALLMARK pathways in IκBα KO against WT/HET genotypes with positive Normalized Enrichment Score (NES), identified by GSEA from the bulk RNA-seq data (Benjamini–Hochberg procedure (FDR) adjusted p-value < 0.05). Bars sorted by NES. G NF-kB signaling signature (KEGG ID mmu04064) GSEA over the bulk RNA-seq data comparing IκBα WT/HET and KO LT-HSCs. Indicated p-value is a nominal p-value obtained from GSEA. Source data are provided as a Source Data file. A–D created with BioRender.com released under a Creative Commons Attribution-NonCommercial-NoDerivs 4.0 International license.
All genotypes showed comparable numbers of cellularity in the bone marrow and (fetal/newborn) liver (Supplementary Fig. S1B), and all blood lineages were present in the IκBα KO newborn, albeit mild but significant lineage skewing (Supplementary Fig. S1C), as previously reported37,38. The frequency of the LSK was comparable between the genotypes in the E14.5 FL, and the newborn liver and bone marrow (Fig. 2i, Ci and Supplementary Fig. S2A). However, the number of LT-HSCs was significantly reduced in newborn BM and E14.5 fetal liver of IκBα KO (Fig. 2Bii, Cii and Supplementary Fig. S2A and B).
Since the loss of the NF-κB signaling downstream effector, p65, in mice is embryonic lethal at 15-16 days of gestation and is characterized by an enormous degeneration of the fetal liver by apoptosis39, we evaluated the cellularity, and the NF-κB signaling activity status of the FL in IκBα KO at E16.5. We did not detect any significant alterations in cell number, appearance, or weight between the genotypes (Supplementary Fig. S1B and S3A). Additionally, we checked the NF-κB activity status by IHC for p65 in IκBα deficient FL and detected lower numbers of nuclear p65 in IκBα KO (Supplementary Fig. S3B, C). These findings are in line with the initial study of the IκBα KO phenotype, where the authors found no, or variable levels of NF-κB over-activation in different cell types, due to the IκBα function as NF-κB inhibitor being compensated by IκBβ39.
Occasionally, IκBα KO mice survive to adulthood for unexplained reasons, and even in these rare survivors, we detected a reduction in LT- HSCs numbers (Supplementary Fig. S3D). Finally, we did not find any statistically significant changes between IκBα WT and HET regarding contribution to the LSK and LT-HSC population (Fig. 2B, C).
FL LT-HSCs retain an AGM-specific gene expression profile in IκBα KO
To define the molecular alterations in the stem cell compartment in IκBα KO, we followed two complementary strategies and used the E14.5 FL as the source for the cells. We either sorted 5000 LSK cells from IκBα WT or KO for single-cell RNA-sequencing to estimate alterations across different (stem) blood lineages, and in parallel, we purified 500 WT, HET or IκBα KO LT-HSCs (LSK/CD150+CD48-) by FACS to perform bulk RNA-seq for detailed transcriptomic analysis of the samples (Fig. 2D, Supplementary Data 2 and 3). Within the single-cell RNA-seq data set of the LSK, we assigned cell identity based on previous studies (Supplementary Fig. S4A–C, Supplementary Data T2)40 and confirmed the cell identity assignment by ordering the cells in a pseudo-time trajectory based on their overall transcriptomic profile (Supplementary Fig. S4A–C).
Both, the IκBα WT and KO cells contributed to all hematopoietic stem and progenitor populations (Supplementary Fig. S4D). We performed differentially expressed genes (DEG) analysis for all the sub-populations of the LSK by comparing the levels of gene expression in the single cells between IκBα WT and KO and determined if a significant number of cells were consistently expressing a given gene at distinct levels (Supplementary Data 2). We then queried if the NF-κB pathway was over-activated in any of the stem cell/progenitor populations in the IκBα KO. Thus, we plotted the levels of gene expression for genes that are identified as NF-κB related (KEGG pathway ID mmu04064) across the entire LSK populations separated by their genotype, IκBα WT, and KO. Although in some instances, i.e., LT- and ST-HSCs, there might be a few more cells in IκBα KO that have higher levels of this signature, statistical tests rendered them insignificant (Fig. 2E and Supplementary Fig. S4E).
Next, we analyzed the transcriptional changes in the LT-HSC by bulk RNA-seq of purified LT-HSCs. Principal component analysis (PCA) showed samples grouping based on their genotype, particularly, PC1 (48% total variance) separated WT/HET and KO samples (Supplementary Fig. S4F and G). A total of 1476 differentially expressed genes between KO and IκBα WT/HET were detected (shrunken logFC > 1 FDR adjusted p-value < 0.05) with 92% of them being up-regulated (Fig. 3A, Supplementary Data 3). Interestingly, genes that were over-expressed in IκBα KO are genes involved in several inflammatory pathways, including “TnfA signaling via NFκB” (Fig. 2F). Nevertheless, a GSEA for the KEGG gene set of NF-κB (mmu04064) did not show a significant overall enrichment of this pathway in IκBα KO LT-HSCs (Fig. 2G). Moreover, we only found a few (16 out of 105) significantly DEG from this set in our RNA-seq data (Supplementary Fig. S5A). We reason that although elements of inflammatory signaling pathways are deregulated, this deregulation is not the main transcriptional change occurring in IκBα KO.
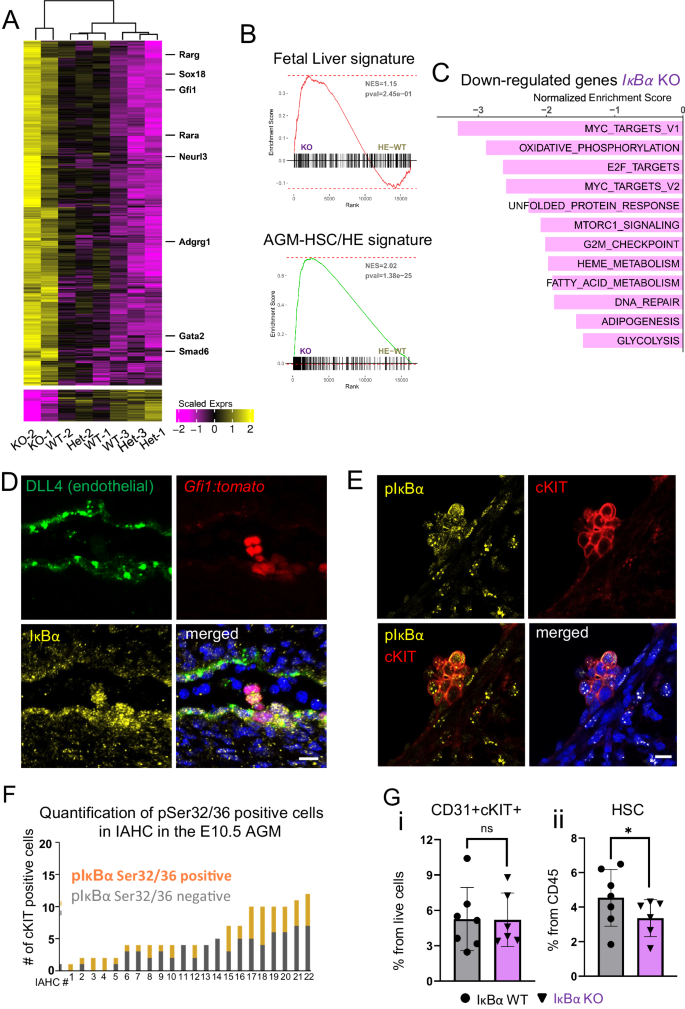
A Heatmap of 1476 differentially expressed genes (DEGs) from the comparison of IκBα KO against WT/HET samples. DEGs were called with absolute shrunken logFC > 1 and adjusted p-values (Benjamini–Hochberg procedure, FDR < 0.05). A Wald-test was applied for DEG analysis. B GSEA comparing IκBα WT/HET and KO LT-HSCs bulk RNA-seq data against the top 300 genes defining (top panel) fetal liver LT-HSCs signature (Manesia et al.42) or (bottom panel) AGM HSCs (Thambyrajah et al. 2023)74. Indicated p-value is a nominal p-value obtained from GSEA (C), Bar plot depicting significantly enriched MSigDB HALLMARK pathways in IκBα KO compared to WT/HET with negative Normalized Enrichment Score (NES) and identified by GSEA from the bulk RNA-seq data (Benjamini–Hochberg procedure (FDR) adjusted p-value < 0.05). D IHC on E11.5 (43–45 s) sagittal AGM section for endothelial marker (DLL4, green) and IκBα (yellow) and DAPI (blue) on Gfi1:tomato (red) embryos. Representative image from n = 4 WT and 5 KO AGM 12 um sections derived from 2 embryos for each genotype. Scale bar: 20 μm. Imaged using an SPE (Leica) with a 20× oil lens. E IHC on E11.5 (42–45 somites) cross-section of AGM for pSer32/36 IκBα (yellow), cKIT (red), and DAPI (blue). Scale bar: 10 μm. Images were taken using an SPE (Leica) with a 20× oil lens and processed using Imaris. F Bar chart depicting the number of p-IκBα Ser32/36 positive cells within cKIT+ IAHC at E10.5 (12 embryos of 33–36 somites). Each bar represents one IAHC. Counts were performed manually. Imaged using an SPE (Leica) with a 20x oil lens. G Bar chart depicting individual values for the frequency of (i) cKIT+(IAHC) in CD31+ cells and (ii) SCA1+EPCR+ positive cells within IAHC of E11.5 (42–46 somites) AGMs of IκBα WT (n = 7) and KO (n = 6) in 3 independent experiments. Statistical test: Multiple linear regression model with Experiment and Genotype covariates, significance obtained from applying t-test to corresponding model coefficient estimate (*p-value < 0.05, ns p-value > 0.05). Bars indicate mean values and error bars refer to ± standard deviation. Source data are provided as a Source Data file.
Instead, we recognized that several elements of the up-regulated pathways in IκBα KO LT-HSCs, including “Interferon alpha,” “IL-6/JAK/STAT”, “Tgf-beta signaling”, and “angiogenesis” (Fig. 2F and Supplementary Data 3) are critical for embryonic AGM-associated HSCs. In a previous study, we found that loss of IκBα caused retention of embryonic gene expression profile in adult intestinal cells33. We therefore examined the expression levels of key embryonic (AGM) HSC-associated genes such as Smad6, Sox18, Gpr56 (Adgrg1), Gata2, and Neurl3 in our FL data set and found that all of them were significantly up-regulated in the IκBα KO FL HSCs (Fig. 3A and Supplementary Fig. S5B). These results suggested that IκBα deficiency affected the maturation of the HSCs from the AGM to the FL stage.
To evaluate this hypothesis further, we performed GSEA of genes up-regulated in IκBα KO LT-HSC against two data sets; one dataset consists of the top 300 genes up-regulated from hemogenic endothelium and HSCs single-cell RNA-seq and are therefore characteristic for nascent AGM HSCs41. The second dataset includes an exclusive FL LT-HSC signature42. Strikingly, the IκBα KO FL LT-HSC correlate at a much higher degree, and significantly with the AGM-associated HSC profile (NES = 2.02, p-value < 0.001), than with the FL LT-HSC signature (NES = 1.06, p-value > 0.05) (Fig. 3B, Supplementary Fig. S5B) indicating that IκBα KO FL LT-HSCs retain a gene signature of the AGM stage. Interestingly, in the significant down-regulated pathways, we find several processes, including MYC-targets, Oxidative phosphorylation, G2M checkpoint, and glycolysis in IκBα deficient LT-HSCs (Fig. 3C), reminiscent of quiescent HSCs and indicating a slow-cycling/dormant cell state.
IκBα KO has reduced cKIT+CD45+SCA1+EPCR+HSC in the AGM
Since we had identified a retention of the AGM HSC signature in IκBα KO LT-HSCs of the E14.5 FL (Fig. 3B), and NF-κB activity is already required during AGM hematopoiesis28,29,30 we aimed to study the spatial distribution of IκBα by performing Immunohistochemistry (IHC) on E11.5 AGM sagittal sections. We used the Gfi1:tomato embryos to enrich for HSC containing IAHC in the AGM11.
Besides the expected cytoplasmic staining, we discovered an accumulation of a punctuated and nuclear signal for IκBα mainly in GFI1 positive HE and IAHC (Fig. 3D and Supplementary Fig. S5D). The nuclear localization of IκBα raised the possibility that we were additionally detecting the form of the (nuclear) IκBα that has been previously linked to stem cell function33,34. Phosphorylated, nuclear IκBα is protected from degradation by SUMOylation43, and is predominantly detected as phosphorylated Ser32,36 IκBα with a specific antibody (p-IκBα). Thus, we examined the presence of p-IκBα in cKIT or GFI1 positive cells and detected nuclear p-IκBα staining mainly in IAHC (Fig. 3E and Supplementary Fig. S5E) with a heterogeneous distribution in around 50% cKIT positive cells (Fig. 3F), strongly suggesting this additional function for IκBα already in the IAHC of the AGM.
We next assessed the impact of IκBα deletion in E11.5 AGMs and compared IκBα WT and KO by FACS analysis. The frequency of the overall CD31+cKIT+/CD45+ (HSPCs) was not altered in IκBα KO embryos when compared with the controls (Fig. 3G(i), Supplementary Fig. S5F). However, when additional markers that restrict this population further to HSCs were included, i.e. by sub-gating for GFI1/EPCR or SCA1/EPCR13,44,45 then we detected a significant decline in the percentage of HSCs in the IκBα KO (Fig. 3G(ii), Supplementary Fig. S5F and S6A, B). Importantly, classical NF-κB activity was not substantially increased in the IAHC/HSC after loss of IκBα as assessed by IHC for p65 and p65 Ser536 (activated form of p65) (Supplementary Fig. S6C–E).
In brief, we detect phosphorylated Ser32,36 IκBα in IAHC and find that the number of HSC precursors in the AGM is lower in IκBα KO. This difference in the number of LT-HSCs between WT and KO increases throughout hematopoietic development (Supplementary Fig. S5C), suggesting that the HSCs population in IκBα KO does not expand at the same rate as their WT counterpart.
EZH2 and IκBα interact in IAHC of the AGM
To highlight the pathways that are over- or, under-represented in LT-HSCs of IκBα deficient fetal livers, we also assessed which transcription factors are likely to trigger the genes up-regulated in IκBα KO LT-HSCs. A GSEA against the ChEA database indicated that the up-regulated genes in IκBα KO LT-HSCs are enriched by several factors, but most notably by EZH2, EED, and BMI1, prominent members of the PRC2 and PRC1 complex (Fig. 4A and Supplementary Data 3). This finding further supported our initial hypothesis for a chromatin function of IκBα in HSCs which requires interaction with the PRC2 complex (Mulero et al.34). To demonstrate this interaction in IAHC, we applied proximity ligation assay (PLA), an antibody-based approach that detects interactions between two proteins of interest. We probed EZH2 and IκBα in this assay on E11.5 AGM sections. Remarkably, we spotted dotted signal, indicative for interactions between EZH2 and IκBα, in nuclei of sparse cells in IAHC (Fig. 4B and Supplementary Fig. S6F, G), adding more evidence for our postulation.
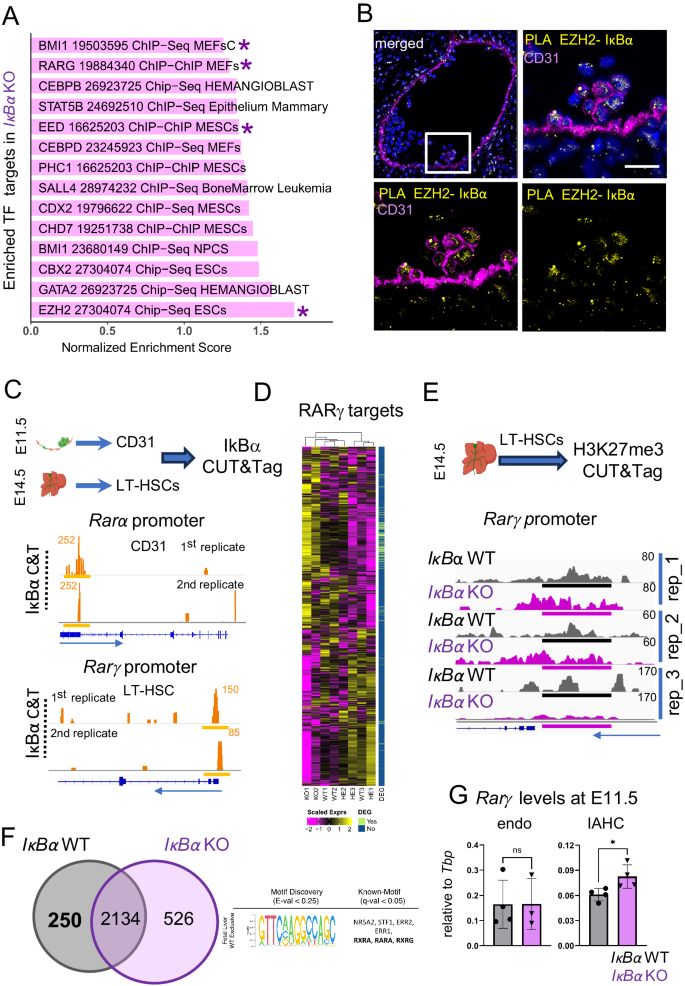
A Bar plot of enriched ChIP data sets from ChEA to in comparison to up-regulated genes in IκBα KO in the bulk RNA-seq data (FDR adjusted p-value < 0.05). NES: Normalized Enrichment Score, asterisks = TF mentioned in the text. B Proximity Ligation assay (PLA) for IκBα and EZH2 on E11.5 (43–46 somites) AGM sections (yellow), endothelial cells (magenta), and nuclear staining (DAPI). Scale bar: 20 μm. Representative image of 3 embryos in 3 independent experiments. Imaged with Stellaris8 (Leica) using a 20× oil lens. C Cut and Tag (C&T) for IκBα on E11.5 AGM (42–46 somites) derived CD31+cells (n = 35 embryos) and E14.5 LT-HSCs (n = 15 embryos). Read pile-ups in the IGV browser at the promoters of Rarα (CD31+) and Rarγ in LT-HSCs are indicated with a yellow line (n = 4 independent experiments). D Heatmap showing the expression levels of RARγ target genes (TRANSFAC TF:M10353) in the RNA-seq samples of E14.5 LT-HSCs from IκBα WT/HET and KO. vertical bar = identified as DEG (light green). E C&T for H3K27me3 in E14.5 LT-HSCs from IκBα WT and KO. Depicted are reads pile-ups in the IGV browser at the promoter of Rarγ (peaks regions, black line = WT, magenta line = KO). n = 5 WT and 8 KO embryos in two independent experiments. F Venn diagram of genes associated with the H3K27me3 peaks detected in E14.5 LT-HSCs of IκBα WT and KO. 457 and 854 genes are exclusively detected in IκBα WT and KO, respectively. Discovered motif (STREME) and associated TF are shown for the unique peaks in IκBα WT. G quantitative PCR (qPCR) for Rarγ expression levels comparing IκBα WT and KO derived E11.5 (42–45 somites) CD31+cKIT- (endothelial cells, WT n = 4, KO n = 3) and CD31+cKIT+ (IAHC, WT n = 4, KO n = 4) samples obtained from n = 2 AGMs per genotype in one experiment. Statistical test: unpaired one-tailed Mann–Whitney U-test (*p-value < 0.05, ns p-value > 0.05). Bars indicate mean values and error bars refer to ± standard deviation. Source data are provided as a Source Data file. C, E created with BioRender.com released under a Creative Commons Attribution-NonCommercial-NoDerivs 4.0 International license.
In brief, we have identified the interaction between PRC2 (EZH2) and IκBα in IAHC of the AGM.
RA signaling is increased in the AGM and FL LT-HSCs of IκBα KO
We then aimed to identify the loci that are regulated by IκBα and PRC2 binding. First, we performed CUT&Tag assay (C&T) with two different anti-IκBα antibodies targeting total IκBα (1st replicate in LT-HSC and both replicates in CD31+) and p-IκBα Ser36 (2nd replicate in LT-HSCs) on sorted LT-HSC and isolated CD31 positive AGM cells (Fig. 4C). C&T assays with IκBα antibodies are challenging, but we obtained enrichment in specific regions with both antibodies to the promoter of the RA receptor, Rarα, in CD31+ cells from AGM, and at the promoter of the paralog, Rarγ, in FL LT-HSCs in both corresponding replicates (Fig. 4C). Intriguingly, both these receptors are over-expressed in the LT-HSCs of IκBα KO (Fig. 3A and Supplementary Data 3) and importantly, GSEA identified significant transcriptional enrichment for RARγ binding targets in LT-HSC of IκBα KO compared to WT/HET genotypes (Fig. 4A).
We further explored Rarγ activation by analyzing the expression levels of RARγ targets (TRANSFAC database ID M10353). We found a significant overlapping (hypergeometric test, p-value < 0.05) between the RARγ targets included in our RNA-seq dataset (2860 genes, Fig. 4D), and the identified DEGs (1476 genes), which were mostly up-regulated in the KO compared to WT/HET embryos (92%, Fig. 3A). Altogether these findings demonstrate an increased RARγ activation in the FL-HSC of the IκBα KO embryos.
To further understand the molecular consequences of IκBα deletion, we next analyzed the PRC2-dependent H3K27me3 status in IκBα WT and KO by C&T assay in FL HSCs. We detected decreased levels of H3K27me3 signal at the Rarγ promoter of IκBα KO LT-HSC (Fig. 4E) in two of out of three replicates. Additionally, 526 and 250 peaks were uniquely detected in the IκBα KO or WT LT-HSC, respectively (Supplementary Data 4). To uncover candidate transcription factors that were driving the epigenetic silencing of these regions in a IκBα-PRC2-dependent manner, we searched for motifs enriched in the unique H3K27 unmethylated regions of the IκBα KO LT-HSC (i.e., signal exclusively detected in 3 replicates of IκBα WT). Remarkably, one discovered motif was significantly similar to the RA receptors RXRγ, RxRα, and RARα known motifs (q-val < 0.05, HOCOMOCO core database) (Fig. 4F), suggesting that the IκBα-dependent PRC2 complex can regulate multiple elements of RA signaling in FL LT-HSCs. Therefore, up-regulation of RA targets could be due to IκBα or PRC2 loss of function.
We then examined if we could detect this perturbation of RA signaling already at the onset of HSC specification. Thus, we isolated CD31+ cKIT- (endo) and CD31+cKIT+ IAHC from E11.5 AGMs of IκBα WT or KO and conducted quantitative PCR (qPCR) for RA signaling elements. Interestingly, Rarγ expression was significantly up-regulated in cKIT IAHC in IκBα KO AGMs (Fig. 4G).
In summary, we have uncovered an IκBα- PRC2 axis that specifically governs RA receptor signaling of RARα and RARγ in LT-HSCs and their precursors.
Increased RA receptors in IκBα KO LT-HSCs impose a slow-cycling state
Since increased RA signaling is associated with dormancy of LT-HSCs in the bone marrow18,46, and we detected changes in metabolic pathways that are associated with dormant cell state (Fig. 3C), we cross-examined the published list of key dormancy signature genes in LT-HSC with the RNA-seq data set of IκBα WT and KO LT-HSCs. Consistent with our assumption, key genes such as p57, Tgm2, Rbp1, Cyp26b1 and Ly6a were up-regulated, while Myc and Cdk6 showed lower expression in IκBα KO LT-HSCs, a pattern compatible with LT-HSC in a dormant state (Fig. 5A). IκBα KO LT-HSCs also express higher levels of the transcription factor EB (Tfeb) (Fig. 5A and Supplementary Data 3), whose elevated levels is a further indicator of dormant cell47,48.
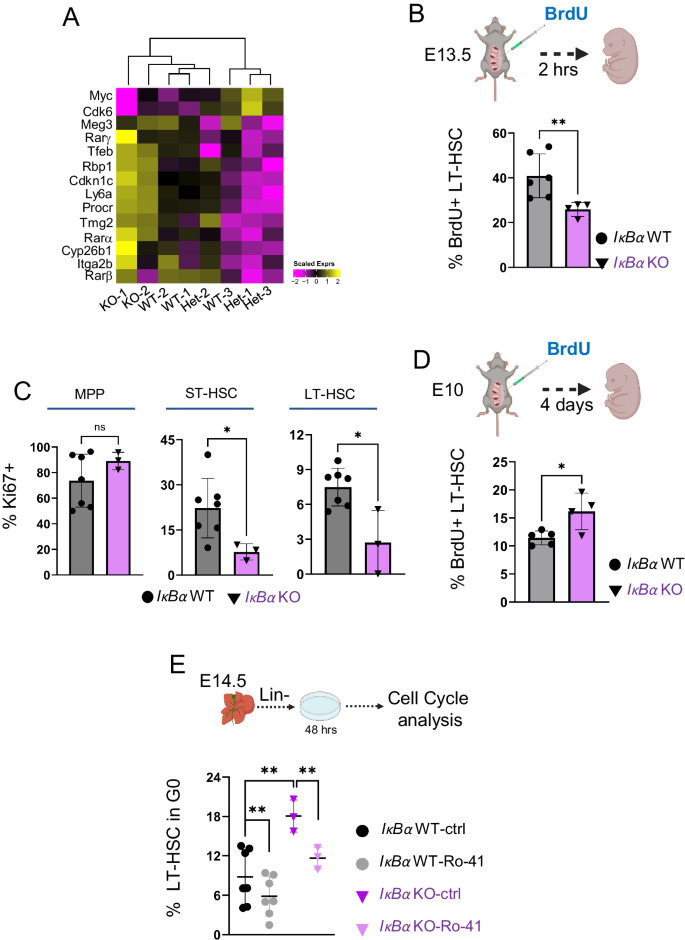
A Heatmap showing the scaled expression levels of dormancy-associated genes (Cabeza-Wallscheid, 2017) from IκBα WT/Het and KO E14.5 LT-HSCs RNA-seq samples. B Bar chart with the frequencies of BrdU+ E14.5 LT-HSC after 2 h. in vivo labeling with BrdU in E13.5 IκBα WT (n = 6) or KO (n = 4) obtained from n = 10 embryos in 2 independent experiments. Statistical test: unpaired one-tailed t-test with Welch correction (**p-value < 0.01). Bars indicate mean values and error bars refer to ± standard deviation. C Bar chart with percent of Ki67+ cells in indicated cell populations of E14.5 IκBα WT (n = 7) or KO (n = 3). MPP = multipotent progenitors, ST = Short-term HSCs. n = 7 embryos. Statistical test: unpaired one-tailed Mann–Whitney U-test (*p-value < 0.05, ns p-value > 0.05). Bars indicate mean values, and error bars refer to ± standard deviation. D Bar chart with the percent of BrdU+ cells within the E14.5 FL LT-HSC after in vivo labeling of E10.5 IκBα WT (n = 5) or KO (n = 4) embryos. Statistical test: unpaired one-tailed t-test with Welch correction (*p-value < 0.05). Bars indicate mean values, and error bars refer to ± standard deviation. E Bar chart with the percentage of LT-HSC in G0 phase of the cell cycle after 48 h of ex vivo culture of E14.5 IκBα WT (n = 7) or KO (n = 3) FL lin- cells treated with 10 uM of Ro-41 or DMSO. Data originates from 2 independent experiments with 10 embryos. Statistical test: paired one-tailed t-test for Ro-41 against DMSO comparisons and unpaired one-tailed t-test with Welch correction for WT against KO, in DMSO, comparison (**p-value < 0.01). The horizontal lines indicate mean values and error bars refer to ± standard deviation. Source data are provided as a Source Data file. B, D, E were created with BioRender.com released under a Creative Commons Attribution-NonCommercial-NoDerivs 4.0 International license.
Next, we investigated functionally whether IκBα deficient LT-HSCs present an RA-dependent dormant phenotype. We first determined their proliferation rate in vivo by injecting 2 mg of BrdU peritoneally into E13.5 pregnant females (Fig. 5B). After 2 h, the females were sacrificed to analyze the cell cycle status of FL LT-HSCs from WT and KO embryos by flow cytometry. We detected that a significantly lower proportion of LT-HSC had incorporated BrdU in the IκBα deficient embryos (Fig. 5B and Supplementary Fig. S7A), indicating a slower cycling of these cells. Next, we determined Ki67 levels by flow cytometry and detected significantly lower Ki67+ ST- and LT-HSCs in E14.5 FL HSCs of IκBα KO embryos (Fig. 5C and Supplementary Fig. S7A and B).
To evaluate the proliferation kinetics over time in the IκBα -deficient LT-HSCs, we studied the extent of BrdU label retention of HSCs from AGM to FL stage. After establishing that we could label around 80% of the LT-HSC regardless of genotype with two pluses of BrdU at E10 and E11 (Supplementary Fig. S7C and D), pregnant females with E10.5 embryos were pulse-labeled with BrdU and analyzed for label-retaining LT-HSCs in the FL of E14.5 embryos. We detected a higher frequency of BrdU+ cells in the IκBα KO LT-HSC compartment, corresponding to lower cycling events over time (Fig. 5D and Supplementary Fig. S8A). In short, all three approaches indicated a lower cycling rate of IκBα deficient LT-HSCs.
To determine whether the elevated RA signaling was driving the IκBα deficient LT-HSC low cycling status, we purified lin-depleted E14.5 FL cells from IκBα WT or KO embryos and treated them with either DMSO or 1 μM of the RARα inhibitor Ro-415253 (hereafter Ro-41) for 2 days. The cells were then examined for their cell cycle status (Fig. 5E). We found that treatment with Ro-41 increased the frequency of cycling cells both in the WT and IκBα KO LT-HSCs. Notably, treating IκBα KO LT-HSCs with a RARα specific inhibitor was sufficient to reduce the number of G0 cells to similar levels of the IκBα WT (Fig. 5E and Supplementary Fig. S8B), further supporting the concept that increased RA signaling is the causal mediator of cellular dormancy in the IκBα LT-HSCs.
IκBα KO LT-HSC shows a functional dormant phenotype in vivo and in vitro
Next, we aimed to investigate the activation capacity of LT-HSCs by measuring the clonogenic activity of individual IκBα WT and KO LT-HSCs in vitro (Supplementary Fig. S9A). LT-HSCs that are in a dormant/slow-cycling state need more time to proliferate than their already activated counterparts18. In fact, dormant HSCs show a paradoxical behavior upon stress stimuli, including transplantation assays or ex vivo culture: the cells become activated with a delay which has been attributed to their need to exit the quiescent state first. However, once activated, dormant cells possess a higher self-renewal and repopulation capacity than their already activated HSC counterparts49, and even outperform their WT equivalent over time18,19. We, therefore, compared the clonogenic potential of IκBα WT and KO LT-HSC in vitro by sorting single LT-HSCs into individual wells and assessing for the cell number of the clonogenic colonies after 10 days. We detected an overall trend towards increased colony numbers from IκBα KO LT-HSC with the small colonies (10–100 cells) showing the highest increase (Supplementary Fig. S9Aii, iii), suggesting that IκBα KO LT-HSC have a delayed response to stress (more small colonies) but greater proliferation potential (higher overall number of colonies) (Supplementary Fig. S9A).
Ultimately, we assessed the dormant phenotype in serial transplantation settings (Fig. 6A). We evaluated the hematopoietic activity of IκBα KO LT-HSCs (200 per recipient) or LSK (1000 cells) in competition with 500.000 lin- depleted bone marrow WT cells, respectively, in transplantation assay (Fig. 6A). Indeed, PB blood analysis 4 weeks after the transplantation showed a significantly lower blood chimerism from IκBα KO LT-HSCs (Fig. 6B) and LSK cells (Supplementary Fig. S9 B, C). But in the following bleedings (8, 12, and 16 weeks), the IκBα KO cells progressively reached a similar level of engraftment to their WT counterparts (Fig. 6B). By 4 months after transplantation, there was no significant difference between the genotypes in their ability to contribute to lineage differentiated cells in recipients (Supplementary Fig. S9E). We further conducted secondary transplantations (Fig. 6A and Supplementary Fig. S9B) and detected a trend to a higher repopulating capacity of IκBα KO over time that reached statistical significance by 3 months after the transplantation (Fig. 6C and Supplementary Fig. S9D). Moreover, all blood lineages were reconstituted by both IκBα WT and KO LT-HSCs in primary and secondary recipients (Supplementary Fig. S9E). We noted enhanced donor contribution to the LT-HSC population of secondary recipients from IκBα KO (primary) LT-HSC donors (Fig. 6D). Thus, we further assessed the self-renewal capacity of IκBα KO LT-HSCs in tertiary transplantations. Remarkably, 30% of the IκBα KO LT-HSC continued to contribute significantly (>10% chimerism) to the peripheral blood of the tertiary recipients after 8 weeks, whereas none of IκBα WT LT-HSC recipients showed donor chimerism after 3 serial transplantations (Fig. 6E and Supplementary Fig. S9F), supporting the fact that more IκBα KO LT-HSC are in a deep quiescent state.
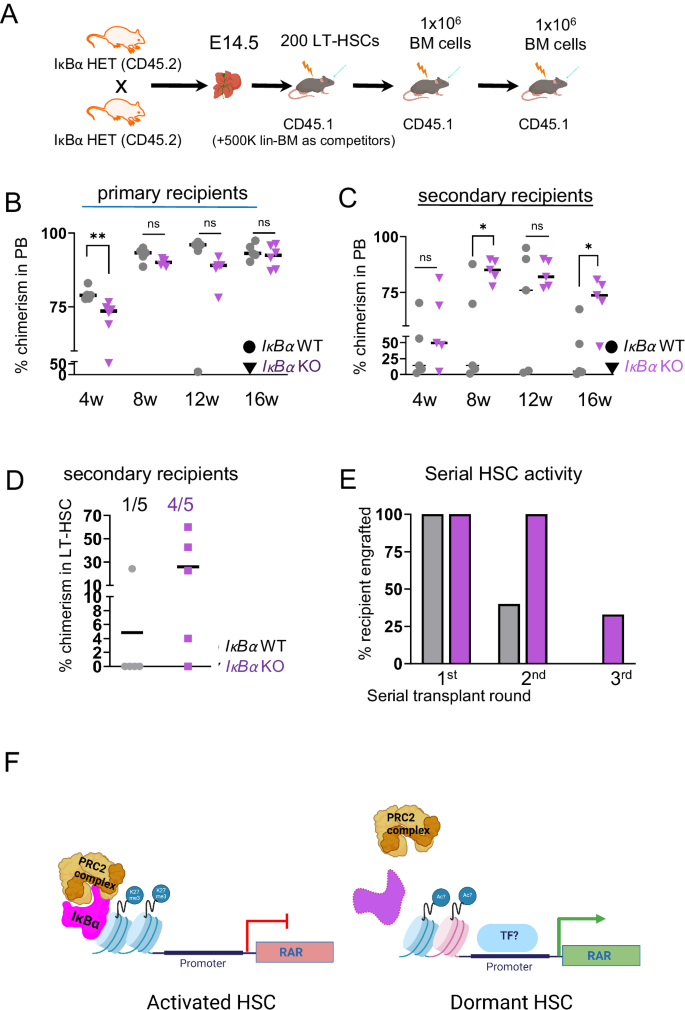
A Scheme of the transplantation experiment. LT-HSCs were FACS purified from E14.5 IκBα WT and KO fetal liver (CD45.2) and transplanted serially into lethally irradiated donors (CD45.1). B Scatter plot with the percentage of donor chimerism (CD45.2) in the peripheral blood of primary recipient (CD45.1) in 4-week intervals with n = 5 WT and n = 6 KO recipients. Recipients of 200 purified LT-HSCs from E14.5 fetal liver of pools of 3 WT and 4 KO IκBα embryos. Statistical test: unpaired one-tailed Mann–Whitney U-test for all pairwise comparisons (**p-value < 0.01, ns p-value > 0.05). The horizontal lines indicate mean values. C Scatter plot with the percentage of donor chimerism (CD45.2) in the peripheral blood of the secondary recipient (CD45.1) in 4-week intervals. Each secondary recipient received 1 × 10⁶ nucleated bone marrow cells from individual primary recipients with n = 5 WT and n = 5 KO recipients. Statistical test: unpaired one-tailed Mann–Whitney U-test for all pairwise comparisons (*p-value < 0.05, ns p-value > 0.05). The horizontal lines indicate mean values. D Scatter plot showing the percentages of donor chimerism (CD45.2) in the bone marrow LT-HSC compartment of secondary recipients (from C) at 16w. The horizontal lines indicate mean values. Ratios indicate the number of animals with chimerism >1% E Bar chart depicting the percentage of animals reconstituted with more than 10% of donor cells (IκBα WT or KO) at each round of serial transplantation. F Schematic summary of the main findings i IκBα associates with PRC2 complex at RAR gene promoters and silences RA signaling after a stress stimulus. ii in the absence of IκBα, this silencing is lost, and RA signaling is hyper–activated. Source data are provided as a Source Data file. A, F created with BioRender.com released under a Creative Commons Attribution-NonCommercial-NoDerivs 4.0 International license.
In summary, we have shown that loss of IκBα deregulates RA signaling in a PRC2-dependent manner in the embryonic HSC compartment (please see model in Fig. 6F), from the onset of their specification in the AGM to the fetal liver stages. Consequently, we detect less LT-HSCs, and the remaining LT-HSCs in IκBα KO exhibit molecular and functional characteristics of dormant HSCs.
- SEO Powered Content & PR Distribution. Get Amplified Today.
- PlatoData.Network Vertical Generative Ai. Empower Yourself. Access Here.
- PlatoAiStream. Web3 Intelligence. Knowledge Amplified. Access Here.
- PlatoESG. Carbon, CleanTech, Energy, Environment, Solar, Waste Management. Access Here.
- PlatoHealth. Biotech and Clinical Trials Intelligence. Access Here.
- Source: https://www.nature.com/articles/s41467-024-48854-5