Combined overexpression of NEUROG2, ATOH7, ISL1, and POU4F2 leads to the direct conversion of RGC-iNs
NEUROG2, ATOH7, ISL1, and POU4F2 participate in RGC development and maturation. To explore the idea that their forced expression could convert stem cells directly into RGCs, we used a doxycycline (dox)-inducible third-generation Tet-ON (TetO) promoter coupled to a polycistronic NEUROG2, ATOH7, ISL1, and POU4F2 (NAIP2) gene cassette (Fig. 1a). After transient transfection into IMR90.4 POU4F2-p2A-tdTomato cells (Fig. 1b) we observed that untreated controls (CTLs) had a PSC-like morphology (Fig. 1c) and dox treated TetO-NAIP2 transfected cells were PSC-like but also included sparsely populated neurons (Fig. 1d). These were not POU4F2-tdTomato+ and the neuronal looking cells were quickly overtaken by proliferating PSCs. To confirm that the reporters were functioning properly, the IMR90.4 POU4F2-p2A-tdTomato and WA09 POU4F2-p2A-h2b-mNeonGreen PSC lines integrated with TetO-NAIP2 were differentiated as 3D retinal organoids and confirmed to express fluorescent proteins only in RGCs (Fig. 1e, f). Encouraged by the partial morphological conversion of stem cells into RGCs, we next stably integrated the TetO-NAIP2 cassette into the CLYBL SHS, a site that supports sustained transgene expression22. Integration was accomplished with high-fidelity EnCas12a and an appropriate cRNA for gene targeting (Fig. 1g). Despite stable integration, as determined by the acquisition of zeocin resistance, dividing non-neuronal flat cells remained problematic for the long-term growth of the induced neurons.
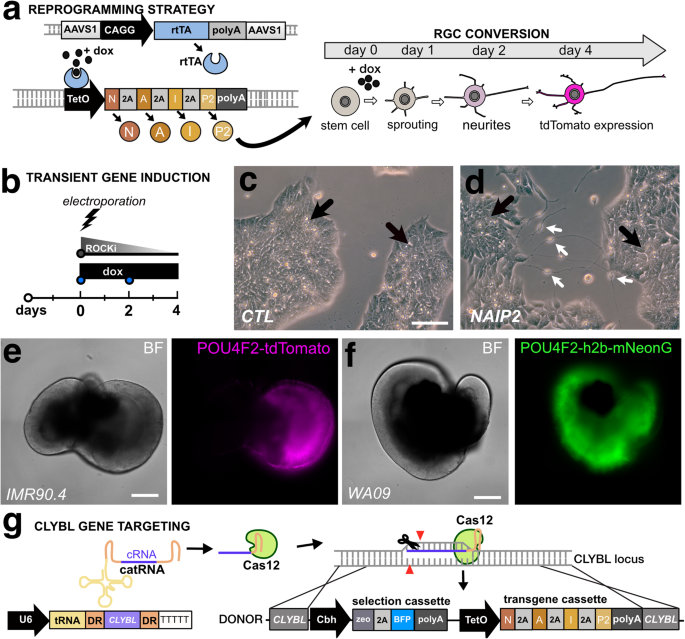
a A conceptual diagram for a 3G Tet-ON system where doxycycline binds to constitutively expressed rtTA to induce polycistronic expression of NEUROG2, ATOH7, ISLET1, and POU4F2 (NAIP2) leading to conversion of RGC-like neurons. b Electroporation approach for the transient transfection of the NAIP2 transgene package. c PSCs that were transiently transfected with control (empty) or d NAIP2 plasmids and treated with dox for 3 days. Black arrows = PSCs, white arrows = converted neurons. Brightfield and fluorescent images of e the POU4F2-tdTomato+ reporter in a 66-day-old retinal organoid in the IMR90.4 genetic background and f a 65-day-old POU4F2-h2b-mNeonGreen+ retinal organoid in the WA09 genetic background. g U6 promoter-driven expression of an AsCas12a cRNA targeting the CLYBL safe harbor site for insertion of a zeocin selectable Tet-inducible transgene cassette. Scale c, d = 100 µm, e, f = 400 µm.
BMP inhibition and TF overexpression synergistically enhance the morphological conversion of iNs
Simultaneous expression of NEUROG2 and dual SMAD inhibition (to block BMP and TGF-β) can generate human patterned forebrain-like induced neurons (hpiNs)10. To explore whether this could be adapted for RGCs, we simultaneously expressed NAIP2 and inhibited BMP signaling. IMR90.4 POU4F2-tdTomato reporter PSCs harboring empty (CTL) or NAIP2 cassettes were treated with 1.0 μg/mL dox (condition 1), 100 nM LDN (condition 2), or LDN plus dox (condition 3) and assessed for changes in morphology (Fig. 2a). Empty TetO cassette integrated CTL cells treated with LDN plus dox failed to generate neurons (Fig. 2b), whereas TetO-NAIP2 integrated cells (condition 3) developed long branched neurites by day 6 (Fig. 2c). Interestingly, while dual SMAD inhibition with both LDN and SB-431542 (SB) was reported to produce patterned forebrain neurons, its combined use did not improve RGC-iN differentiation more than LDN alone (Supplementary Fig. 1). Although the NAIP2 combination worked well with BMP inhibition, we wanted to evaluate the contribution of each TF so we integrated each gene (NEUROG2, ATOH7, ISLET1, or POU4F2) individually as Tet-inducible cassettes and compared their morphologies after LDN/dox induction (Fig. 2d–g). NEUROG2 expression led to efficient neural conversion over the first 2 days with long neurites by day 6 (Fig. 2d), whereas neurite formation in NAIP2-nc (NAIP2 integrated and zeocin selected but not clonally isolated) RGC-iNs typically occurred in as little as 24 h, indicating a faster rate of differentiation than NEUROG2 alone. POU4F2 overexpressed cells (Fig. 2e) formed stout-looking neurons with stubby neurites that appeared only partially converted, ATOH7 overexpressed cells (Fig. 2f) became a mixture of flat cells and sparsely populated neurons and ISL1 cells (Fig. 2g) became flat with no recognizable neuronal features. Overall, only NAIP2 and NEUROG2 expressing cells produced robust levels of neurons.
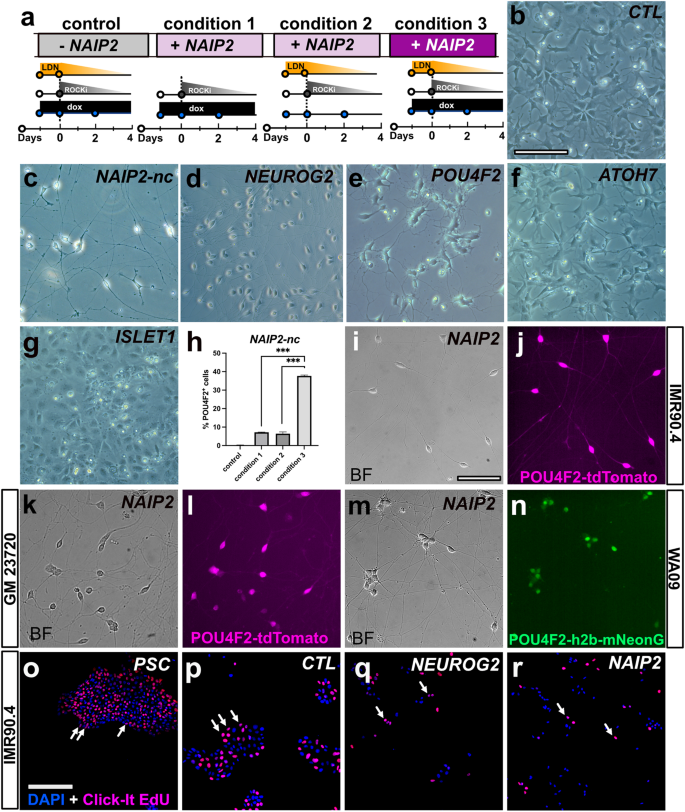
a Timeline of LDN193189 and/or dox treatments of POU4F2-tdTomato PSCs with an integrated empty cassette (control) or NAIP2 cassette (conditions 1–3). Brightfield images of dox treated b empty cassette control cells, c NAIP2-nc, d NEUROG2, e POU4F2, f ATOH7, and g ISLET1 cells after 6 days. NAIP2-nc = not clonally selected. h Quantification of %POU4F2+ cells at day 6 relative to DAPI in the empty cassette control and conditions 1–3 illustrated in (a). *P < 0.05, **P < 0.01, ***P < 0.001, ns P > 0.05, n = 3. Error bars are reported as standard deviation (SD). i–n NAIP2 RGC-iNs from different genetic backgrounds differentiated and imaged in brightfield and POU4F2+ tdTomato fluorescence for clonally selected i, j IMR90.4 and k, l GM23720 PSCs, and m, n brightfield and POU4F2 + h2b-mNeonGreen fluorescence for WA09 PSCs. Click-iT EdU staining in o undifferentiated PSCs and 2-day LDN/dox treated p control, q NEUROG2, and r NAIP2 cells co-stained with DAPI. Arrows in O-R indicate EdU+ cells. Scale b–g, i–n = 100 µm, o–r = 200 µm.
Endogenous POU4F2 reporter expression accompanies RGC conversion
To corroborate the identity of RGCs, we utilized the POU4F2–tdTomato reporter to visualize real-time changes in endogenous POU4F2. Control and NAIP2 PSCs were treated with dox (condition 1), LDN (condition 2), or both (condition 3) and changes in tdTomato expression were evaluated by microscopy. After 1 week, control cells failed to express tdTomato, NAIP2 conditions 1 and 2 had low levels of tdTomato+ and NAIP2 condition 3, which received both LDN and dox, had the highest levels (~40%) of tdTomato+ cells with respect to total DAPI + cells (Fig. 2h).
During RGC-iN formation many flat cells persisted after an initial burst of neurogenesis. We reasoned that cell heterogeneity was limiting conversion so we clonally selected PSCs to obtain PSC lines with greater differentiation potential. Each PSC clone was independently differentiated and the resulting morphologies were observed to range from enriched neurons (Supplementary Fig. 2a, d, e) to unwanted flat cells (Supplementary Fig. 2b, c, f). For all subsequent experiments, a PSC clone with a high conversion efficiency (NAIP2; Fig. 2a) was used. To ensure that conversion was not cell-line dependent, we introduced TetO-NAIP2 into two additional PSC lines for a total of 3 genetic backgrounds. GM23720 iPSCs and WA09 ESCs were made with POU4F2-p2A-tdTomato and POU4F2-p2A-h2b-mNeonGreen reporters, respectively. In all NAIP2 lines, LDN/dox induced efficient neural conversion (Fig. 2i–n). Further supporting the idea that NAIP2 was driving differentiation, Click-iT EdU (5-ethynyl-2’-deoxyuridine) staining showed a reduced level of cell cycling beyond what was seen in NEUROG2 controls (Fig. 2o–r). Overall, this confirmed that the RGC-iN conversion triggered by NAIP2 led to early cell-cycle exit and differentiation and was possible across genetic backgrounds.
Individual transcription factors induce partial reprogramming
We also sought to explore how TFs alone or in combination influenced POU4F2-tdTomato reporter expression (Fig. 3a–l). Compared with controls that showed no fluorescence (Fig. 3a), NAIP2 cells showed high levels of POU4F2-tdTomato+ (Fig. 3b). NEUROG2 overexpressing neurons exhibited no POU4F2-tdTomato fluorescence at four days, however, a small population of POU4F2-tdTomato+ cells emerged by 6 days (Fig. 3c; white arrows). This was not surprising since POU4F2 is also present in the developing forebrain and NEUROG2 induces forebrain-like conversion10. Though ATOH7 led to far fewer neurons, those that formed were POU4F2-tdTomato+ (Fig. 3d). Flat ISL1 overexpressing cells were largely POU4F2-tdTomato negative (Fig. 3e) and POU4F2 overexpressing cells were only weakly fluorescent (Fig. 3f). This data suggested that while NEUROG2, ATOH7, and POU4F2 each contributed, their combined activity was far more effective in triggering neurite outgrowth and endogenous POU4F2-tdTomato gene expression.
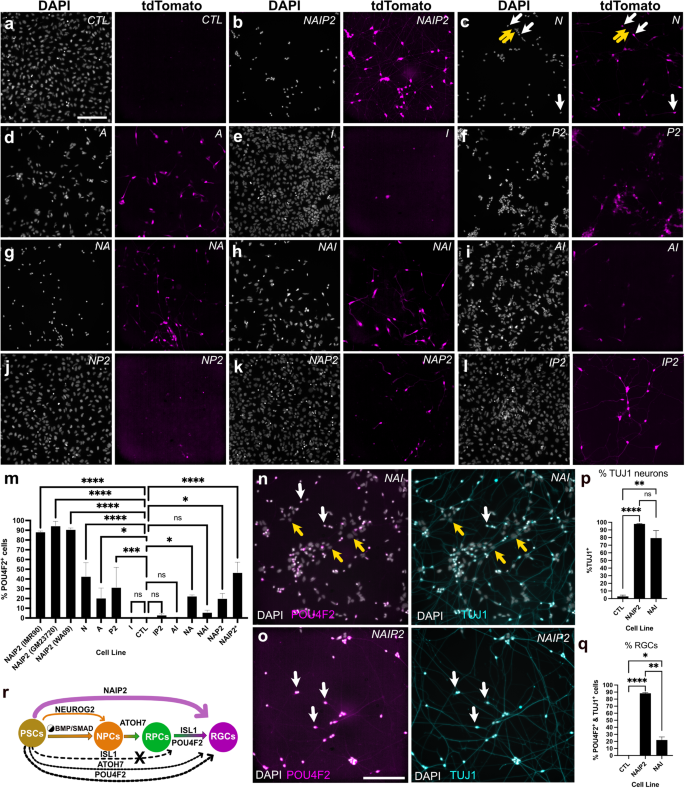
a–l Representative images of PSCs induced for 6 days with LDN/dox and different TFs alone (N, A, I, P2) or in combination (NAIP2, NA, NAI, AI, NP, NAP2, IP2) with imaging for DAPI (left) and POU4F2-tdTomato+ (right). TdTomato panels are intentionally uniformly overexposed so that samples with weaker fluorescence (d–l) could be detected. m Percent of POU4F2-tdTomato+ cells on day 6 quantified as POU4F2+ cells relative to DAPI. For the WA09 background, this was determined by measuring h2b-mNeonGreen+ relative to DAPI. n NAI iNs and o NAIP2 RGC-iNs showing POU4F2-tdTomato expression (left) and TUJ1 staining (right). NAI cells were additionally labeled with DAPI. p %TUJ1+ neurons and q %TUJ1+/POU4F2+ co-labeled RGC-iNs. r A diagram summarizing the key events driving differentiation from immature PSCs to mature RGCs. White arrows=overlapping tdTomato+ signal; yellow arrows=absence of a signal. *P < 0.05, **P < 0.01, ***P < 0.001, ****P < 0.0001, ns P > 0.05, n = 3. Error bars are reported as standard deviation (SD). Scale a–l = 200 µm; n, o =100 µm.
Next, we evaluated how neural conversion was influenced by different binary and ternary TF combinations including NEUROG2–ATOH7 (NA), NEUROG2–ATOH7–ISL1 (NAI), ATOH7–ISL1 (AI), NEUROG2–POU4F2 (NP2), NEUROG2–ATOH7–POU4F2 (NAP2), and ISL1–POU4F2 (IP2) (Fig. 3g–l). In terms of morphology and POU4F2-tdTomato expression, NAIP2 was superior to all binary and ternary TF combinations. The next best was NA (Fig. 3g) which had more POU4F2-tdTomato+ neurons than NEUROG2 but less than NAIP2. NAI (Fig. 3h) produced fewer converted cells and lower levels of tdTomato than NA. Experiments performed with AI, NP2 NAP2 and IP2 overexpression (Fig. 3i, j, k, l), resembled ISL1 in that most cells were flat and POU4F2-tdTomato negative. Comparisons between different TF combinations (Fig. 3m) also demonstrated that NAIP2 was the most efficient, with conversion efficiencies of 88%, 94%, and 90% in IMR90.4, GM23720, and WA09 PSCs, respectively. While both NAI and NAIP2 generated TUJ1+ neurons (Fig. 3n, o) at efficiencies of 98% and 79%, respectively (Fig. 3p), the number of POU4F2-tdTomato+ neurons was significantly higher for NAIP2 (88%) than for NAI (21%) (Fig. 3q). This demonstrated that while NAI (and other TF combinations) are efficient in making neurons, NAIP2 is the most efficient in making POU4F2 + RGC-like cells. A working model of RGC conversion highlights the cumulative importance of NAIP2 TFs for RGC conversion (Fig. 3r).
NAIP2 induced RGC-iNs exhibit RGC-like transcriptional profiles
To interrogate the transcriptional identities of induced neurons we carried out RNA-seq on PSCs (n = 3), dox-treated CTL (n = 5), and NEUROG2, NA, and NAIP2 expressing cells (n = 4 each) at 1 week (Supplementary Table 1). Principal component analysis (PCA) from DESeq2 demonstrated that biological replicates were consistent across experiments and clustered separately for PSCs, controls and RGC-iNs (Fig. 4a-upper panel). NEUROG2, NA, NAIP2, and NAIP2-nc neurons were also clearly distinct from one another confirming that they had different gene expression profiles (Fig. 4a-lower panel). Global population level differences were illustrated with a Venn diagram depicting the number of genes expressed in each group (normalized count >100) (Fig. 4b). While there was much overlap, treatment groups were distinct from one another. Visualization of the top 500 genes in NAIP2 RGC-iNs (Fig. 4c) revealed that NEUROG2, NA, and NAIP2 groups were more related than controls or PSCs. Zeocin-treated non-clonally selected NAIP2-nc cells consisted of flat cells and neurons while zeocin-treated and clonally selected NAIP2 cells were highly enriched for neurons. The gene expression differences observed in Fig. 4c were consistent with these morphological characteristics. Recognizing the importance of clonal selection, all further analysis was conducted with clonal-selected NAIP2 cells. The top 50 highly differentially expressed genes (DEGs) in NAIP2 cells, including the 4 individual NAIP2 TFs, were further compared with publicly available single-cell sequencing data which showed a strong similarity to human RGCs as opposed to other retinal neurons (Supplementary Fig. 3a–f)23. We also used DAVID pathway analysis (Fig. 4d) to identify biologically relevant signaling pathways in NAIP2 cells relative to control cells. UP_KEYWORDS and UP_SEQ_FEATUREs identified ligand-gated ion channels, voltage-gated ion channels, neurogenesis and potassium/chloride channels, which are all important for neural cell identity and function. Likewise, KEGG_PATHWAYS identified calcium signaling, neuroactive ligand interactions and cAMP/MAPK signaling. In all neurons (NAIP2, NA and NEUROG2) pan-neuronal markers (e.g., RBFOX3, TUBB3, SYT1, DLG4, and SYP) were detected (Fig. 4e). By contrast, NAIP2 samples expressed higher levels of RGC enriched genes (e.g., POU4F1, POU6F2, NRN1, SYT13, and NEFL), thus supporting their RGC identity. Likewise, we performed RNA-seq on WA09 and GM23720 genetic background NAIP2 cells which similarly expressed RGC genes (Supplementary Fig. 4).
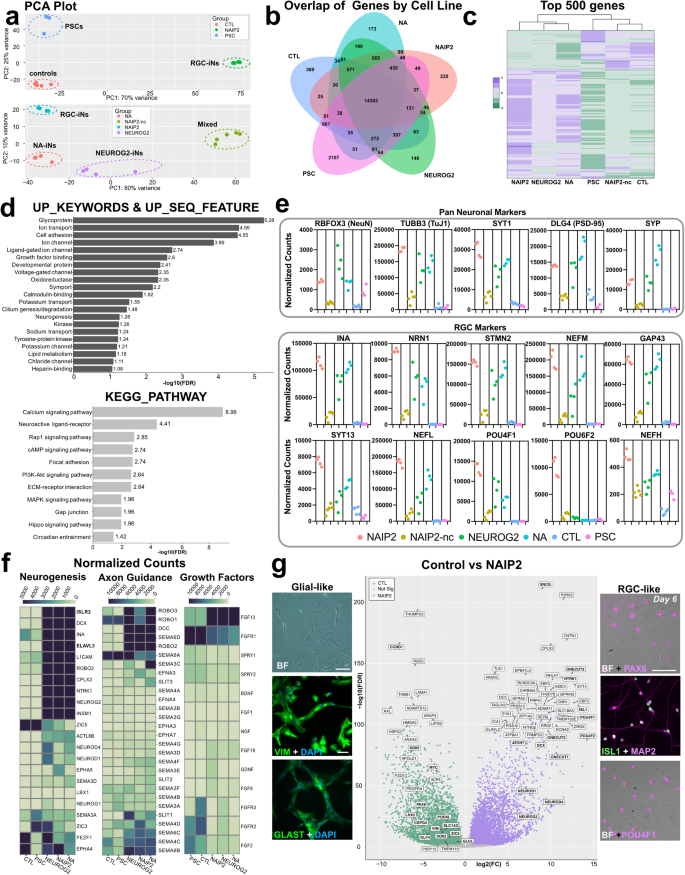
a Principal Component Analysis (PCA) plot of day 6 CTL, NAIP2 and PSC (top) and NEUROG2, NA, NAIP2-nc and NAIP2 cells (bottom). b Venn diagram of the number of genes expressed in each sample (normalized count >10). c Heatmap of the top 500 genes expressed in the NAIP2 samples. d Bar graph depicting −log10(FDR) of significantly differentially expressed pathways between NAIP2 and CTL samples identified by DAVID in Uniprot (top) and KEGG Gene Ontology (bottom) databases. e Scatterplots showing normalized counts of pan-neuronal and RGC marker genes in each treatment group. f Heatmaps of genes expressed within the neurogenesis (left), axon guidance (center), and growth factor (right) pathways. g Volcano plot highlighting log2(FC) gene expression between the CTL and NAIP2 samples plotted with respect to −log10(FDR). Immunostaining for VIM and GLAST in control cells (left) and PAX6, ISL1, POU4F1, and MAP2 in NAIP2 samples (right). FDR = false discovery rate. FC = fold change. Scale g = 85 µm. NAIP2-nc = RGC-iNs from non-clonally selected PSCs.
During early RGC growth, there is an active process of axon outgrowth. Both ISLR2 and ELAVL3 (Fig. 4f), which are involved in RGC axonogenesis, were expressed in NAIP2 cells but not in PSCs or controls24. Functional guidance cues also steer axons towards/away from cellular targets. While some ephrin ligands involved in cell-to-cell communication were highly expressed in non-neuronal controls (e.g., EFNB1, EFNB2, EPHA2) many were upregulated in neurons (e.g., EFNA3, EFNB3, EPHA5, and EPHB2), and in RGC-iNs their expression increased from 1 to 4 weeks (Supplementary Fig. 5a, b). ROBO2/3 and DCC receptors, which mediate RGC axonogenesis, were present in neurons at 1 week (Supplementary Fig. 5c, d)25. While ROBO2/3 decreased over time in RGC-iNs, their ligands SLIT1 and -2 increased. Semaphorins (Semas) have different functional roles depending on the tissue type. Plexin (PLXN) family Sema receptors (PLXNA1/3/4 and PLXNB1) were highly upregulated in RGC-iNs over time (Supplementary Fig. 5e) which makes sense given their role in RGC decussation at the optic chiasm. Although SEMA3C was highest in NA cells, it was also detected in other cells including NAIP2 RGC-iNs (Supplementary Fig. 5f). Class 4 (SEMA4C/D/F) and class 6 (SEMA6B/C/D) Semas, were each temporally upregulated in RGC-, NEUROG2-, and NA-iNs (Supplementary Fig. 5g, h). Conversely, SEMA6A was only highly expressed in PSCs and controls, but not neurons, consistent with previous reports26,27. Together, these data confirm that RGC-iNs express a rich mixture of axon guidance cues representative of RGC development.
Blocking BMP signaling without NAIP2 promotes transient glia-like cell formation
Dual SMAD inhibition can drive both neuronal28 and glial differentiation29,30. While LDN/dox treatment in NEUROG2 and NAIP2 cells led to efficient neural conversion, the same treatment in control cells led to non-neuronal flat cells. A volcano plot highlighted differences between control and NAIP2 cells at 1 week (Fig. 4g). Control samples expressed numerous glia-associated genes (e.g., VIM, SLC1A3 (GLAST), and SOX2), of which VIM and GLAST were further confirmed by immunocytochemistry (ICC) (Fig. 4g; left). Other glia-expressed genes, including LHX2 and SOX931, were also identified as significantly upregulated relative to RGC-iNs (Fig. 4g). Genes associated with glial proliferation included CCND1, KLF4, MYC, PODXL, and SOX2, however, these are not exclusive to glia and might indicate immaturity since other glial genes (e.g., GFAP, RLBP1, and S100B) were not detected. Pan-neuronal (e.g., SYN1, NCAN, NCAM1, RBFOX3) and RGC-enriched genes (e.g., POU4F1, ISL1, GAP43, STMN2, and SNCG) were not expressed in CTLs (Supplementary Fig. 6a). PAX6, ISL1 and POU4F1 were additionally confirmed to be expressed in neurons by ICC (Fig. 4g, right). PAX6, which is known to be expressed in both neurons and glia, was also detected in differentiated CTL cells. While CTLs initially resembled glia, subsequent analyses up to 3 weeks revealed that glial markers became reduced (e.g., VIM) or disappeared altogether (e.g., GLAST) (Supplementary Fig. 6a). While we still do not know the cellular identity of these cells, gene set enrichment analysis (GSEA) revealed epithelial-to-mesenchymal transition (EMT) as an important active process (Supplementary Fig. 6b, c). Some EMT-associated genes, including ALX4, FOXC2, GSC, MSX1/2, NR2F1, SNAI2 (SLUG), SNAI3 (SMUC), TGFB1/2, and TWIST1 were readily detected, however others, including CCL5, FOXC1, SNAI1 (SNAIL), and ZEB1/2, showed very little expression (Fig. 6d, e).
Temporal regulation of gene expression reflects neuronal maturation
To evaluate temporal changes in gene expression, we performed bulk RNA-seq for RGC-iNs up to 4 weeks (Fig. 5a) and controls for 3 weeks (Supplementary Table 1). RGC-iNs and controls (n = 4 each) showed a diverging pattern of global gene expression that clustered as distinct groups at each time point (Fig. 5b). A Venn diagram highlighted distinct DEGs for each time point (Fig. 5c). To visualize whether POU4F2 is part of a larger RGC transcriptional network, we generated dual color p2A-mNeonGreen and p2A-tdTomato reporters for the endogenous POU4F1 and POU4F2 loci, respectively, and stably integrated TetO-NAIP2 as previously described. After observing no constitutive reporter expression in PSCs, we began NAIP2 induction and saw considerable overlap in POU4F1 and -2 expression (Fig. 5d; yellow arrow), similar to the pattern in retinal organoids (Fig. 5e). Upregulation of POU4F1-p2A-mNeonGreen in NAIP2-induced cells indicated that POU4F1 and -F2 might be co-regulated and that RGC-iNs were heterogeneous. After dox removal, NEUROG2 and ATOH7 were downregulated, while the later RGC markers ISL1 and POU4F1 remained constant (Fig. 5f, g). The fact that ISL1 and POU4F2 were expressed was not just a reflection of the dox-induced transgenes. Alignment of the RNA-seq data to the NAIP2 transgene cassette (TetO-NEUROG2-p2A-ATOH7-p2A-ISL1-p2A-POU4F2) or to mRNA untranslated region sequences (UTRs) not part of the transgene, showed that both exogenous and endogenous transcripts were increased (Supplementary Fig. 3g–m). For reasons that are unclear, POU4F2 was highly expressed at 1 week, gradually decreased at days 14 and 21, then began to rebound by day 28 (Fig. 5g). Other RGC markers (e.g., POU4F1, SNCG, NEFL, and INA) were expressed throughout differentiation. RNA-seq alignments between UTRs and temporal RNA-seq samples confirmed that endogenous ISL1 and POU4F2 transgenes were expressed even after dox withdrawal (Supplementary Fig. 3k–m). The SoxC subfamily TFs, including SOX4, −11, and −12, which are important for axon guidance and RGC specification, were also abundant17(Supplementary Fig. 7). Together, these data indicated that RGC transcriptional networks were regulated by NAIP2 overexpression.
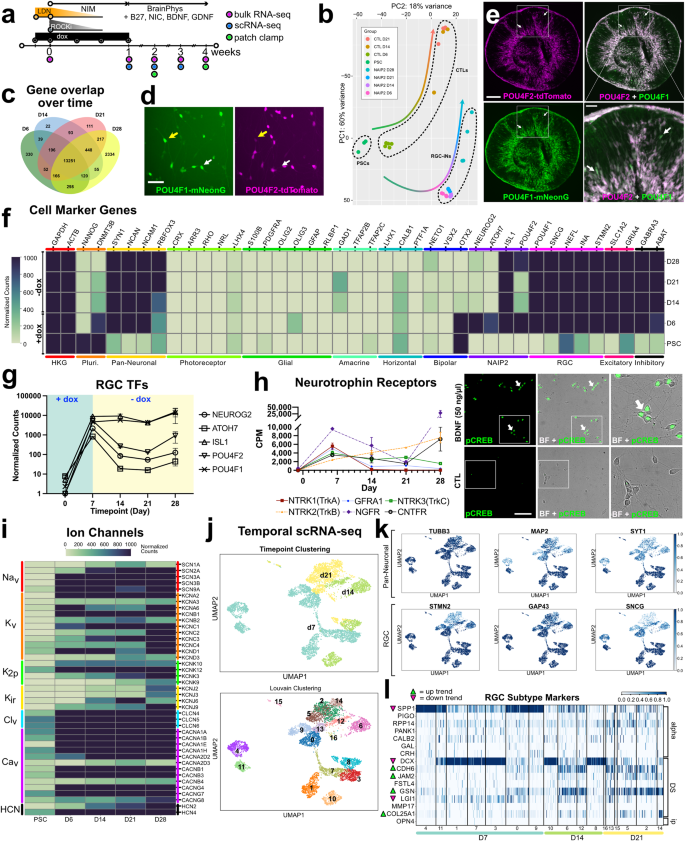
a Timeline for longitudinal studies. b RNA-seq PCA plot showing clustering among PSCs, days 6, 14, 21, and 28 (D6, -14, -21, -28) RGC-iN cultures and days 6, 14, and 21 (D6, -14, -21) CTLs. c Venn Diagram showing overlapping genes at each time point (normalized count > 10). d POU4F1-mNeonGreen/POU4F2-tdTomato dual reporters in RGC-iNs at day 6. e Cryosectioned day 45 organoids exhibiting POU4F2-tdTomato + /POU4F1-mNeonGreen+ reporter expression. f Heatmap indicating the expression of selected markers for housekeeping (HKG), pluripotency, NAIP2 cassette, photoreceptor (PRs), glial, RGC, inhibitory, excitatory, and pan-neuronal genes. g Line graph showing the RGC transcription factors (TFs) NEUROG2, ATOH7, ISL1, POU4F1, and POU4F2 expression at each time point. h Line graph for selected neurotrophin receptors and immunostaining of day 6 RGC-iNs with pCREB after 30 min BDNF treatment. i Heatmap highlighting ion channel genes expressed at each time point. j UMAPs of RGC-iNs colored by time point (top) and Louvain clusters (bottom). k UMAPs of RGC-iNs colored by pan-neuronal marker gene expression (top) and RGC-specific marker genes (bottom). l Heatmap showing normalized expression of various RGC-subtype marker genes in each cluster of RGC-iNs across day 7, 14, and 21 time points. *P < 0.05, **P < 0.01, ***P < 0.001, ****P < 0.0001, ns P > 0.05, n = 3 for PSCs, n = 4 for all other samples. Error bars g, h = SEM. Scale d = 50 µm, e = 200 µm, e, inset = 50 µm, h = 85 µm.
To rule out the possibility that RGC-iNs included other cell types, we analyzed other cell-type markers by bulk RNA-seq (Fig. 5f). As expected, RGC markers (e.g., POU4F1, POU4F2, SNCG, NEFL, INA, and ISL1) and pan-neuronal markers (e.g., SYN1, NCAN, NCAM1, and RBFOX3 (NeuN)) were well represented between 1 and 4 weeks but glial (e.g., S100B, PDGFRA, OLIG2, GFAP, RLBP1), photoreceptor (e.g., RHO, CRX, ARR3, LHX4), amacrine (e.g., GAD1, TFAP2B, TFAP2C), horizontal (e.g., LHX1, CALB1, PTF1A), bipolar cell (e.g., NETO1, VSX2, OTX2) and PSC markers (e.g., NANOG, DNMT3B) were not. Together, this demonstrates that RGC-iNs resemble RGCs and not other retinal cell types.
Neurotrophins, which play a vital role in neuroprotection and neural function32,33 also showed dynamic expression. The BDNF receptor NTRK2 (TrkB), which is important for RGC survival, increased over time while NTRK1 (TrkA) and GFRA1 each initially increased then decreased (Fig. 5h). To evaluate functional responses to BDNF, we treated RGC-iNs with BDNF (50 ng/ml) and performed immunocytochemistry for phospho-CREB (Fig. 5h). Compared with untreated controls that showed little to no phosphorylation, a 30-min BDNF treatment showed significant CREB phosphorylation, thus verifying that RGC-iNs were responsive to BDNF. Given the apparent expression of other neurotrophin receptors at earlier stages, it is possible that the addition of their corresponding growth factors (NGF, NT3, CNTF, etc.) could increase survival and alter the proportion of existing cells.
RGCs consolidate visual processing and serve as the main conduit of information from the eye to the brain, and discharge patterns of RGCs, which convey visual information, are determined by a complex repertoire of ion channels. In RGC-iNs we detected voltage-gated sodium (SCN2A/Nav1.2a, SCN3A/Nav1.3a, SCN3B/Nav1.3b, SCN9A/Nav1.7) and potassium channels (KCNA2/Kv1.2, KCNA3/Kv1.3, KCNA6/Kv1.6, KCNC4/Kv3.4, KCND1/Kv4.1, KCND4/Kv4.3), which are key modulators of excitability and regulate action potential duration/amplitude (Fig. 5i). We also observed elevated levels of inwardly rectifying potassium channels (KCNJ3/Kir3.1, KCNJ6/Kir3.2, KCNJ9/Kir3.3), which alter RGC firing patterns, and high levels of voltage-gated calcium channels (CACNA1A/Cav2.1, CACNA1B/Cav2.2, CACNA1E/Cav2.3) that regulate synaptic output and plasticity; both are indicative of maturating neurons. The relationship between these channels and electrophysiological responses in the retina has been well documented, however, their expression alone does not confirm that these are RGCs since they are also widely expressed across CNS neurons34,35.
Neuron function also requires proteins for packaging, docking/release and reuptake of neurotransmitters. Elevated SNAP25, SYP, SYT1, and VAMP2 expression confirmed that such machinery existed (Supplementary Fig. 8a). While RGCs respond to inhibitory input, their main output is excitatory. We verified the presence of the excitatory glutamate synthetic enzyme glutaminase (GLS), which was detected at high levels (Supplementary Fig. 8b–g). GABA signaling, on the other hand, was unlikely since the expression of the GABA transporters SLC6A1, –A11, and –A12, which are needed for GABA packaging into synaptic vesicles, was very low (Supplementary Fig. 8h–j). Moreover, GABA-transaminase (ABAT), which degrades GABA, was highly expressed (Fig. 8Sh–j). Unexpectedly, GAD1, a GABA synthetic enzyme, was detected, however, given the low transporter levels and high ABAT levels, accumulation of GABA inside the cell is unlikely. SHMT2 and PHGDH, which regulate glycine synthesis and degradation, respectively, were also expressed at all stages (Supplementary Fig. 8k, l), however, SHMT2 does not necessarily indicate synaptic activity since glycine is also widely used for protein synthesis. The SLC32A1 (VIAAT/VGAT) transporter, which loads GABA and glycine into synaptic vesicles, is a main vesicular phenotype determinant for glycine and this was not detected. Thus, these cells are not likely to be glycinergic. RGCs also respond to a variety of synaptic inputs including glutamate, GABA, and glycine. AMPA (GRIA2, -3, -4), Kainate (GRIK3), Metabotropic (GRM3, -8), and NMDA (GRIN1, -2A, -2B, -2C, and -3A) type glutamate receptors (Supplementary Fig. 8b–f) were all detected in addition to the inhibitory ionotropic (e.g., GABRA3, GABRB3) and metabotropic (e.g., GABBR2) GABA receptors (Supplementary Fig. 8h, i) and GLRA2/3 and GLRB glycine receptors (Supplementary Fig. 8k). Together these data suggested that RGN-iNs were excitatory in nature and expressed receptors for excitatory and inhibitory synaptic inputs.
Single-cell analysis reveals subtype diversity
Electrical responses and dendritic arborization are two criteria for classifying RGCs, however, molecular signatures from single-cell RNA-seq (scRNA-seq) have also contributed to our understanding of cell diversity36,37. To explore RGC subtypes, we performed scRNA-seq at days 7, 14, and 21 using particle-templated instant partition sequencing (PIP-seq)38. For day 7 (n = 3) we obtained 3440 cells (27,485 median transcripts/cell), for day 14 (n = 2) we obtained 1665 cells (39,208 median transcripts/cell) and for day 21 (n = 3) we obtained 2380 cells (31,880 median transcripts/cell). Cells from each time points were clustered using the Louvain algorithm and projected by uniform manifold approximation and projection (UMAP) onto 2D space to visualize cell clusters and marker gene expression. Sustained pan-neuronal (e.g., TUBB3/MAP2/SYT1) and RGC-enriched (e.g., STMN2/GAP43/SNCG) gene expression was detected (Fig. 5j, k). Cell-type marker analysis excluded other retinal cell types, including photoreceptor, glial, amacrine, bipolar and horizontal cells (Supplementary Fig. 9a). Surprisingly, markers for mature bipolar (OTX2) and horizontal (LHX1) cells, were detected at day 7 but were downregulated thereafter. Additionally, we compared 2-week-old RGC-iNs to publicly available human scRNA-seq datasets39,40,41, including 45-day-old organoid RGCs, 59-day-old fetal RGCs and 40-day-old iPSC-RGCs and found that RGC-iNs integrated well with each of these datasets (Supplementary Fig. 9b).
Analysis of subtype markers illustrated that RGC-iNs expressed both alpha- (e.g., SPP1, PIGO, RPP14) and directionally sensitive (DS) (e.g., DCX, CDH6, JAM2, GSN) RGC markers (Fig. 5l). Some of these (e.g., JAM2, GSN) showed an upward trend across time which might suggest an increase in DS-like cells. Since many alpha and DS markers were co-expressed in the same clusters, we explored whether adult human retinas from published scRNA-seq datasets also exhibited mixed expression42,43. While cells showed clear separation through Louvain clustering in adult retinas, many alpha and DS markers were again shared across clusters (Supplementary Fig. 10a, a1). Similar results were obtained with day 21 RGC-iNs, which are more mature than earlier time points (Supplementary Fig. 10b, b1) suggesting that the alpha- and DS- RGCs classifications in humans may be difficult to resolve with existing data. To explore whether classifications based on morphology might work better, we extracted the top 2000 highly variable genes (HVGs) at day 21 and used a machine learning-based predictive label transfer model to infer subtypes from a previously annotated human retina scRNA-seq dataset43. Compared with the adult human retina that had 90% M-type, 5% P-type, 1% ipRGCs and 4% other RGCs with discrete groupings (Supplementary Fig. 10c), RGC-iNs showed ~40% midget (M-type), 13% parasol (P-type), 7% ipRGC and 40% other RGC subtypes with less discrete groupings (Supplementary Fig. 10c1, c2). Since RGC-iNs did not express OPN4, the label transfer approach attempted to label ipRGCs based on more subtle gene expression trends and likely overestimates the number of actual ipRGCs.
A final level of analysis was conducted to explore whether RGCs could be categorized as susceptible or resilient to injury; this classification is based on gene expression profiles in mouse RGCs that survive mechanical injury44. RGC-iN clusters showed heterogeneous expression of susceptible and resilient markers at day 21 and consistent expression of survival-promoting neurotrophic factor receptors (GDFRA1, NTRK2, NTRK3, and CNTFR) in almost all clusters (Supplementary Fig. 10d). Interestingly, many markers ascribed to susceptible or resilient RGCs were often expressed in the same cell clusters which might suggest that these classifications might not be so binary in developing human RGC-iNs. Given that BDNF and GDNF are added as a supplement to neuronal culture medium their presence could reflect preferential survival of those cell subtypes. Intriguingly, NTRK1 and NGFR were minimally expressed in cells from each day 21 cluster. In summary, while temporal bulk RNA-seq confirmed the developmental trajectory of RGC-iNs, scRNA-seq reaffirmed this trend while providing additional insight into the heterogeneity of RGC-iN subtypes.
Induced RGC neurons are physiologically active
At two weeks, both TAU and MAP2 showed overlapping expression near the soma of the cell, however, TAU also labeled long projections resembling axons which could indicate that the cells are not yet mature (Fig. 6a, b). We also assessed their electrophysiological function by recording from individual neurons (Fig. 6c). Electrophysiological properties in 2- and 4-week-old RGC-iNs were evaluated using current clamp and whole-cell voltage clamp recordings. Current clamp (Fig. 6d) showed that RGC-iNs were capable of firing action potentials while developing the capacity for repetitive action potential firing over time. Voltage-clamp recordings revealed sodium and potassium currents that were characteristic of RGCs and increased with maturation between 14 and 28 days (Fig. 6e). To examine if RGC-iNs expressed functional glutamate receptors we transiently applied puffs of the agonist AMPA (Fig. 6f) and observed large inward currents with a linear I-V trace reversing around 0 mV in response to AMPA puffs, consistent with the activation of functional GluA2 receptors. Intriguingly, in some RGC-iNs, we observed putative spontaneous excitatory post-synaptic currents (sEPSCs), indicating that the RGC-iNs could form synapses, release neurotransmitters and express functional excitatory neurotransmitter receptors at synaptic contacts. These sEPSCs showed fast kinetics that were blocked by the AMPA/Kainate antagonist DNQX, consistent with AMPA-mediated synaptic events (Fig. 6g).
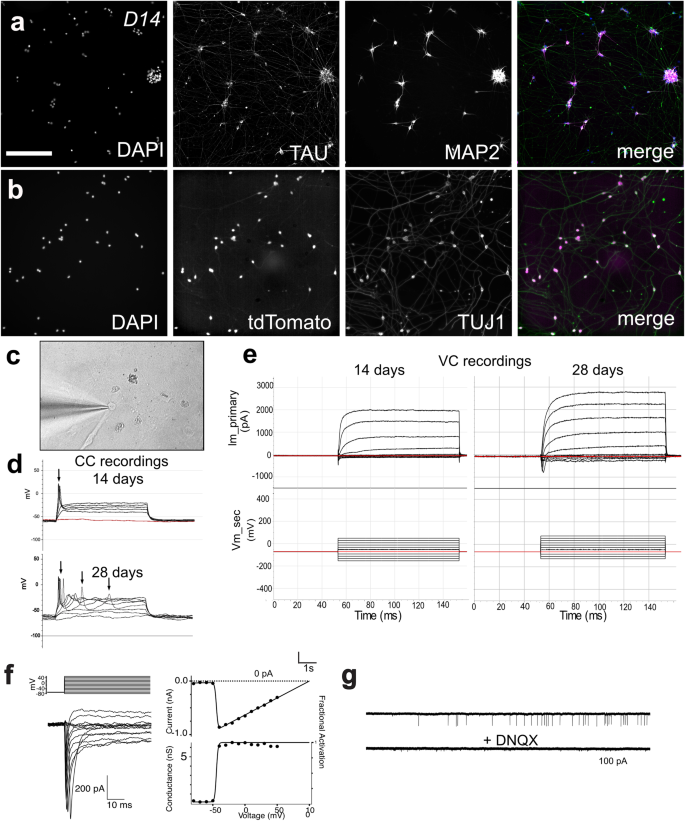
Day 14 (D14) RGC-iNs stained with a DAPI, TAU, and MAP2. b DAPI and TUJ1 overlayed with tdTomato. c Patched D14 RGC-iN. d Electrophysiological recordings from RGC-iNs under current clamp showing single action potentials elicited in response to depolarizing current injection as early as 14 days. By day 28, RGC-iNs are shown to exhibit repetitive action potentials. Resting membrane potential = −60 mV. Threshold current = 60 pA. e Under voltage clamp, depolarizing voltage steps in RGC-iNs reveal both fast inward Na+ and outward K+ currents, which are increased at day 28 compared to day 14. f, left: An example AMPA puff (1 mM) evoked current in a voltage-clamped RGC-iN. f, right: I–V plot for AMPA puff evoked currents in RGC-iN (solid symbols), and linear fit (solid line). Traces on the left show time course and double exponential fit to putative sEPSCs. g Example of current traces showing spontaneous excitatory post-synaptic currents (sEPSCs) that were blocked by the AMPA/Kainate antagonist DNQX. Scale a, b = 200 µm.
Cell death after pharmacological axon injury is prevented by blocking the DLK/LZK and GCK-IV pathways
A hallmark of neurodegenerative disease, including glaucoma, is axon injury and cell death. To exploit the rapid generation time of RGC-iNs for studies of cell injury and death we leveraged a pharmacological axon injury model involving colchicine, a microtubule destabilizing agent that induces axonal injury and death45,46,47. DLK (MAP3K12) and the related LZK (MAP3K13) signaling pathways are key mediators of RGC injury (Fig. 7a) in addition to mediating responses in other CNS/PNS neurons48,49 and their inhibition provides significant protection from RGC death in vitro, induced by colchicine, and in vivo, induced by optic nerve crush50,51,52. To show that RGC-iNs were also susceptible to injury we treated RGC-iNs with colchicine (Fig. 7b). The addition of colchicine led to a dose-dependent increase in cell death, with a complete loss of neurons at 40 nM, measured by the ATP-based CellTiter Glo (CTG) cell survival assay (Fig. 7c, d). Inhibition of DLK/LZK signaling by GNE-3511, a potent DLK/LZK inhibitor, prevented RGC-iN cell loss at all colchicine doses and preserved neuronal morphology as evident by long POU4F2-tdTomato+ neurites.
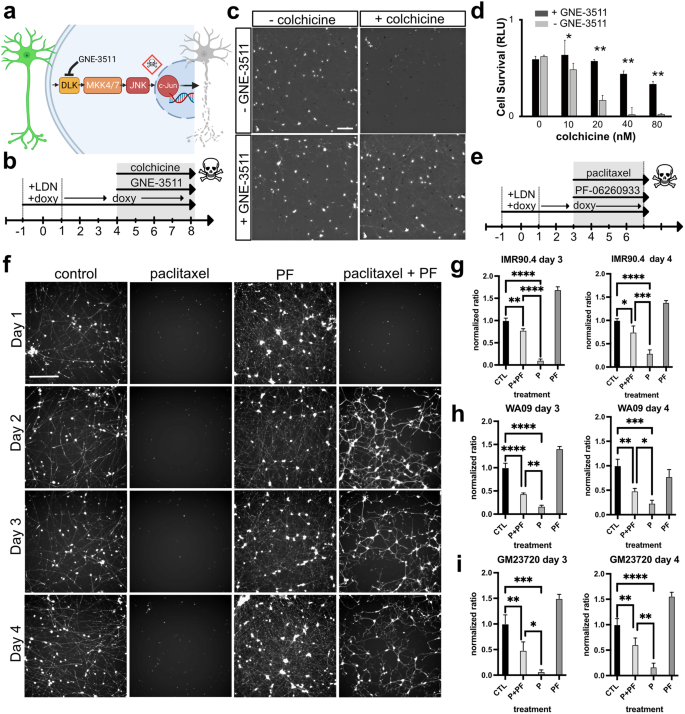
a Diagram illustrating a model for blocking DLK-induced cell death. b Timeline for RGC-iN differentiation, colchicine-induced injury and neuroprotection with GNE-3511. c RGC-iNs treated with or without GNE-3511 (1 μM), 72 h after treatment with or without colchicine (40 nM). d Quantification of the CellTiterGlo (CTG) viability assay in the presence or absence of GNE-3511 in combination with increasing doses of colchicine (n = 4). e Timeline for RGC-iN differentiation, injury from paclitaxel(P), and neuroprotection with PF-06260933(PF). f Representative Calcein-AM images after treatment at D1, 2, 3, and 4 with control, paclitaxel, PF-06260933 and paclitaxel + PF-06260933. Quantification of viability using CTG in NAIP2 cells in g IMR90.4, h WA09, and i GM23720 RGC-iNs normalized relative to controls after treatment with P, PF or P + PF (n = 3). Scale c = 200 µm, f = 400 µm. *P < 0.05, **P < 0.01, ***P < 0.001, ****P < 0.0001. Error bars are reported as standard deviation (SD).
The GCK-IV kinase family (MAP4K4, MINK, TNIK) also plays an important role in cell death after axonal injury and its inhibition improves survival and neurite outgrowth of mouse and human RGCs in vitro50. Furthermore, in the presence of axon injury agents, such as paclitaxel (P), a microtubule stabilizing agent, GCK-IV inhibition effectively prevents axon degeneration in vitro. To extend these findings to human RGC-iNs we injured 3–4-day-old cells with paclitaxel (1 μM) along with PF-06260933 (PF) to inhibit GCK-IV. These were imaged by fluorescence microscopy and quantified by the CTG viability assay after 72 h (Fig. 7e). Massive cell death induced by paclitaxel was observed at days 1, 2, 3, or 4 by microscopy (Fig. 7f). When co-treated with PF-06260933 at the same time points, neurons were significantly protected, except for day 1 which still showed massive cell death. To quantify cell viability, we used the CTG viability assay in three PSC-derived RGC-iNs from three different genetic backgrounds (IMR90.4, WA09, and GM23720). Comparisons between P and P + PF in each background showed that PF was highly neuroprotective (Fig. 7g–i). Furthermore, as previous studies have shown, inhibition of GCK-IV induced robust neurite outgrowth in the absence of injury. This was also observed in RGC-iNs (not shown). Together, these data demonstrated that RGC-iNs are susceptible to multiple forms of axonal injury, engage in established injury signaling pathways and can be protected by blocking those pathways just like actual RGCs, thus establishing this as a rapid and robust model system for studying neurodegenerative signaling.
- SEO Powered Content & PR Distribution. Get Amplified Today.
- PlatoData.Network Vertical Generative Ai. Empower Yourself. Access Here.
- PlatoAiStream. Web3 Intelligence. Knowledge Amplified. Access Here.
- PlatoESG. Carbon, CleanTech, Energy, Environment, Solar, Waste Management. Access Here.
- PlatoHealth. Biotech and Clinical Trials Intelligence. Access Here.
- Source: https://www.nature.com/articles/s41536-023-00327-x