Morphological profiling and whole-genome sequencing on iPSCs from 297 unique donors
To study associations between genetic variants and morphological traits, we assembled a cohort of iPSC lines from 297 unique donors for which we generated image-based profiling and whole-genome sequencing data (Fig. 1). We obtained pre-derived cell lines from the CIRM iPSC repository5. Age, sex, medical history, ethnicity, and relatedness to other samples were recorded using questionnaires at time of enrolment and sample collection. Each iPSC line was subjected to a pluripotency test as well as genotyping to identify any abnormal karyotypes. Upon receipt, we expanded and cryo-banked each iPSC line, and performed genotyping (using the Global Screening Array (GSA)) and 30X whole-genome sequencing (WGS) on all lines. Any cell lines displaying abnormal karyotypes or genomic rearrangements >1 Mb were excluded from our study. The final cohort used in this work included 297 distinct donors of which 153 were male and 144 were female, with an average age of 21 ± 10 (sd) years. Of the 297 donors, 207 had self-reported ancestry of European and 90 individuals reported non-European (Table 1). IPSC lines were generated from B-cells or fibroblasts using a non-integrating episomal vector system previously described5 (Table 1). All donors included in this study have been properly consented for iPSC derivation, the experiments performed in this work, and genomic data sharing. We performed a principal component analysis (PCA) to observe the genetic diversity of cells utilized in our collection (Fig. S1A). A summary breakdown of our cohort is included in Table 1 and individual cell line level metadata is included Table S1.
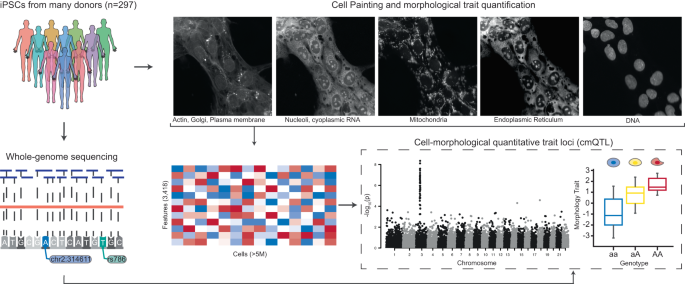
iPSC lines from 297 donors were expanded, quality-control checked and then subject to both high-throughput imaging with Cell Painting and 30X whole-genome sequencing (WGS). Overall, we imaged 5.1 × 10⁶ cells across all donors and quantified 3418 morphological traits per cell using CellProfiler software. We inferred genetic variants from the WGS data and investigated whether individual morphological traits associated with both rare and common variation.
To quantify cellular traits, we adopted the Cell Painting assay17,18. This multiplexing dye assay uses six stains to capture morphological characteristics for eight cellular compartments: Hoechst 33342 (DNA), wheat germ agglutinin (WGA) (golgi and plasma membrane), concanavalin A (endoplasmic reticulum), MitoTracker (mitochondria), SYTO 14 (nucleoli and cytoplasmic RNA), and phalloidin (actin). Images are processed using the open-source CellProfiler software to extract thousands of features of each cell’s morphology such as shape, intensity, and texture statistics, thus forming a high-dimensional profile for each single cell21.
We generated Cell Painting data from all 297 donors leveraging a systematic workflow to ensure cells were treated in identical fashion across all rounds of imaging. Cell lines were thawed in batches of 48 and passaged 3 days later into a 96-well deep well plate before being transferred into a 384-well screening plate using an automated liquid handling device (Fig. S1B, Methods). Cells were plated at a density of 10k cells/per well and fixed 6 h post-plating, so as to allow for cell attachment while minimizing differences in cell growth rates, which we observed during cell line expansion (Fig. S1C). We determined these conditions through a pilot screen that contained 6 cell lines plated across various densities and fixation timepoints, which showed we could maximize differences between cell lines under these parameters (Fig. S1D). Each screening plate was stained with the standard Cell Painting dyes and imaged on a Perkin Elmer Phenix automated microscope within 48 h. We implemented this same workflow across all rounds of imaging.
Images were processed using CellProfiler to measure morphological traits and construct single-cell image-based profiles (Methods21,). In total, we measured 3418 morphology traits for 5.1 million iPSCs from 297 donors after stringent QC (Methods, Fig. S2A, Table S2). We classified all morphological traits based on the cellular characteristics they represented, yielding five categories: Area and shape, Granularity, Intensity, Radial distribution, and Texture (Fig. 2a). Prior studies have shown that cells often displayed varied morphology in response to environmental cues and context16. To explore whether the contribution of genetic variation to cell morphology is context dependent, we segregated all cells into two groups based on whether they had any cells in contact (called colony cells, 97.48% of all cells) or not (called isolate cells, 2.52% of all cells) (Fig. S2B). We note that for the purposes of our study, “colony” refers to the number of neighbors a given cell has and is distinct from the colony terminology which is often used in basic stem cell culture practices.
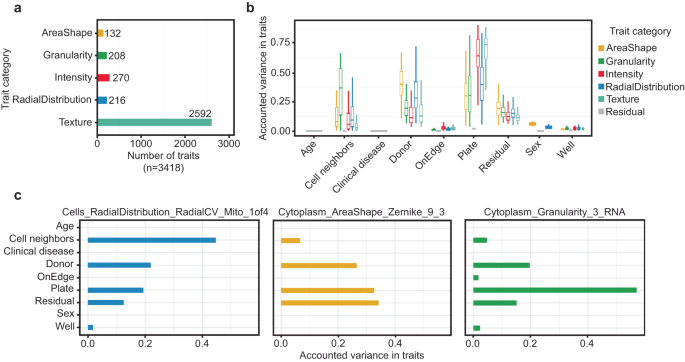
a Summary of five categories of morphological traits captured in our data (n = 3418). b Explained variance across all morphological traits (n = 3418). Data is presented in a Tukey-style boxplot with the median (Q2) and the first and the second quartiles (Q2, Q3) and error bars defined by the last data point within ±1.5-times the interquartile range. c Exploring explained Variation in individual traits, namely distribution of mitochondria around nucleus, cytoplasmic Zernike shape metric 9_3, and cytoplasmic granularity in the RNA channel at scale 3, showed differences in sources of variance, including technical effects such as plate and well of imaging, whether the well was situated on the row or column on the edge of plate (onEdge), biological sources such as donor. Donor ID represents the difference among donors after accounting for their age, sex, disease-status and above-mentioned imaging-related technical factors. Residual is the remaining unaccounted variation in traits.
We next performed 30X whole-genome sequencing (WGS) on all iPSC lines. Following quality control (QC, see Methods), we retained 7,020,633 common (minor allele frequency (MAF) > 5%) and 122,256 rare (MAF < 1%) variants for downstream analyses.
Cell line characteristics and technical factors drive variability in morphological traits
Previous studies have shown that technical factors, including plate and well position can alter morphology-based readouts22. To explore the presence of cmQTLs in our data, we sought to identify technical factors which may confound our morphological phenotypes and remove these sources of variance from our downstream association tests. We performed a variance component analysis using well-level data to quantify the observed variance that can be attributed to each morphological trait by technical factors and cell line characteristics (Methods). We assessed the significance for each variance component, correcting for the number of tests, which was the product of the traits (n = 3418) and factors (n = 9) which include technical features such as imaging plate, well position, the number of cell neighbors, and whether the well was positioned on the edge of the plate (onEdge) in addition to demographic characteristics for the cell lines including genetic sex, reprogramming sample source, age of donor at the time of sample collection, and the clinical diagnosis for our tissue donors. We observed strong batch effects across imaging plates, which contributed the greatest degree of variance to our morphology traits (61.8 ± 17%, Fig. 2b, Fig. S3A). Several other confounders contributed varying levels of effect on different morphological traits (Fig. 2c). After correcting for these covariates, the remaining difference among cell line donors was significantly associated with all traits, explaining 16.7 ± 11% of the variance. (Fig. 2b). This indicated the potential for a genetic basis to the variability in morphology traits. Residual is the remaining (technical) variance in morphological traits which is unexplained by the factors discussed above. Interestingly, the difference among donors explained a greater degree of variance in the trait category of AreaShape relative to the other trait categories (Wilcoxon rank sum test P = 1.1 × 10−55, Fig. S3B). We note that some of the shared variance may be explained by non-genetic factors, such as stable epigenetic modifications. We observed that many traits had very high pairwise correlation (Pearson r > 0.9) with one or more traits (Fig. S3C). To reduce redundancy in our downstream analyses, we selected a common set of 246 traits having r < 0.9 with each other by iteratively selecting a single representative trait for the set of correlated traits (r > 0.9) (Methods). We refer to this common set of 246 traits as “composite traits”, which were used for our rare and common variant association tests (Table S3). We next summarized well-level morphology data into donor-level values (i.e., pseudo-bulk) by mean-averaging individual morphology traits across all wells for a given donor, resulting in one measurement per trait per donor (N = 246 traits and 297 donors) for both isolate and colony cells. These donor-level trait values were used for our quantitative association tests.
Rare variant burden for cell morphological traits
Sequencing studies have identified hundreds of genes containing rare coding variants with association to disease burden23,24,25,26. These variants often have large effect sizes but explain a modest degree of total disease heritability27. To explore the effect of rare genetic variation on cellular morphology, we analyzed the association of composite traits (n = 246) with gene-level burden of protein-altering rare variants (MAF < 0.01). To ensure well-powered investigation, we examined 9105 genes that had rare variants in at least 2% of donors (n >= 6). We modeled individual morphology traits as a function of rare protein-altering variant burden in a gene, controlling for plate, well, and donor sex using linear regression (Methods). We performed our analysis separately for both colony and isolated cells. We identified 4 genome-wide significant associations between morphological traits and rare variant burden (P < 2.2 × 10⁻⁸, Bonferroni correction for 246 traits and 9105 genes) (Fig. 3a). These associations included one trait in colony cells and three traits in isolate cells. We did not observe any inflation in association statistics for these traits (Lambda (λ) = 1.01 for the association in colony cells and λ = 1.01, 0.96, 0.98 for the associations in isolate cells) (Fig. S4A). While the top feature associations (using a stringent Bonferroni correction) are quite different between isolate and colony cells, there is a modest overall correlation between the associations of morphology traits and genetic variants (Fig. S4B).
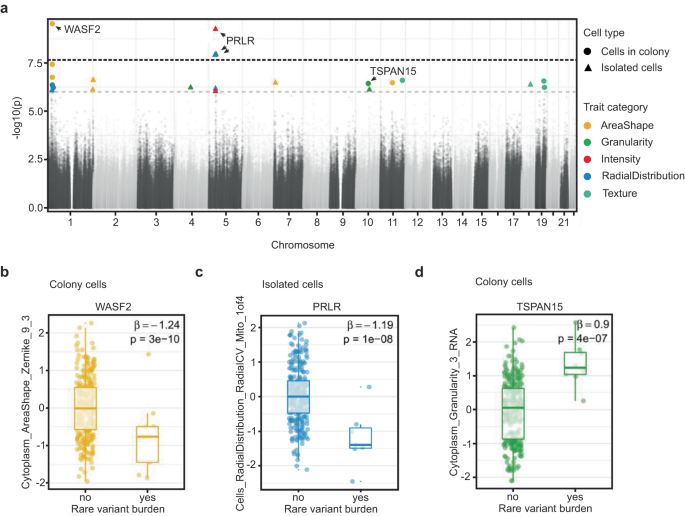
a Manhattan plot showing association between morphological traits (n = 246) and rare variant burden in candidate genes (n = 9105). Black dotted line represents the p-value threshold after Bonferroni correction for the number of tested traits and genes (P = 0.05/246×9105, i.e. 2.2 × 10⁻⁸). Gray dotted line represents the p-value threshold for suggestive evidence of association (P = 10−6). b–d Box plots displaying the association between the Zernike_9_3 cytoplasm shape metric and rare variant burden in WASF2 gene (b), distribution of mitochondria around the nucleus and rare variant burden in PRLR gene (c) and cytoplasmic granularity measure in the RNA channel and rare variant burden in TSPAN15 gene (d). We provide the effect size (β estimate) and raw p-value of the association for each trait. Data is presented in a Tukey-style boxplot with the median (Q2) and the first and the second quartiles (Q2, Q3) and error bars defined by the last data point within ±1.5-times the interquartile range (n = 297 unique cell lines).
Rare variant burden in WASF2 was negatively associated with a Zernike shape measure of the cytoplasm (Cytoplasm_AreaShape_Zernike_9_3) in colony cells (n = 3 missense and 1 in-frame deletion rare variants, β or effect size (se) = −1.24 (0.18), P = 3.1 × 10⁻¹⁰; Fig. 3b). Zernike features represent polynomial reconstructions of an organelle or object of cells. WASF2 is named for its association with Wiskott-Aldrich syndrome, a rare genetic disorder which greatly increases the risk of various cancers (28,29,30, and31). WASF2 protein binds profilin, a G-actin-binding protein, promoting the exchange of ADP/ATP on actin and the formation of actin filament clusters32,33. The disruption of WASF2 impairs actin formation and organization that could lead to their polarized distribution and spindle-shaped cells34. In representative images of cells with rare variants in WASF2 it is difficult to identify this polarized and spindle-like shape by eye when compared to reference lines (Fig. S4C). In addition to our genome-wide association, rare variant burden in WASF2 had nominal association (P < 0.05) with 90 other traits including 27 traits of area and shape category, suggesting WASF2 may contribute to a range of cell morphological characteristics (Table S4).
Three traits were significantly associated with rare variant burden in the PRLR gene (n = 6 missense rare variants, β (se) = −1.17 (0.2), P = 1.2 × 10⁻⁸; Fig. 3c). The most interesting among these included asymmetries in the distribution of mitochondria in the perinuclear space (Cells_RadialDistribution_RadialCV_Mito_1of4). PRLR function has been linked to several forms of cancers, including breast cancer and lymphoma (Kavarthapu et al.35, López Fontana et al.36, Gharbaran et al.37). PRLR encodes membrane-anchored receptors for a prolactin ligand and is a part of the class-I cytokine receptor superfamily and regulator of JAK-STAT5 pathway activity, regulating autocrine/paracrine loops present in stem cells, which mediate their quiescence and proliferation38,39. Previous findings in adipocytes showed PRLR knockout alters mitochondrial packing and distribution throughout the cell40. Moreover, rare variant burden in PRLR had nominal association (P < 0.05) with 118 other traits, providing more support to PRLR as a genetic determinant of cellular morphology (Table S5).
We also inspected the associations with suggestive evidence, i.e., P < 10−6. There were a total of 12 and 13 associations in colony and isolated cells, respectively, which passed this threshold (Table S6). One of the strongest associations in our suggestive results was between the distribution in size of RNA particles in the cytoplasm (Cytoplasm_Granularity_3_RNA) and rare variant burden in TSPAN15 gene (n = 2 missense and 1 splice region rare variants in the gene, β (se) = 0.9 (0.17), P = 3.7 × 10⁻⁷; Fig. 3d). TSPAN15 is expressed in all human tissues and encodes for a cell surface protein41. A member of the tetraspanin family of transmembrane segments, TSPAN15 has been implicated in tumor-related conditions (Huang et al.42). TSPAN15 plays a role in cell activation and self-renewal through negative regulation of Notch-signaling43. Disruption of TSPAN15 could lead to increased cell proliferation and transcriptional activation which may be represented in our data by an increase in the measurable RNA content in the cytoplasm.
To ensure our observed associations were not an artifact of our nonparametric regression model, we permuted the data by randomly assigning trait values across donors. These results suggested that our observed significance of association between rare variant burden and cell morphological traits was unlikely to have occurred by chance (Fig. S4D). To confirm that our observed associations were not driven by somatic variation introduced during iPSC reprogramming or those which arise in cell culture (despite the short culture time in our study), we repeated our association test while restricting to only those variants that were previously observed in the gnomAD database (106,590 of 122,256 variants)44. All of our observed associations were recapitulated (significant after Bonferroni correction for multiple testing and with suggestive evidence) with concordant effect size and statistical significance (p-value) (Fig. S4E). Taken together, our findings suggest we could reliably identify associations between morphological traits and rare protein-coding variants.
Functional validation of rare variant associations
CRISPR-based gene editing has been shown to be a viable mechanism for validating gene expression phenotypes resulting from rare variation45. To corroborate our rare-variant burden associations, we examined whether knockdown of these genes impacted the same morphological traits for which we identified a rare-variant burden association. We transfected iPSCs from a single cell line expressing constitutive dCas9-KRAB CRISPRi machinery with sgRNAs targeting the transcriptional start site (TSS) for WASF2, PRLR, and TSPAN15 (Fig. 4a). Each gene was targeted by 2 different sgRNA sequences, which were validated for knockdown of their target gene (25-95% efficiency) (Fig. S5, Table S7). Cells transfected with non-targeting sgRNAs were included as controls. We generated per-well (population-averaged) morphological profiling using the same methods for our discovery cohort. We compared the morphological trait values for our rare-variant associations between non-targeting sgRNAs and those targeting our genes of interest. For each gene tested, we observed the predicted changes, and in the same direction, for each individual trait relative to controls (n = 28 wells per targeting sgRNA and 52 wells per non-targeting sgRNA, Welch’s two sample T test, P < 2.2 × 10⁻¹⁶) (Fig. 4b–d). Specifically, knockdown of WASF2 resulted in a decreased normalized score for the trait Cytoplasm_AreaShape_Zernicke_9_3 (Fig. 4b). We observed that a reduction in the expression of TSPAN15 coincided with an increase in trait score for Cytoplasm_Granularity_3_RNA (Fig. 4d). Lastly, knockdown of PRLR decreased Cells_RadialDistribution_RadialCV_Mito_1of4, which defines the relationship between the radial distribution of mitochondria around the nucleus (Fig. 4c). This effect is highlighted in representative images, whereby cells transfected with a PRLR targeting sgRNA displayed more uniform distribution of mitochondria around the nucleus when compared to non-targeting sgRNA cells where mitochondria tend to colocalize to one side of the nucleus (Fig. 4e).
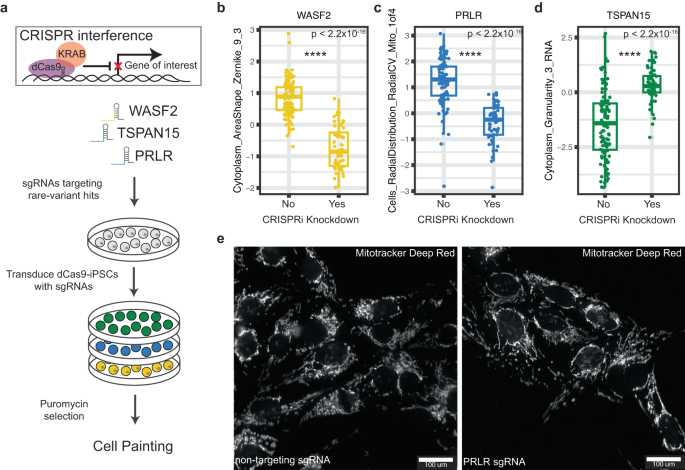
a Workflow for knockdown of rare-variant genes using CRISPR interference in iPSCs expressing constitutive dCas9-KRAB. b–d Box plots displaying quantification of traits between control non-targeting sgRNAs and sgRNAs targeting WASF2, TSPAN15, and PRLR on a per-well level (n = 52 wells per non-targeting sgRNAs, n = 56 wells per targeting sgRNAs, P < 2.2 × 10⁻¹⁶, Welch’s two-sided T test). Effect on the trait score is consistent with what we observed in our rare-variant burden association. Data is presented in a Tukey-style boxplot with the median (Q2) and the first and the second quartiles (Q2, Q3) and error bars defined by the last data point within ±1.5-times the interquartile range. e Representative image of an observable gene-trait association for PRLR. Cells_RadialDistribution_RadialCV_Mito_1of4 relates to the asymmetric distribution of mitochondria in the ring right around the nucleus. In the non-targeting controls (left) we observed clustering of mitochondria on a particular side of the nucleus, whereas in the PRLR knockdown sgRNA (right) we observed a more distributed presence of mitochondria around the nucleus.
Common variant associations for cell morphological traits
Genome-wide association studies (GWAS) have identified thousands of common variants that are associated with common diseases and traits. These variants have small effect sizes at the individual level but combine to explain a large degree of common disease heritability (46,47, O’Connor et al.27). To identify common variants that are implicated in cell morphology, we performed 246 genome-wide association analyses, one for each composite trait. Each association was tested in colony and isolated cells separately (Fig. 5a, Fig. S6C). With our set of 297 donors, only one variant, rs315506, overlapping the chr17q11.2 locus, passed the genome-wide significance threshold (Bonferroni correction for 246 morphology traits, 5 × 10⁻⁸/246 = 2 × 10⁻¹⁰). rs315506 is an intergenic variant and was associated with spatial distribution of endoplasmic reticulum (ER) in the cytoplasm (Cytoplasm_RadialDistribution_RadialCV_ER_3of4) in colonies (MAF = 0.08, β (se) = −0.52 (0.08), P = 1.4 × 10⁻¹⁰, Fig. S6A). This variant also showed suggestive evidence of association (P < 10−5/246 = 4.1 × 10⁻⁸) with spatial distribution of ER near the periphery of cells (Cells_RadialDistribution_MeanFrac_ER_4of4). rs315506 lies in the center of a 400 kb window containing the genes NF1, CORPS, UTP6 and SUZ12. Chromosomal alterations on chr17q11.2 cause NF1 microdeletion syndrome, which has been shown to impair protein localization to the ER48,49. To corroborate this observation, we analyzed the publicly available JUMP-Cell Painting data from U2OS cells that have perturbed NF1 and SUZ12 using CRISPR interference50. In this data, we see a significant change in our associated trait when NF1 and SUZ12 expression is decreased (Fig. 5b). In colony cells, the second strongest association was on chromosome 7 (between Nuclei_Granularity_9_AGP and rs36036340, MAF = 0.08, β (SE) = 0.38 (0.06), P = 6 × 10⁻¹⁰). rs36036340 lies within the gene PRKAR1B. Variants in PRKAR1B have been linked to neurodevelopmental disorders and activity of PRKAR1B has been shown to regulate tumorigenesis51,52,53. PRKAR1B mediates PI3K/AKT/mTOR pathway signaling through direct interactions between PRKAR1B and PI3K-110alpha51. We were unable to link perturbations in PRKAR1B to morphological changes for this feature using publicly available data (Fig. S6B). The most significant association in isolated cells was found on chromosome 13 (between Nuclei_RadialDistribution_RadialCV_Brightfield_2of4 and rs9301897, MAF = 0.13, β (se) = −0.31 (0.05), P = 4.5 × 10⁻¹⁰) (Fig. S6C). rs9301897 lies within the gene GPC6, which is known to play a role in cell growth and division through the activation of cell surface receptors54,55. Over 300 loci reached the suggestive genome-wide significance threshold (P < 4.1 × 10⁻⁸, Table S8) indicating that a larger sample size and improved statistical power would be able to identify additional common variants associated with cell morphology. To confirm our observed associations were not attributable to noise, we permuted the data by shuffling genotype labels and repeating the association tests. These results suggested that our observed significance of association between common variants and cell morphological traits was unlikely to have occurred by chance (Fig. S6). Moreover, several loci (Table S8) showed suggestive association with more than one trait suggesting shared genetic etiology among different morphological traits.
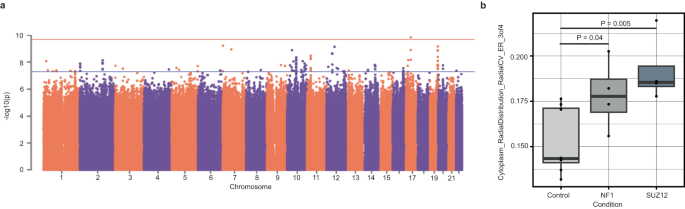
a Manhattan plot for trait association test in colony cells. Red line represents the p-value threshold after Bonferroni correction for the number of tested traits and genes (P < 2 × 10⁻¹⁰) Blue line represents the p-value threshold for hits with suggestive evidence (P < 4.1 × 10⁻⁸). b Impact of knockdown of NF1 and SUZ12 in U2OS cells on Cytoplasm_RadialDistrubtion_RadialCV_ER_3of4 (P = 0.04 NF1, P = 0.005 SUZ12, Welch’s two-sided T test). Data are presented in a Tukey-style boxplot with the median (Q2) and the first and the second quartiles (Q2, Q3) and error bars defined by the last data point within ±1.5-times the interquartile range (n = 8 control biological replicate, 4 biological replicates for each target gene).
Sample size requirements and predictions for future cellular genetic studies
There has been an emergence of cellular genetics studies that aim to uncover the biological function of genetic variation (Wolter et al56,57., Miller58.). When compared to genetics studies of quantitative traits, cellular GWAS are limited in sample sizes, which provide a barrier to the discovery of significant associations. We sought to understand the power of our study with a sample size of nearly 300 individuals, and a distribution of effect sizes spanning common and rare variants. Our findings suggest that genetic discovery for cell morphological phenotypes was achievable at our current sample size. However, the small number of significant discoveries in our analysis begs the question of how many discoveries can be made at larger sample sizes. If the discovery of many hits required a few thousand samples, such experiments would be feasible and worthwhile; if such discovery required hundreds of thousands to millions of samples, it may be out of reach for the foreseeable future. To answer this question, we estimated the distribution of common and rare variant effect sizes using Fourier Mixture Regression noLD (FMR-noLD) (Methods; O’Connor59). Briefly, FMR-noLD fits a flexible mixture model to the distribution of effect sizes. This mixture model can be used to simulate effect sizes at various sample sizes, predicting how many significant discoveries will be made.
For common variants, we analyzed summary statistics from a pruned set of approximately 350,000 variants (Methods). We found that our dataset was underpowered for this analysis: FMR-noLD inferred that essentially all common variant effect sizes are 0, which is implausible and the expected behavior in the low power regime. For rare variants, we analyzed summary statistics from the main burden association analysis described earlier. In contrast to the common variant analysis, we predict that many discoveries will be made at feasible larger sample sizes, with more than 250 significant discoveries at N = 1000 and more than 2000 discoveries at N = 2000 (Fig. 6a, b). Overall, our study was underpowered to detect a significant number of associations between common haplotypes and cell morphological traits, but our rare variant analyses provide a promising path for future studies exploring the impact of rare genetic variation on cell morphology.
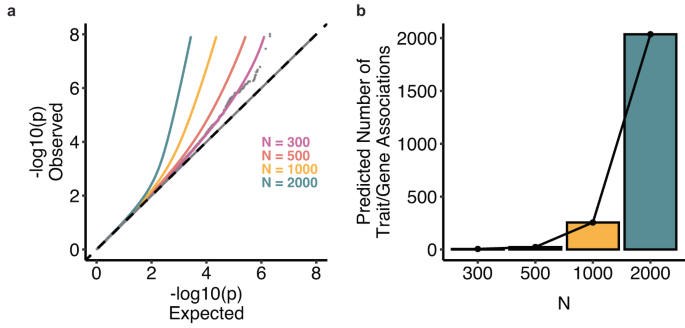
a QQ plot with current observed tests, model fit, and three predicted lines corresponding to N = 500, 1000, 2000. b Barplots showing the number of discoveries per trait at current N, then projected N = 500, 1000, 2000.
- SEO Powered Content & PR Distribution. Get Amplified Today.
- PlatoData.Network Vertical Generative Ai. Empower Yourself. Access Here.
- PlatoAiStream. Web3 Intelligence. Knowledge Amplified. Access Here.
- PlatoESG. Carbon, CleanTech, Energy, Environment, Solar, Waste Management. Access Here.
- PlatoHealth. Biotech and Clinical Trials Intelligence. Access Here.
- Source: https://www.nature.com/articles/s41467-023-44045-w