Metabolites characterization
It is well-known that S-Met assists the biosynthesis of metal NPs by acting as a reducing and/or stabilizing agent38. The qualitative information on phytochemical constituents of obtained S-Met used in the green synthesis of TiO2 NPs is shown in Table 1. The presence of flavonoids, saponins, tannins and phenols characterized the S-Met extracts from the three plants. The absence of essential oils and fatty substances was observed for all analyzed plants; meanwhile, flavones were only found in RS and MO extracts. The slight variations in the constituents found for each plant may be attributed to using different plant parts for the extraction: leaves from RC and MO where used, while flowers and branches from BS were used38. Flavonoids and phenols are considered potential reducers of metallic precursors39. Indeed, Bharathi31 showed that flavonoids and phenols obtained from BS are the principal for forming silver nanoparticles by reducing silver nitrate. On the other hand, Mintiwab and Jeyaramraja reported that flavonoids, tannins, saponins, alkaloids, triterpenes and steroids extracted from RC leaves allow for the reduction and stabilization of silver nanoparticles39. Moodley reported that flavones, terpenoids and polysaccharides obtained from MO leaves are primarily responsible for the reduction and stabilization of silver32 and TiO2 NPs40. It is expected that found constituents (flavonoids, saponins, tannins and phenols) can reduce the titanium precursor salt to titanium ion intermediates for their further conversion into TiO2 NPs.
Nanoparticles characterization
The elemental analysis of TiO2 samples confirmed the presence of titanium and oxygen mostly (Table S1). However, some traces of potassium were found in the samples obtained with S-Met plants extract. The latter may be assigned to the chemical composition of plants, where inorganic matter, such as potassium, indicates that the extracellular inorganic moieties are absorbed in the TiO2 NPs surface40,41. Nevertheless, its contribution was insignificant to interfere with the sample properties, such as the morphology or composition.
Figure S1 presents the typical SEM micrographs of the TiO2 NPs samples prepared from different plant extracts, with comm TiO2 as reference. The green synthesis approach resulted in a quasispherical shape of TiO2 NPs with a size below 100 nm. In comparison, comm TiO2 was characterized with larger aggregates (up to 300 nm) (Fig. S1). According to the micrographs analysis, the diameters of the formed TiO2 NPs were 49, 41 and 55 nm when BS, MO and RC were used, respectively. Despite the slight differences in the qualitative characterization of the S-Met extract (see Table 1), it seems that both the S-Met dispersion and solubility in the reaction media are responsible for the morphology inhomogeneity of the obtained TiO2 NPs, as was discussed for the Ag nanoparticles synthesis from BS and MO extracts31,32. Indeed, some studies related to the green synthesis of TiO2 NPs, using the same Ti precursor (Ti[OCH(CH3)2]4), resulted in the formation of heterogeneous morphology accompanied by the contribution of NPs with different sizes (even up to micrometers)42, unless a tensoactive is used43.
Figure 1 shows the X-ray diffraction patterns for the greenly synthesized samples compared to that for the reference comm TiO2 powder. All samples were characterized with well-distinguishable reflections between 20° and 90° of 2θ. However, the reflections for TiO2 prepared by green synthesis were less intensive and broader than those of the commercial sample. XRD analysis revealed the preferential formation of the TiO2 anatase phase. The most intensive peaks were located at 25° and 48° of 2θ, corresponding to [101] and [200] crystallographic planes of the TiO2 anatase phase, according to the PDF 00-064-0863 card. The low intensity and high broadness of the peaks for nanostructured TiO2 may be attributed to the presence of TiO2 crystals with the nanodomain size, the formation of which was promoted by the active species from the metabolites used, as reported by Logeswari et al., during the green syntheses of silver nanoparticles from organic aqueous extracts of different plants as well as Solanum tricobatum, Syzygium cumini, Centella asiatica and Citrus sinensis44. The crystal formation processes are based on the titania primary species nucleation principles, so their ordered growth in one direction is limited by the components presented in the metabolites. The crystal size of TiO2 was estimated by Scherrer´s equation (see Table 2). The results confirmed that all greenly synthesized TiO2 NPs were composed of relatively small crystals around 20 nm, while the reference TiO2 sample was characterized with a bigger crystal size (41 nm). These results correlate well with the SEM data.

X-ray diffraction patterns of TiO2 samples prepared under a green synthesis from different plant extracts: Ricinus communis (RC), Moringa oleífera (MO) and Bougainvillea spectabilis (BS). A diffractogram from commercial TiO2 (Comm) is presented as a reference. Bragg index corresponds to the PDF 00–064-0863 chart.
Figure 2 presents the adsorption–desorption isotherms for all samples. The isotherms for the greenly synthesized samples were characterized by a Type 4. At the same time, the comm TiO2 obtained isotherm was a Type III, commonly assigned to mesoporous and nonporous materials, according to the IUPAC classification. In addition, the hysteresis loop shape (H1) revealed the presence of cylindrical-like pore channels31. Therefore, thermal physisorption of N2 for prepared TiO2 NPs presented significant differences in the amount of gas adsorbed in comparison with the reference commercial sample (see Fig. 2). The latter coincided well with the remarkable improvement of the specific surface area values for green synthesized TiO2 NPs (see Table 2). The TiO2 NPs prepared by green synthesis were characterized with similar values of surface area (~ 120 m2/g) and pore volume (~ 0.21 m3/g); meanwhile, for the comm TiO2 sample, these values were lower (7 m2/g and 0.007 m3/g, respectively). Furthermore, applying the BJH model for the physisorption data displayed an average porous size of around 5.5 nm for all synthesized samples (Table 2). Note that the TiO2 samples prepared using RC and MO demonstrated two types of pores (4.2 and 6.3 nm, respectively). Thus, the applied green synthesis allowed the formation of relatively small TiO2 nanocrystals to form TiO2 NPs in the anatase phase with a remarkable enhancement of the surface area. Furthermore, the mesoporous nature of the greenly synthesized TiO2 NPs was revealed. Therefore, it may conclude that the green synthesis affects the textural properties of the prepared TiO2 NPs, which makes them functional for the proposed photocatalytic reaction because no mass transport limitations are expectable.
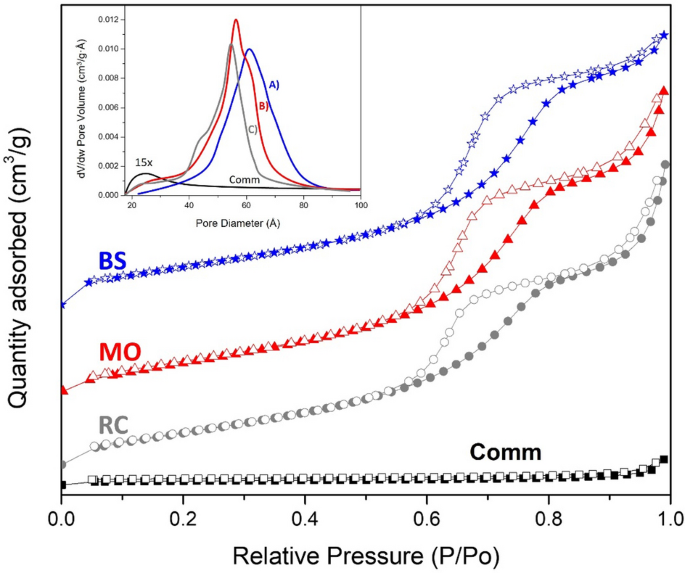
Isotherms of N2 adsorption for the greenly synthesized TiO2 samples using plant extracts of (A) RC, (B) MO and (C) BS and TiO2 (Comm) as a reference sample. The solid symbols indicate adsorption, while the open ones represent the desorption step. The inset presents the corresponding pore size distribution.
The high-resolution XP spectra of comm TiO2 (D) and prepared samples BC (A), MO(B) and RC (C)for the Ti2p region are presented in Fig. 3. For the TiO2 sample, the Ti2p spectrum is characterized by two spin–orbit components, Ti2p3/2 and Ti2p1/2, that are separated by 5.7 eV45, this signals exhibited several doublets attributed to different Ti oxidation states such as Ti3+ or Ti4+46. For all samples, the obtained Ti2p core level spectra presented two symmetric bands centered at binding energies of c.a. 458.5 and 464 eV assigned to Ti2p3/2 and Ti2p1/2, respectively, for the Ti4+ chemical state. Similar results are cited in the literature for TiO2 prepared via green methods46,47,48. Furthermore, a Ti3+ oxidation state is reported when surface defects are formed46 or dopants are incorporated into the TiO2 green synthesis procedure. In contrast, the Ti4+ oxidation state is found when only plant extracts are used49,50. Thus, it was confirmed that the maximum oxidation state of Ti for the greenly synthesized TiO2 NPs was reached. However, the plant extract did not affect the Ti chemical state achieved under green synthesis.
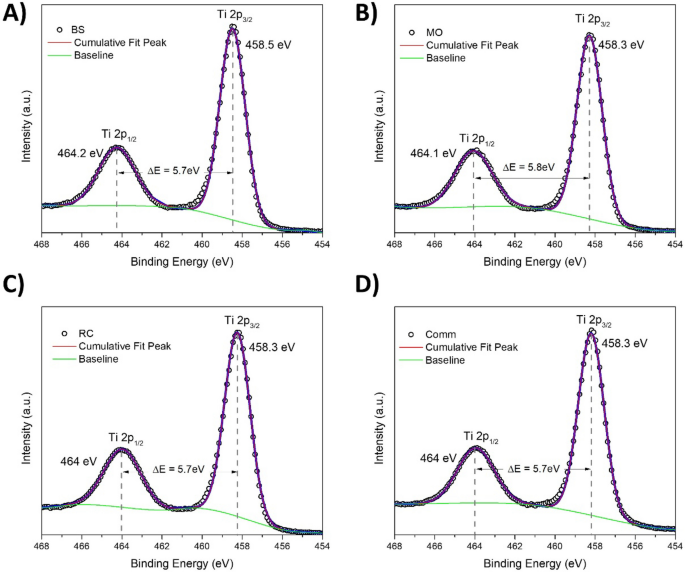
Ti2p XP spectra for the TiO2 samples prepared with the plant extract BS (A), MO (B) and RC (D) and the reference comm TiO2 (D). The circles represent the experimental data; the blue curves represent the Gaussian fits of the experimental data.
The UV–Vis absorption spectra of the synthesized samples were similar to those of the comm TiO2 (see Fig. 4A), characterized by an absorption edge in the near UV region due to the charge transfer between Ti and O. It is well-known that the band gap energy values are associated with the photocatalytic performance of titanium. The band gap energy for these materials was estimated from the UV–Vis absorption edge wavelength of the interband transition according to the Tauc plot method described in Ref.51 (see Fig. 4B). The band gap energy value for comm TiO2 was 3.29 eV, which is in good agreement with the literature data for the TiO2 oxide in the anatase phase (~ 3.30 eV)52. Meanwhile, the values obtained for the greenly synthesized TiO2 samples were 3.20, 3.22 and 3.25 eV, which were samples obtained from BS, MO and RC, respectively (see Table 2). These results agree with those reported for TiO2 NPs prepared via a green approach13. The decreased optical band gap for greenly synthesized TiO2 NPs makes it possible to propose that e- and h + pairs can be generated, promoting photocatalysis. Usually, synthesized TiO2 NPs are characterized by a decrease in band gap energy value because the structure formation is hardly influenced by the ordered aggregation of fine crystals, as was previously discussed. Instead, these fine crystals promoted the presence of surface defects that decreased the band gap energy value51. Therefore, the estimated band gap energy values were influenced by forming domains with several sizes promoted by the phytochemical components presented in the extract plant. The latter was previously confirmed by the crystal size calculations (see Table 2).
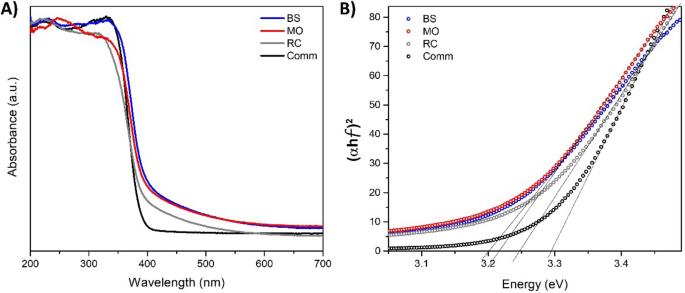
(A) UV–Vis absorption spectra of TiO2 samples prepared via green synthesis using extracts of BS, MO and RC. The UV–Vis spectrum of commercial TiO2 (Comm) is presented as a reference. (B) Estimation of band gap energies based on the Tauc plot method.
Photocatalytic evaluation
Nejayote characterization
The composition analysis of nejayote revealed 32.5% of pentoses (ribose, arabinose, and xylose) and 47% of hexoses (glucose). Another 20.5% was attributed to other compounds such as lignin, inorganic matter (Ca, mainly), proteins, etc.
Table 3 shows the determination of elements in the solid sample of nejayote and ash (product of heat treatment of the nejayote solid sample). The results showed a high contribution of calcium and oxygen that´s characteristic of ¨calcium oxide¨, which is used for the ¨nixtamalization¨ process and the generation of nejayote (wastewater). In addition, it was observed that there was no carbon in the ash sample, which proves the absence of organic matter (polysaccharides and/or sugars).
Furfural production
Figure 5 displays the furfural yields obtained from the nejayote photohydrolysis using the greenly synthesized TiO2 NPs and comm TiO2 as catalysts. All samples displayed some degree of furfural production during the 90 min of reaction monitoring. Figure S2 shows the proposed reaction pathway that lead to furfural production. The first step is the polysaccharide decomposition to form the xylose (pentose) that reacts further to form furfural; the newly formed furfural can react even further going through resinification, condensation or degradation. This furfural reactions lead to furfural loss53 that competes with the furfural production, causing instability that could explain the variations observed. Furfural concentration can be affected by:
- 1)
The rate of polysaccharide decomposition to form xylose.
- 2)
The rate of dehydration reaction of xylose to form furfural.
- 3)
Furfural decomposition to form organic acids54.
- 4)
The rate at which the furfural reacts with other molecules in the molecules in the reaction mixture; condensation reaction rate.
- 5)
The rate at which the furfural reacts with other furfural molecules; resinification rate.
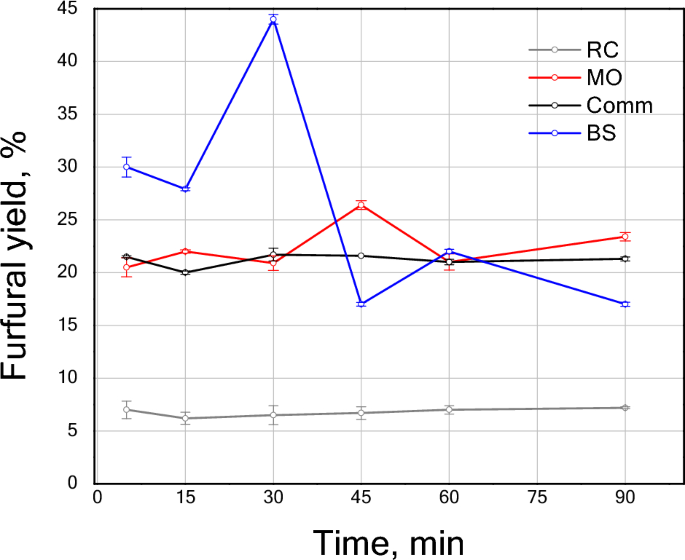
Furfural yield versus time from nejayote conversion using TiO2 comm and TiO2 sample prepared via green synthesis using extracts of BS, MO and RC at room temperature.
All reactions represented in Fig. S2 are affected by the reaction conditions and the photocatalytic properties of the catalyst.
Within the first 30 min the materials catalytic activity can be ordered as BS > MO≈comm TiO2 > RC. TiO2 NPs obtained using S-Met from BS displayed a 44% furfural yield. Since the feedstock employed was nejayote, instead of high-purity xylose, this result was unprecedented. Indeed, the furfural yield reached by the BS sample was 0.6 and 0.5 times that of the yield presented by Alonso et al.9 and Gallo et al.55, respectively, when xylose was used. Additionally, the reaction conditions in the present work were environmentally beneficial because (1) no extra water or energy to raise the temperature of the reactor was required9,55; and (2) no additional solvents such as GVL, toluene, THF, etc.9,55,56 were used.
The furfural production was very low for the RC sample, with a yield below 6% during the reaction. On the contrary, the MO and comm TiO2 samples demonstrated similar behavior for the furfural production with relatively constant product formation for MO the maximum yield (~ 25%) was detected at 45 min. From the data obtained, it can be inferred that the MO and comm TiO2 have a slower xylose hydration stage than that of the BS sample. As the BS sample reached the highest furfural concentration in a very early stage, this accelerated the undesired furfural reactions and prompted the depletion of xylose towards the end of the reaction time here studied54.
The low output of the furfural for the RC sample may be attributed to differences in the polysaccharides rupture (glycosidic bond) pathways56,57, which can produce a different ratio of xylose, arabinose, and ribose56. The latter may impact the product distribution in their subsequent hydrolysis. Furfural production is favored at high ratios of xylose, which has been described as a molecule with an isomerization process that leads to faster furfural production through xylulose and lyxose58. Additionally, nejayote contains relatively big molecules, such as polymers and proteins, that can affect the depolymerization and dehydration processes involved in furfural synthesis. From this perspective, the pore size and morphology of greenly synthesized TiO2 NPs may affect the diffusion of the molecules due to the nature of the feedstock.
Note that the performance of the MO sample is comparable with that presented for the comm TiO2. The comm TiO2, characterized by low surface area, mainly contributes to the external surface area. The latter may explain the lack of diffusional limitations of byproducts or impurities. In contrast, all greenly synthetized TiO2 NPs displayed a smaller particle size and higher surface area promoting the diffusion of the reactive species. However, the MO samples present the largest crystal size compared to the green synthesized BS and RC. The big crystal size accompanied by the small particle size could promote the formation of external active sites, favoring the photocatalytic activity of the material particles’ external surfaces, leading to a similar behavior to that of the comm TiO2.
It was determined that the recovered catalyst for the recycling test absorbed organic and inorganic components from the nejayote. These components were identified by EDS and XRD after calcination; EDS revealed that Ca has deposited in the recovered material, ~ 5% Ca after reaction (Table S2). The XRD of the calcined sample also showed some carbon structure peaks that were not present in the fresh catalyst. The UV–Vis analysis of the recycled samples also showed a shift in the bandgap (from 3.2 to 3.06 eV) (Fig. S3). This is strong evidence of catalyst modification that could promote hemicellulose reactions that are detrimental for furfural production. Furfural yield reached 7.8% in 30 min using reused BS, which is 5.6 × the maximum yield obtained by BS in the first reaction (44%).
- SEO Powered Content & PR Distribution. Get Amplified Today.
- PlatoData.Network Vertical Generative Ai. Empower Yourself. Access Here.
- PlatoAiStream. Web3 Intelligence. Knowledge Amplified. Access Here.
- PlatoESG. Automotive / EVs, Carbon, CleanTech, Energy, Environment, Solar, Waste Management. Access Here.
- PlatoHealth. Biotech and Clinical Trials Intelligence. Access Here.
- ChartPrime. Elevate your Trading Game with ChartPrime. Access Here.
- BlockOffsets. Modernizing Environmental Offset Ownership. Access Here.
- Source: https://www.nature.com/articles/s41598-023-41529-z