An overall experimental schedule was illustrated in the following diagram (Fig. 1).
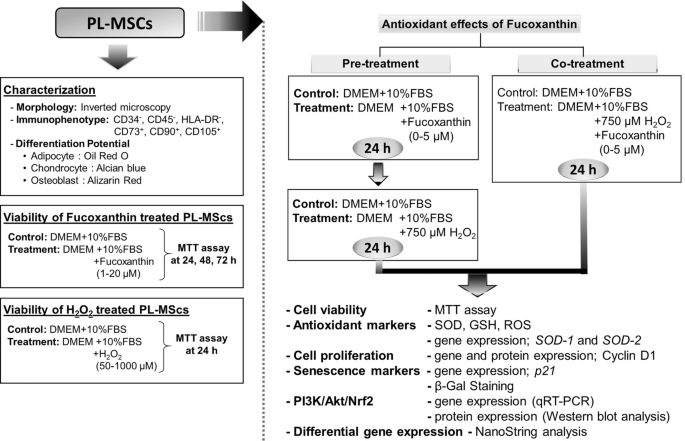
A schematic diagram illustrates the overall experimental schedule.
Cell isolation and culture
The study was approved by the Human Ethics Committee of Thammasat University (Medicine) [Approval number: 024/2021]. After normal deliveries at the Thammasat Chalermprakiat Hospital, placental tissues of five healthy volunteers were collected. The tissues were cut into small pieces and digested at 37 °C for 2 h with 0.5% (w/v) trypsin–EDTA (GibcoBRL, USA). The digested tissues were then cultured with completed DMEM medium [Dulbecco’s modified Eagle’s medium (Gibco-BRL, USA) supplemented with 10% fetal bovine serum (FBS, GibcoBRL, USA), 2 mM Glutamax™, 100 U/ml of penicillin and 100 µg/ml streptomycin (both from GibcoBRL)]. The cell cultures were maintained at 37 °C in a humidified atmosphere with 5% carbon dioxide (CO2). The medium was changed every 3–4 days. At 70–80% confluence, the MSCs were trypsinized and passaged using 0.25% w/v trypsin/EDTA (GibcoBRL, USA).
Characterization of MSCs
The cells from placenta were classified as MSCs using the following criteria: their ability to adhere to the plastic surface, positive and negative cell surface markers, and their propensity to differentiate into many cell types.
Immunophenotypical assay
Trypsinized PL-MSCs were suspended in phosphate buffered saline (PBS). Then, 5 × 10⁵ MSCs in 50 µl of PBS were incubated with fluorescein isothiocyanate (FITC) or phycoerythrin (PE) conjugated antibodies against various human antigens, including HLA-DR-PE (Bio Legend, USA) cluster of differentiation (CD) 34-PE (Bio Legend, USA), CD45-FITC (Bio Legend, USA), CD73-PE (Bio Legend, USA), CD90-PE (BD Biosciences, USA) and CD105-PE (BD Biosciences, USA) for 30 min at 4 °C in the dark. Cells were fixed with 1% paraformaldehyde in PBS after rinsing with PBS. At least 2 × 10⁴ labeled cells were acquired and analyzed from each sample using flow cytometry (DxFLEX flow cytometer, Beckman Coulter, USA) and CytExpert software (DxFLEX flow cytometer, Beckman Coulter, USA).
The differentiation assay
For osteogenic differentiation, PL-MSCs from passages 3 to 5 were seeded at a density of 4.5 × 10³ cells/cm2 and allowed to adhere to 6-well cell culture plates (Corning, USA) overnight. Subsequently, the medium was discarded and replaced with osteogenic differentiation medium [completed DMEM medium supplemented with 100 nM dexamethasone and 50 µM ascorbic acid 2-phosphate (Sigma-Aldrich, USA)]. The addition of 10 mM β-glycerophosphate (Sigma-Aldrich, USA) was performed on day 7 of induction. On day 28 of the culture, cells were stained for 30 min with 40 mM alizarin red S (Sigma-Aldrich, USA). The calcifications in differentiated cells were observed under an inverted microscope (Nikon Eclipse Ts2R, Japan).
For adipogenic differentiation, PL-MSCs were trypsinized and cultured with complete DMEM medium at a density of 4.5 × 10³ cells/cm2 in 6-well plates overnight. The medium was then changed to the adipogenic differentiation medium [completed DMEM medium supplemented with 100 µM indomethacin, 25 mM glucose, 1 µM dexamethasone, and 1 µg/ml insulin (all from Sigma-Aldrich, USA)] for 28 days. Cells were stained for 20 min with 0.5% Oil Red O (Sigma-Aldrich, USA) in 6% isopropanol. The lipid droplets in differentiated cells were visualized under an inverted microscope (Nikon Eclipse Ts2R, Japan).
For chondrogenic differentiation, PL-MSCs were seeded at a density of 3 × 10⁶ cells/cm2 in 96-well U-bottom cell culture plates (Jet Biofil, China). Cells were incubated in complete DMEM medium at 37 °C in a humidified atmosphere with 5% CO2 overnight. The medium was then substituted with a complete MSCgo™ Chondrogenic XF medium (Sartorius, Germany). After 3 weeks of induction, the spheroidal mass was fixed with 10% formalin for 30 min at room temperature before being stained overnight in the dark with 1% Alcian Blue Solution (HiMedia, India) at room temperature. The stained mass was observed under an inverted microscope (Nikon Eclipse Ts2R, Japan). For controls, MSCs were cultured in complete DMEM medium and processed similarly to cells in each differentiation medium, respectively.
Cell viability assay
The viability of fucoxanthin-treated PL-MSCs was evaluated by the 3-(4, 5-dimethylthiazol-2-yl)-2,5-diphenyltetrazolium bromide (MTT) assay (Sigma-Aldrich, USA). Briefly, PL-MSCs were seeded at a density of 3 × 10⁴ cells/cm2 into a 96-well plate (Corning, USA). After overnight culture, cells were treated with fucoxanthin (Sigma-Aldrich, USA) at final concentrations of 1, 2, 3, 4, 5, 10, and 20 µM for 24, 48 and 72 h. Following the respective experimental time, the cells were incubated with 0.5 mg/ml MTT in completed DMEM for 4 h at 37 °C. Subsequently, 100 μl dimethyl sulfoxide (DMSO) was added to each well. The absorbance was measured at 570 nm using a Synergy HT Multi-Detection Microplate Reader and Agilent BioTek Gen6 software (BioTek Instruments Inc., USA). Cell viability was calculated as shown in the equation:
$$ {text{Cell }};{text{viability }}left( {% {text{ of }};{text{control}}} right) = left( {frac{{ {text{OD }}left( {{text{test}}} right) , – {text{ OD }}left( {{text{blank}}} right) }}{{{text{OD }}left( {{text{control}}} right) , – {text{ OD }}left( {{text{blank}}} right)}}} right) times 100 $$
H2O2-induced cytotoxicity assay
PL-MSCs were seeded into a 96-well plate (Corning, USA) at a density of 3 × 10⁴ cells/cm2 and incubated at 37 °C in the presence of 5% CO2 for 24 h. After removing the medium, the PL-MSCs were incubated with various concentrations of H2O2 (50–1000 µM) in complete DMEM medium at 37 °C and 5% CO2 for 24 h. Control cells were cultured in complete DMEM medium without H2O2. Cell viability was examined using an MTT assay. The absorbance was measured at 570 nm using a Synergy HT multi-detecting microplate reader as described above.
The effect of fucoxanthin on the viability of H2O2-treated PL-MSCs
To evaluate the protective effect of fucoxanthin on MSC viability under oxidative stress conditions, PL-MSCs were seeded in a 96-well plate (Corning, USA) at a density of 3 × 10⁴ cells/cm2. Two treatment groups were designed: (1) Co-treatment: PL-MSCs were treated with the combination of 750 µM H2O2 and 1–5 µM fucoxanthin for 24 h, and (2) Pre-treatment: PL-MSCs were pre-treated with fucoxanthin at a concentration of 1–5 µM for 24 h; subsequently, the medium was removed and PL-MSCs were incubated with fresh complete DMEM medium supplemented with 750 µM H2O2 without fucoxanthin for 24 h. PL-MSCs cultured in a complete DMEM medium served as a control. The viability of PL-MSCs was evaluated using an MTT assay, and the absorbance was measured at 570 nm using a Synergy HT multi-detecting microplate reader as described above.
Cellular senescence assay
The investigation of replicative senescence of PL-MSCs under oxidative stress conditions was conducted using a β-galactosidase (β-Gal) activity assay kit (Sigma-Aldrich, USA) following the instructions provided by the manufacturer. The PL-MSCs were seeded into a 12-well plate (Corning, USA) at a density of 1 × 10⁴ cells/cm2 and kept in an incubator at a temperature of 37 °C with a 5% CO2 for 24 h. Subsequently, PL-MSCs underwent co-treatment or pre-treatment with fucoxanthin at concentrations ranging from 1 to 5 µM and H2O2 at a concentration of 750 µM for 24 h, as previously mentioned. PL-MSCs cultured in a complete DMEM medium served as a control. The PL-MSCs were subsequently fixed using a 1X fixative buffer for 7 min at ambient temperature. Afterwards, the PL-MSCs were cultured with a substrate, 5-bromo-4-chloro-3-indolyl-β-d-galactopyranoside (X-gal), pH 6.0, for 6 h at 37 °C. The identification of the blue color resulting from β-Gal staining was performed using an inverted microscope (Nikon Eclipse Ts2R, Japan). The cells exhibiting a positive blue color were enumerated, along with the total number of cells in each sample, across 9 fields. The data were calculated and expressed as a percentage of senescent cells using the following formula:
$$ {text{Senescent}};{text{ cells }}left( % right) = frac{{left( {{text{Number}};{text{of}};{text{positive}};{text{cells}}} right)}}{{left( {{text{Number}};{text{of}};{text{total}};{text{cells}}} right)}} times 100 $$
Detection of antioxidant biomarkers
The antioxidant biomarkers SOD and GSH were investigated using a colorimetric SOD activity assay kit (Sigma-Aldrich, USA) and a GSH + GSSG/GSH assay kit (Abcam, USA) according to the manufacturer’s instructions, respectively.
Superoxide dismutase (SOD) activity assay
PL-MSCs were seeded at a density of 1.5 × 10⁴ cells/cm2 into a 6-well plate (Corning, USA) and incubated at 37 °C under 5% CO2 for 24 h. Then, PL-MSCs were co-treated or pre-treated with 1–5 µM fucoxanthin and 750 µM H2O2 for 24 h as described above. PL-MSCs cultured in complete DMEM medium served as control. Subsequently, the PL-MSCs were harvested and lysed with lysis buffer (0.1 M glycine, 1% Nonidet P-40, 1 mM MgCl2 and 1 mM ZnCl2, pH 9.6). After centrifugation at 8000×g, 4 °C for 10 min, the supernatants were collected for the colorimetric SOD activity assay according to the manufacturer’s instructions. The absorbance was measured at 440 nm using a Synergy HT Multi-Detection Microplate Reader. Units of SOD activity in the sample solution were determined using the standard SOD enzyme (Sigma-Aldrich, USA). The measured SOD activity was expressed as units/mg of protein.
Glutathione (GSH) assay
PL-MSCs were seeded at a density of 1.5 × 10⁴ cells/cm2 into each well of 6-well plates (Corning, USA) and incubated for 24 h at 37 °C under 5% CO2. The PL-MSCs were then co-treated or pre-treated with 1–5 µM fucoxanthin and 750 µM H2O2 for 24 h. The control was cultured in complete DMEM medium only. Subsequently, the PL-MSCs were collected and lysed with 80 µl glutathione buffer. The cells were then incubated on ice for 10 min and 20 µl of 5% sulfosalicylic acid (SSA) was added. After centrifuging at 8000 × g, 4 °C for 10 min, the supernatant was collected. The yellow-colored substrate was measured at 405 nm using a Synergy HT multi-detecting microplate reader. The concentration of GSH in the sample solution was determined using the standard glutathione calibration curve.
Detection of ROS as an oxidative stress biomarker
The expression of intracellular ROS was evaluated by measuring the oxidative conversion of cell-permeable 2′, 7′-Dichlorofluorescein diacetate (DCFH-DA; Abcam, USA) to fluorescent dichlorofluorescein (DCF) following the manufaturer’s instructions using a fluorospectrophotometer and fluorescence microscopy. For fluorospectrophotometer, PL-MSCs were seeded at a density of 3 × 10⁴ cells/cm2 into each well of a 96-well black clear bottom plate (SPL Life Science, South Korea). For fluorescence visualization, PL-MSCs were seeded at a density of 3 × 10⁴ cells/cm2 into each well of a 24-well plate (Corning, USA). The PL-MSCs were co-treated or pre-treated with fucoxanthin at a concentration of 1–5 µM and 750 µM H2O2 as described above. PL-MSCs cultured in complete DMEM medium served as control. At the respective experimental time, the cells were washed with PBS and incubated with 20 µM DCFH-DA in PBS at 37 °C for 1 h. Intracellular ROS converted non-fluorescent DCFH-DA molecules into fluorescent DCF molecules. Subsequently, the fluorescent intensities were determined using a fluorescent microplate reader (Varioskan™ LUX multimode microplate reader; Thermo Fisher Scientific, USA) at an excitation wavelength of 495 nm and an emission wavelength of 529 nm. For visualization, representative images of intracellular ROS levels visualized through green fluorescent labeling and nuclear staining with Hoechst 33342 exhibiting blue fluorescence were also captured using inverted fluorescence microscopy (Nikon Eclipse Ts2R, Japan).
Gene expression analysis by quantitative real-time polymerase chain reaction (qRT-PCR)
To investigate the expression of genes in PL-MSCs cultured under oxidative stress conditions, PL-MSCs were co-treated or pre-treated with 1–5 µM fucoxanthin and 750 µM H2O2 for 24 h and 48 h. PL-MSCs cultured in complete DMEM medium served as control. At each time point, total RNA was extracted using TRIzol® reagent (Invitrogen, USA). Then, 1 µg of extracted RNA was reverse transcribed into cDNA using iScript™ Reverse Transcription supermix (Bio-Rad, USA) according to the manufacturer’s instructions. Gene expression was quantified using iTaq™ Universal SYBR® green supermix (Bio-Rad, USA). Thermocycling conditions were as follows: pre-denature at 95 °C for 10 min, followed by 40 cycles of denaturation at 95 °C for 15 s and annealing/amplification at 60 °C for 60 s using the StepOne Plus® real-time PCR system (Applied Biosystems, USA). All reactions were performed at least in triplicate and analyzed using StepOne™ Software version 2.3 (Applied Biosystems, USA). Target gene expression levels were normalized against glyceraldehyde-3-phosphate dehydrogenase (GAPDH) based on the relative quantification formula of 2−ΔΔCt. The primer sequences are listed in Table 1.
Protein extraction and Western blot analysis
Expressions of cyclin D1, an essential protein for cell cycle progression, and the PI3K/Akt/Nrf-2 signaling pathway in PL-MSCs cultured under oxidative stress conditions as above were investigated by Western blot analysis. Cells were lysed with RIPA buffer (0.05 M Tris–HCl, pH 7.4, 1% TritonX-100, 1% sodium deoxycholate, 0.1% SDS, 0.15 M NaCl) containing a protease and phosphatase inhibitor cocktail (Cell Signaling Technology, USA). After incubation for 20 min on ice, the lysates were centrifuged to remove cell debris. Protein concentration was determined using the Bradford assay (Bio‑Rad Laboratories, Inc.). For Western blot analysis, equal amounts of protein (20 µg) from each sample diluted with the 3X reducing SDS loading buffer (Cell Signaling Technology, USA), and a molecular weight marker (Abcam, USA) were loaded onto 12% sodium dodecyl sulfate polyacrylamide gel electrophoresis (SDS-PAGE). Electrophoresis was carried out at 120 V for 90 min. Proteins on SDS-PAGE gels were transferred to nitrocellulose membranes (0.45 µm pore-size; Bio-Rad, USA) using a Mini Trans-Blot® Electrophoretic Transfer Cell (Bio-Rad, USA) at 120 V for 90 min.
Following transfer, the membranes were gently stained using 0.1% (w/v) Ponceau S in 5% acetic acid. Next, the membranes were carefully cut to facilitate the incubation process with different primary antibodies. Afterward, the membranes were blocked with 5% non-fat dry milk in Tris buffered saline with 0.1% Tween® 20 (TBST) for 1 h. Subsequently, the membranes were incubated with primary antibodies (Table 2) at 4 °C overnight and incubated with secondary antibodies, horseradish peroxidase (HRP)-conjugated mouse anti-rabbit antibody (1:10,000 dilution; Jackson ImmunoResearch, USA) or goat anti-mouse antibody (1:10,000 dilution; Jackson ImmunoResearch, USA) for 1 h at room temperature. The protein bands were detected with enhanced chemiluminescence (ECL) using Clarity™ Western ECL Substrate (Bio-Rad, USA). The signals were captured with an Amersham Imager 600 (GE Healthcare Life Sciences). For quantification, the protein band intensity was quantified using NIH software (ImageJ) and expressed as a ratio to the β-actin band intensity.
Nanostring® nCounter assay
To investigate the effect of fucoxanthin on gene expression in H2O2-treated PL-MSCs, NanoString® nCounter Technology (NanoString Technologies, Seattle, WA, USA) was performed using the nCounter® metabolic pathways panel. PL-MSCs were co-treated with a complete medium supplemented with 5 µM fucoxanthin and 750 µM H2O2 for 24 h. The controls were cultured in complete medium and complete medium supplemented with 750 µM H2O2 for 24 h. Total RNA was isolated using the PureLink™ RNA Mini Kit (Ambion, USA). One hundred nanograms of extracted mRNA were used as input material. Subsequently, a hybridization process was conducted overnight at a temperature of 65 °C, utilizing 50 bases of nCounter Reporter and Capture probes. Following the process of hybridization, the samples were subsequently introduced into the nCounter Prep Station for the purpose of purifying the samples and immobilizing the target/probe complex onto the cartridge. The nCounter Digital Analyzer was utilized to perform a high-density scan (555 fields of view) for each assay. This scan was designed to enumerate individual fluorescent barcodes and measure the abundance of target RNA molecules in each sample. Analysis of multiplexed gene expression of 768 genes was performed following the manufacturer’s instructions on the Counter Flex system and using the nSolver software v4.0. Transcription copies were standardized using the geometric mean of 20 maintenance genes for baseline and normalization. The threshold count value of 50 was the baseline subtraction parameter; gene expression fold changes were calculated by comparing fucoxanthin-treated samples with untreated controls. Raw P values from differential expression analyzes were used to evaluate gene expression data. All heat maps and data sets were generated using the nCounter Analysis and Advanced Analysis packages of nSolver4.0 (NanoString Technologies, Seattle, WA, USA).
Statistical analysis
Data were analyzed and presented as the mean ± standard error of the mean (SEM). Statistical comparisons were performed using the paired T-test for paired samples, using SPSS software version 25 (SPSS, Inc.). A p-value of less than 0.05 was considered statistically significant.
Ethics approval and consent to participate
All experimental procedures were conducted in accordance with the Declaration of Helsinki and the Belmont report. This study was approved by the Human Research Ethics Committee of Thammasat University (Medicine) [Approval title: The effects of fucoxanthin on the proliferation and osteogenic differentiation of human mesenchymal stem cells.] [Approval number: 024/2021] (Date of approval: February 4, 2021). All samples were obtained from donors with written informed consent.
- SEO Powered Content & PR Distribution. Get Amplified Today.
- PlatoData.Network Vertical Generative Ai. Empower Yourself. Access Here.
- PlatoAiStream. Web3 Intelligence. Knowledge Amplified. Access Here.
- PlatoESG. Carbon, CleanTech, Energy, Environment, Solar, Waste Management. Access Here.
- PlatoHealth. Biotech and Clinical Trials Intelligence. Access Here.
- Source: https://www.nature.com/articles/s41598-023-49751-5