Animal experimentation
All animal experiments were performed according to local animal welfare laws and approved by the local authority Landesamt für Gesundheit und Soziales (license numbers ZH120, G0284/18, G021/19 and G0243/18). Mice were housed in individually ventilated cages (Techniplast) on bedding (S-SELECT-09322) on a 12 h dark/light cycle and fed ad libitum (Ssniff, V1124-300).
Cell lines and culture conditions
Mouse ESCs
E14 ESCs (S. Kinkley Lab, MPIMG) were used. Cells were plated on 0.1% gelatin-coated dishes and grown in Dulbecco’s modified Eagle medium (DMEM) high glucose with GlutaMAX medium (Thermo Fisher, 31966047) supplemented with 15% foetal bovine serum (FBS; Thermo Fisher, 2206648RP), 1× non-essential amino acids (Thermo Fisher, 11140-035), 1× β-mercaptoethanol (Thermo Fisher, 21985023), 1× penicillin/streptomycin (Life Technologies, 15140148) and 1,000 U ml−1 LIF (homemade) and grown at 37 °C in 20% O2 and 5% CO2.
Mouse TSCs
TSCs (M. Zernicka-Goetz Lab, Caltech) were grown on mitotically inactivated mouse embryonic fibroblasts in media containing Roswell Park Memorial Institute 1640 medium with GlutaMAX (Gibco 61870010, Thermo), 20% FBS, 1× β-mercaptoethanol (Thermo Fisher, 21985023), 1× penicillin/streptomycin (Life Technologies, 15140148), 1× sodium pyruvate, 25 ng µl−1 FGF4 (R&D Systems, 235-F4-025) and 1 µg ml−1 heparin (Sigma, H3149). Cells were depleted off feeders at the time of collection for analysis. Cell lines have not been authenticated but have been sextyped. Cells tested negative for mycoplasma.
Developmental pausing setup
Mouse ESC/TSC pausing
Cells were treated with the mTOR inhibitor INK-128 (MedChem Express, HY-13328) at 200 nM final concentration. Medium was replenished daily.
In vitro fertilization
The 8–12-week-old b6d2F1 mice (Janvier Labs or produced in-house at the MPIMG) were superovulated by an intraperitional injection with pregnant mare serum gonadotrophin (5 IU per 100 µl) on day 0 of the superovulation protocol. On day 2, mice were intraperitonially injection with human chorionic gonadotropin (5 IU per 100 µl). On day 3, mice were killed with CO2 and cervical dislocation, after which the cumulus oocyte complexes were retrieved. Oocytes were fertilized using b6casF1 (MPIMG) sperm. After overnight culture, the obtained two-cell stage embryos were transferred to a fresh drop of KSOM (Merck, MR-107-D).
Mouse blastocyst pausing in vitro
Embryos as generated above were used. Starting at E3.5, embryos were cultured in reduced KSOM medium made in-house (Supplementary Table 5). A 2× homemade reduced KSOM medium was prepared and stored for up to 3 months at −80 °C. The medium was filtered through a 0.22 µm filter (Corning, 431118). A 1× reduced KSOM medium was freshly prepared from the 2× frozen stock before each experiment with the addition of CaCl2•2H2O and bovine serum albumin (BSA) fraction V. The reduced KSOM contains a total nutrient content of 10.4 mM, compared with 13.5 mM in commercially available KSOM56. Embryos were cultured in four-well dishes (Nunc IVF multidish, Thermo Fisher, 144444) in a volume of 500 µl reduced KSOM under hypoxic conditions (5% O2 and 5% CO2 at 37°C). Embryo survival was evaluated daily under a stereomicroscopy and collapsed embryos were removed.
Embryo supplements
Supplements are listed in Supplementary Table 5. The supplement solvent concentration did not exceed 2%.
Survival analysis
Embryo survival curves were plotted in RStudio (version 1.3.1093 with R version 3.6.3) with the survminer (version 0.4.9) package. The survival (version 3.3-1) package was used to extract median and maximum survival values.
In vivo diapause induction
In vivo diapause was induced as previously described57 after natural mating of CD1 mice. Briefly, pregnant females were ovariectomized at E2.5 and afterwards injected every other day with 3 mg medroxyprogesterone 17-acetate (subcutaneously). Diapaused blastocysts were flushed from uteri in M2 media after 4 days of diapause at EDG7.5.
Global proteomics
Sample preparation
Proteomics sample preparation was done following a published protocol with minor modifications58. In brief, 5 × 10⁶ cells were lysed under denaturing conditions in 500 µl of buffer containing 3 M guanidinium chloride (GdmCl), 10 mM tris(2-carboxyethyl)phosphine, 40 mM chloroacetamide and 100 mM Tris–HCl pH 8.5. Lysates were denatured at 95 °C for 10 min by shaking at 1,000 rpm and sonicated for 10 min. A total of 100 µl lysate was diluted with dilution buffer (10% acetonitrile and 25 mM Tris–HCl, pH 8.0, to reach a 1 M GdmCl concentration). Proteins were digested with LysC (Roche; enzyme-to-protein ratio 1:50, mass spectroscopy (MS) grade) shaking at 700 rpm at 37 °C for 2 h. The digestion mixture was diluted again to reach 0.5 M GdmCl, followed by a tryptic digestion (Roche, enzyme-to-protein ratio 1:50, MS grade) and incubation at 37 °C overnight in at 700 rpm. Peptide desalting was performed according to the manufacturer’s instructions (Pierce C18 Tips, Thermo Fisher Scientific). Desalted peptides were reconstituted in 0.1% formic acid in water and separated into four fractions by strong cation exchange chromatography (SCX 3 M purification). Eluates were dried in a SpeedVac, dissolved in 5% acetonitrile and 2% formic acid in water, briefly vortexed and sonicated for 30 s before injection to nano liquid chromatography–tandem mass spectometry (LC–MS/MS).
Run parameters
LC–MS/MS was carried out by nano-flow reverse phase LC (Dionex Ultimate 3000, Thermo Fisher) coupled online to a Q Exactive HF Orbitrap mass spectrometer (Thermo Fisher), as reported previously59. LC separation was performed using a PicoFrit analytical column (75 μm inner diameter (ID) × 50 cm long, 15 µm tip ID; New Objectives) packed in-house with 3-µm C18 resin (Reprosil-AQ Pur, Dr. Maisch).
Peptide analysis
Raw MS data were processed with MaxQuant software (v1.6.10.43) and searched against the mouse proteome database UniProtKB with 55,153 entries, released in August 2019. The MaxQuant processed output files can be found in Supplementary Table 1.
Global proteomics analysis
The DEP package (version 1.14.0) was used for the global proteomics analysis60. Potential contaminants were filtered, unique gene names were generated and only proteins that were quantified in two out of three replicates were included for further analysis. Data were normalized, and missing values were imputed using random draws from a Gaussian distribution centred around a minimal value.
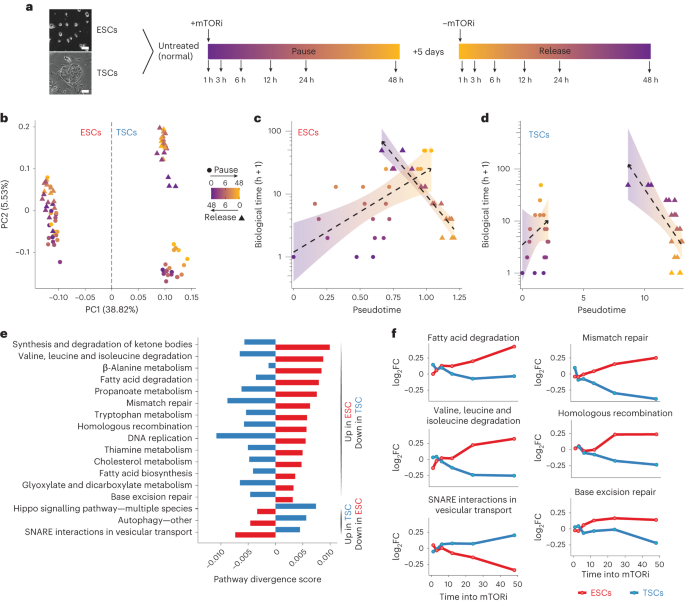
Pseudotime analysis
Unique peptide abundances were averaged across replicates. The 500 most variable proteins were selected for downstream analysis. Z-score was calculated and used for diffusion maps via the destiny package version 3.8.0 in R version 4.1.0 with parameter n_pcs = 10. Diffusion pseudotime was calculated using the DPT function of the destiny package.
Pathway divergence analysis
Differentially expressed genes were identified using the DEP package. log2 fold change (FC) and adjusted P values during entry into pausing compared with 0 h were computed. KEGG61 pathways containing at least ten genes were retained for the divergence analysis. Pathway expression value corresponds to the mean log2FC of proteins in the pathway.
Divergence score was calculated as:
$$begin{array}{l}mathrm{Divergence};mathrm{score}=m_{{mathrm{ESC}}}left(mathrm{mean};{log }_{2}mathrm{FC};mathrm{pathway};mathrm{expression}frac{mathrm{tP}}{mathrm{tN}}right)-m_{{mathrm{TSC}}}left(mathrm{mean};{log }_{2}mathrm{FC};mathrm{pathway};mathrm{expression}frac{mathrm{tP}}{mathrm{tN}}right)end{array}$$
where tP is the pause timepoint, tN is the normal (untreated) timepoint and m denotes the slope of pathway expression over time, computed with linear regression.
Pathways with a divergence score of >0.0075 were considered divergent. Waterfall plots were generated using ggplot2 (version 3.3.5).
Time-series differential expression analysis
Potential contaminants were removed, and label-free quantitation values were log2 transformed in Perseus version 1.6.14.0. For each cell type, rows were filtered and only proteins expressed in two out of three samples of at least one timepoint were retained. Values were extracted, and a one-way repeated measures ANOVA with MetaboAnalyst 4.0 was used for time-series analysis62. Proteins with an adjusted P value of <0.05 were regarded as differentially expressed.
Dynamics of differentially expressed proteins
k-Means clustering was used to identify the dynamic behaviour of the differentially expressed proteins. The R stats package ‘stats’ (version 4.1.0) was used.
GO term analysis
The clusterProfiler R package (version 4.0.5) and the Benjamini–Hochberg correction was used, with P value cutoff of 0.05 and q value cutoff of 0.1.
Metabolomics
A total of 1 × 10⁸ ESCs were collected in three biological replicates. Metabolite extraction and LC–MS/MS measurements were done as previously reported by us63,64. Methyl-tert-butyl ester (Sigma-Aldrich), methanol, ammonium acetate and water were used for metabolite extraction. Subsequent separation was performed on an LC instrument (1290 series UHPLC, Agilent), coupled to a triple quadrupole hybrid ion trap mass spectrometer QTrap 6500 (Sciex), as reported previously65.
Data analysis
The metabolite identification was based on the correct retention time, up to three multiple reaction monitorings and a matching multiple reaction monitoring ion ratio of tuned pure metabolites as a reference. Relative quantification was performed using MultiQuantTM software v.2.1.1 (Sciex), and all peaks were reviewed manually. Only the average peak area of the transition was used for calculations. Normalization was based on cell number of the samples and subsequently by internal standards. Metabolites with a P < 0.05 and absolute log2FC >0.75 were regarded as statistically significant.
Embryo metabolomics sample prep
To distinguish the different experimental conditions, embryos were fluorescently labelled with MitoSpy Green (E4.5), MitoSpyRed (D8 mTORi) and 4′,6-diamidino-2-phenylindole (DAPI; D15 mTORi + c). Embryos were washed 3× with phosphate-buffered saline (PBS), 3× with 100 mM ammonium acetate (Merck, 1.01116.1000), deposited onto microscope slides, desiccated for 1 h and stored at −80 °C. Sample slides were desiccated for 1 h in a vacuum chamber and matrix deposition was performed using a TM Sprayer (HTX Technologies) according to the protocol. Matrix for negative mode was 1,5-diaminonaphthalene (Sigma) at 7 mg ml−1 sprayed at a constant rate of 0.05 ml min−1 for seven passes. For positive mode, 2,5-dihydroxybenzoic acid (Sigma) at 15 mg ml−1 was sprayed at a constant rate of 0.07 ml min−1 for eight passes. Mass spectrometry imaging was performed with the AP-SMALDI5-Orbitrap MS. The mass range was 100–500 m/z for negative mode and 250–1200 m/z for positive mode. After matrix coating, samples were imaged on an AP-SMALDI5 ion source (TransMIT) coupled to a Q Exactive Plus mass spectrometer (Thermo Fisher). Samples were imaged at 15 µM step size with attenuator level 28. Typical acquisition time was 1–2 h per sample, and the area covered was ~50–100 px2. Raw data were analysed by converting to imzML and IBD format using Thermo Fisher ImageQuest software with centroiding. Results were annotated and interpretated using metaspace (https://metaspace2020.eu/).
Embryo metabolomics data analysis
A total of 26 ions with a false discovery rate <10% and embryonic localization were detected. Metabolite ion intensity was represented as a grey value in grey-scale images. To quantify each metabolite across the full embryo respectively, z-projections of all metabolites per spot were created and the embryos masked manually in ImageJ. The resulting masks were used to quantify the average intensity for each metabolite. Integrated intensity was calculated as average intensity multiplied by number of pixels per embryo. The log2FC over E4.5 was computed as integrated intensity (sample) divided by mean E4.5 integrated intensity per metabolite, which was then log2 transformed and visualized with a heatmap using ggplot2 (version 3.3.5).
Seahorse analysis
A total of 35,000 cells were plated onto gelatin-coated cell culture miniplates and incubated overnight at 37 °C and 5% CO2. Seahorse analysis was performed following the manufacturer’s recommendations for Mitostress, Glycostress and Mito Fuel Flex kits. An Agilent Seahorse XFp Extracellular Flux Analyzer was used for measurements.
Data analysis
Basal respiration and glycolysis rates, and glucose and fatty acid dependency values, were computed using the Seahorse 2019 software. Three technical and two biological replicates were performed. Data were plotted with ggplot2.
FAO rate assay
Cells were treated with 50 mM etomoxir and/or 200 nM INK128 for 48 h as described in Results. Cells were trypsinized and plated on Matrigel (Sigma-Aldrich, CLS356237) pre-coated Ibidi µ-Slide 8 Well slides (Ibidi, 80821). After 30 min of attachment, cells were stained for 1 h with SPY650-DNA (SpiroChrome, SC501) in culture medium with inhibitors at 37 °C, washed twice with HEPES-buffered saline (Sigma-Aldrich, 40010) and stained for 2 h with 20 µM FAOBlue (DiagnoCine, FNK-FDV-0033) in DMEM with inhibitors at 37 °C in 20% O2 and 5% CO2. Cells were washed once with HEPES-buffered saline and imaged with 200 µl HEPES-buffered saline. Imaging was done on a Zeiss Plan-Apochromat 20×/0.8 objective on the Zeiss LSM880 Airy microscope using longitudinal-section magnetic mode. Images were processed using Fiji ImageJ2 (version 2.3.0) and quantified using CellProfiler (version 4.2.1).
ESC/TSC derivation
ESCs were derived from E3.5 or D12 + c embryos of b6d2F1 females (Janvier Labs or produced in-house at the MPIMG, 8–12 weeks old) and b6casF1 males (produced in-house at the MPIMG, 2–6 months old) as described previously66,67. In brief, embryos were seeded onto mouse embryonic fibroblasts (MEFs) and allowed to attach for 3 days in knockout DMEM (Thermo Fisher, 10829018) supplemented with 20% knockout Serum Replacement (Thermo Fisher, 10828028), GlutaMAX (1.7 mM final, Thermo Fisher Scientific, 35050038), 1× non-essential amino acids (Thermo Fisher, 11140-035), 1× β-mercaptoethanol (Thermo Fisher, 21985023), 1× penicillin/streptomycin (Life Technologies, 15140148) and 1,000 U ml−1 LIF. Cells were grown at 37 °C in 20% O2 and 5% CO2. After attachment, medium was refreshed every second day, until the attached outgrowths were disaggregated. After forming colonies, cells were passaged and expanded.
TSCs were derived following previous protocols68. In brief, embryos were seeded onto MEFs and allowed to attach for 3 days in Roswell Park Memorial Institute 1640 medium with GlutaMAX (Thermo Fisher, 10438026), supplemented with 20% FBS (Thermo Fisher, 2206648RP), 1× sodium pyruvate (Thermo Fisher, 11360070), 1× β-mercaptoethanol (Thermo Fisher, 21985023) and 1× penicillin/streptomycin (Life Technologies, 15140148). Cells were grown at 37 °C in a 20% O2 and 5% CO2 incubator. Medium was refreshed every second day, until the attached outgrowths were disaggregated. After colony formation, cells were passaged and expanded.
Electron microscopy
Diapaused (EDG7.5) or E4.5 CD1 (produced from 8–12-week-old CD1 females bred with 2–6-month-old CD1 males produced in house at the MPIMG) embryos were isolated and immediately fixed in 2.5% glutaraldehyde (grade I, Sigma) in PBS for 90 min at room temperature. The fixed embryos were subsequently embedded in 2% low melting point agarose (Biozym). Agarose was cut into cubes with an edge length of ~1 mm, containing one embryo per cube. The cubes were collected in 3-ml glass vials and stored overnight at 4 °C in PBS. Afterwards samples were post-fixed in 0.5% OsO4 for 2.5 h at room temperature on a specimen rotator followed by four washes in ddH2O at room temperature for 5 min each. Samples were then incubated for 1 h in 0.1% tannic acid (Science Services) dissolved in 100 mM HEPES on a rotator, followed by three washes in ddH2O at room temperature for 10 min each. Samples were incubated in 2% uranyl acetate (Sigma-Aldrich, Merck) for 90 min at room temperature on a specimen rotator. Samples were washed in ddH2O and dehydrated through a series of increasing ethanol concentrations. Samples were incubated in a 1:1 mixture of propylene oxide and absolute ethanol for 5 min at room temperature followed by 2 × 10 min incubation in pure propylene oxide (Sigma-Aldrich, Merck) and a 30-min incubation in a 1:1 mixture of propylene oxide and Spurr resin (Low Viscosity Spurr Kit, Ted Pella, Plano GmbH) at room temperature. Samples were transferred to pure Spurr resin mixture and infiltrated overnight at 4 °C. Embryos were then polymerized at 60 °C for 48 h. Ultrathin sections (70 nm) were cut using a Leica UC7 ultramicrotome equipped with a 3-mm diamond knife (Diatome) and placed on 3.05-mm formvar carbon-coated TEM copper slot grids (Plano GmbH). Sections were post-contrasted with UranyLess EM stain and lead citrate (both from Science Services). Sections were imaged fully automatically at 4,400× nominal magnification using Leginon on a Tecnai Spirit transmission electron microscope (FEI) operated at 120 kV, which was equipped with a 4k × 4k F-416 CMOS camera (TVIPS). Acquired images were then stitched to a single montage using the TrakEM2 plugin69 implemented in Fiji70.
Analysis
Semi-automated analysis was done using the ZEN 3.4 Blue software (Zeiss). Blastocysts and subcellular structures were manually masked. The ZEN 3.4 Blue inbuilt function zone of influence analysis was carried out on the masked images to determine the number of mitochondria surrounding each LD (radius of 80 pixels). In cases where LDs occurred as clusters, binary dilation with a count of 15 was used to fuse the LDs in a cluster.
IF staining
Cell lines
ESCs were directly cultured on the Nunc Lab-Tek II Chamber Slide System (Thermo Fisher Scientific, 154534). TSCs were trypsinized after culture and colonies were plated on Matrigel-coated (Sigma-Aldrich, CLS356237) Nunc Lab-Tek II Chamber Slides for 30 min. Cells were fixed for 10 min in 4% paraformaldehyde, then permeabilized for 15 min in 0.2% Triton X-100 (Sigma, T8787) in PBS. Permeabilized cells were incubated in blocking buffer (0.2% Triton X-100 in PBS, 2% BSA (BSA Fraction V 7.5%, Gibco, 15260-037) and 5% goat serum (Jackson Immunoresearch/Dianova, 017-000-121)) for 1 h. Cells were incubated overnight at 4 °C with the following primary antibodies: Lamin B1 (Abcam, 16048), H3K9me2 (Abcam, 1220), phospho-mTOR (Abcam, ab131538), pS6 (CST, 4858 S), pAKT (CST,), OCT3/4 (Santa Cruz, sc-5279) and CDX2 (Biogenex, MU392A-UC). Cells were washed and incubated with the following secondary antibodies for 1 h at room temperature: donkey anti-rabbit AF647 (Thermo Fisher, A32795) and donkey anti-mouse AF488 (Thermo Fisher, A21202). Cells were washed, embedded and imaged with the Zeiss Plan-Apochromat 20×/0.8 or 63× 1.4 NA oil objectives on the Zeiss LSM880 Airy microscope using Airy scan. Airy processing (two-dimensional, strength of one) was done with the Zen Black software. Images were processed using Fiji ImageJ2 (version 2.3.0) and quantified using CellProfiler (version 4.2.1). Nuclei were identified as primary objects using the DAPI stain. The integrated intensities were normalized to the DAPI intensity or nuclear area. The signal intensity of H3K9me2, LAMIN B1 and DAPI were quantified per cell, using the multichannel plot profile of the BAR plugin in Fiji-2. The cell size was scaled, and H3K9me2 and LAMIN B1 intensity were plotted.
Embryos
Embryos were fixed, permeabilized and incubated in blocking buffer as described above, then incubated overnight at 4 °C with the following primary antibodies: Oct3/4 (Santa Cruz, sc-5279), H4K16ac (Millipore, 7329), c-Caspase3 (CST, 9661S), FoxO1 (CST, 2880T), Lamin B1 (Abcam, cat#. 16048), H3 (dimethyl K9) antibody (Abcam, 1220), phospho-mTOR (Abcam, ab131538), pS6 (CST, 4858S), pAKT (CST, 4060T), pAMPK (Abcam, ab23875), pACC (CST, 11818T), pULK (CST, 14202S), LC3B (CST, 83506S), LAMP1 (CST, 99437S), CPT1A (Abcam, ab128568) and SOX2 (R&D System, AF2018). Embryos were washed and incubated with the same secondary antibodies as above and donkey anti-goat AF594 (Thermo Fisher, A11058) for 1 h at room temperature. Embryos were washed and mounted on a microscope slide with a Secure-Seal Spacer (eight wells, 9 mm diameter and 0.12 mm deep, Thermo Fisher, S24737). LDs were stained using BODIPY, together with CellMask Deep Red (Thermo Fisher, A57245) and Hoechst 33342 (Thermo Fisher, H3570) in PBS. Imaging, processing and quantifications were done as described above. H3K9me2, LAMIN B1 and DAPI were quantified using the multichannel plot profile of the BAR plugin in Fiji-2. The cell size was scaled, and intensities were normalized for DAPI.
Alkaline phosphatase staining
ESCs were grown on MEFs and allowed to form colonies. The Vector Red Substrate Kit, with alkaline phosphatase (Vector Labs, VEC-SK-5100), was used according to the manufacturer’s instructions.
Single embryo proteomics experimental setup
Embryos were cultured in reduced KSOM, paused for 5 days via mTOR inhibition with 200 nM RapaLink-1 and supplemented with 1 mM l-carnitine, or treated with 50 µM etomoxir or 25 mM AS1842856 together with 1 mM l-carnitine.
Sample preparation
Mouse embryos (consisting of approximately 100–120 cells each) were isolated and transferred individually in low protein binding 96-well plates containing 5 µl lysis buffer (PreOmics). The plate was incubated at 95 °C for 2 min and centrifuged at 100g for 1 min. Lysed proteins were digested with 5 ng trypsin (1 ng µl−1 in ammonium bicarbonate, pH 8, Roche) at 37 °C for 3 h. Samples were acidified by adding 15 µl 1% formic acid in water and then put on a rocking platform at 300 rpm for 1 min to mix and centrifuged at 100g for another minute.
Run parameters
The digests were loaded onto Evotip Pure (Evosep) tips according to the manufacturer’s protocol. Peptide separation was carried out by nano-flow reverse phase LC (Evosep One, Evosep) using the Aurora Elite column (15 cm × 75 µm ID, C18 1.7 µm beads, IonOpticks) with the 40 samples a day method (Whisper_100_40SPD). The LC system was online coupled to a timsTOF SCP mass spectrometer (Bruker Daltonics) applying the data-independent acquisition with parallel accumulation serial fragmentation method.
Peptide analysis
MS data were processed with Dia-NN (v1.8.1) and searched against an in silico-predicted mouse spectra library. The ‘match between run’ feature was used, and the mass search range was set to 400–1,000 m/z, with the MS1 and MS2 accuracy set to 10 and 15 ppm, respectively.
The DEP package (version 1.14.0) was used for analysis60. Potential contaminants were filtered, unique gene names were generated and only proteins that were quantified in all replicates of at least one condition were retained for further analysis. Samples with fewer than 3,000 identified proteins were excluded from further analysis, data were normalized and missing values were imputed as described above.
KEGG pathway analysis
Data were prepared and filtered as described above. log2FC and adjusted P values for all conditions against E4.5 were computed. KEGG61 pathways containing at least ten gene symbols were included in the divergence analysis. The pathway expression value was defined as the mean log2FC of proteins between any of the timepoints during entry and the 0 h control.
Adult data RNA seq
The following datasets were used: GSE126338 (GSM3596803, GSM3596804, GSM3596805, GSM3596806, GSM3596807, GSM3596831, GSM3596832, GSM3596833, GSM3596808 and GSM3596834 were omitted due to low mapping quality), PRJEB13002 (ERR1308085, ERR1308086, ERR1308087, ERR1308082, ERR1308083 and ERR1308084), GSE121589 (GSM4140537, GSM4140538, GSM4140539, GSM4140540, GSM4140541, GSM4140542, GSM4140556, GSM4140557, GSM4140558, GSM4140559 and GSM4140560), GSE101576 (GSM2706308, GSM2706309, GSM2706310, GSM2706311, GSM2706312, GSM2706313 and GSM2706314), GSE116997 (GSM3267160, GSM3267161, GSM3267162, GSM3267157, GSM3267158 and GSM3267159), GSE138243 (GSM4103308, GSM4103309, GSM4103310, GSM4103311, GSM4103316, GSM4103317, GSM4103318 and GSM4103319), GSE138884 (GSM4121228, GSM4121229, GSM4121230, GSM4121234, GSM4121235, GSM4121236, GSM4121237, GSM4121231, GSM4121232, GSM4121233, GSM4121238, GSM4121239, GSM4121240 and GSM4121241), GSE135705 (GSM4716555, GSM4716556, GSM4716557 and GSM4716558) and GSE168617 (GSM5151338, GSM5151339, GSM5151340 and GSM5151341).
Reads were aligned to the reference genome mm10 using STAR-2.5.3a (ref. 71) with default parameters except: –outFilterMultimapNmax 5, –outFilterMismatchNoverLmax 0.1, –chimSegmentMin 10 and –quantMode GeneCounts. Reads were counted using HTSeq 0.11.4 (ref. 72) using GRCm38.gtf file (Ensembl Release 101) and default parameters, except –nonunique all and -a 0.
Differentially expressed genes were identified using DESeq2 (ref. 73). To measure the effect of the conditions and to simultaneously control for batch differences the design parameter ‘~ batch + condition’ was used. In addition, the six tissues were analysed separately. For tissues represented by more than one dataset, the design parameter ‘~ batch + condition’ was used, while design parameter ‘~ condition’ was used for tissues represented by one dataset.
The merged DESeq2 results were filtered for adjusted P < 0.05. Among them, the genes belonging to one of the following categories were selected: commonly upregulated genes (adjusted P < 0.05 and positive log2FC values in at least four out of six tissues), commonly downregulated genes (adjusted P < 0.05 and negative log2FC values in at least four out of six tissues) and tissue-specific genes (adjusted P < 0.05 only in the given tissue and not in the remaining ones). The heatmap (Fig. 7b), generated using R package ‘ComplexHeatmap’74, represents log2FC values from all DESeq2 runs for genes belonging to one of these categories.
GO term and pathway enrichment analysis
EnrichGO from the R package ‘clusterProfiler’75 were used with default parameters.
Statistics and reproducibility
No statistical method was used to pre-determine sample size, but our sample sizes are similar to those reported in previous publications13,76. No data were excluded from the analyses. The experiments were not randomized and the investigators were not blinded to allocation during experiments and outcome assessment. Data distribution was assumed to be normal, but this was not formally tested. The precise number of biological replicates is indicated in the figure legends. A minimum of three different embryos were used for embryo stainings and electron microscopy. For image quantifications, precise numbers of quantified cells are provided in the figures or legends. Number of embryos used for survival analyses are provided in the figures or legends. Source data are provided with this study. Exact P values that were not provided in the figures or legends are available in Supplementary Table 11.
Reporting summary
Further information on research design is available in the Nature Portfolio Reporting Summary linked to this article.
- SEO Powered Content & PR Distribution. Get Amplified Today.
- PlatoData.Network Vertical Generative Ai. Empower Yourself. Access Here.
- PlatoAiStream. Web3 Intelligence. Knowledge Amplified. Access Here.
- PlatoESG. Carbon, CleanTech, Energy, Environment, Solar, Waste Management. Access Here.
- PlatoHealth. Biotech and Clinical Trials Intelligence. Access Here.
- Source: https://www.nature.com/articles/s41556-023-01325-3