Animals and orthodontic force treatment
6–8-week-old Male Sprague Dawley rats (body weight of 200–250 g) and C57BL/6N mice were obtained from Weitong Lihua Experimental Animal Center (China), and Caspase-1−/− mice were generated by Viewsolid Biotech (Beijing, China). They were housed in controlled animal facilities with a temperature of (23 ± 2) °C, a humidity of 40% to 65%, and a 12/12 h light/dark cycle. Animals were fed with a standard laboratory diet and allowed ad libitum access to drinking water. All animals were maintained in specific pathogen-free (SPF) cages randomly and fed a normal diet. The animal number in each group (n = 3–6) is estimated according to our pre-experiment.12 Humane care was provided to each animal during the experiments according to the criteria outlined in the Guide for the Care and Use of Laboratory Animals published by the National Institutes of Health. Six- to eight-week-old male Sprague-Dawley rats, C57BL/6 N mice, and Caspase-1−/− mice were used in the study. All the protocols were approved by the Peking University Ethical Committee (LA2013-92). The study conforms to the ARRIVE guidelines.
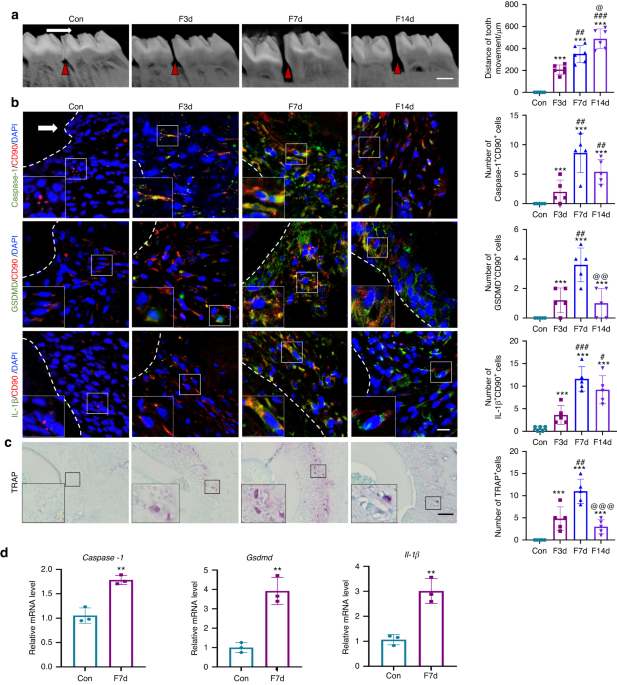
Mechanical force was applied to rats or mice as previously described.26 Briefly, in rats, nickel-titanium coil springs of 0.2 mm in wire size, 1 mm in diameter, and 4 mm in length (Smart Technology) were ligated between the maxillary right first molar and the maxillary incisors to provide 50–60 g force for 3 d, 7 d and 14 d.7,27 The maxillary left first molar without force application served as the control. Five rats were used at each time point. Another 3 rats received force application for 7 d, and the periodontal tissues including the alveolar bone and periodontal ligament of the mesial side of the maxillary first molars were collected for the detection of gene expressions.
In mice, nickel-titanium coil springs with the same size and 1 mm in length were ligated in a similar way to provide 20–30 g force for 7 d.12,28,29 The contralateral first molar served as control. Mice were randomly divided into four groups as follows: (i) Force: force loading and 0.9% NaCl treatment every two days; (ii) Force + PPVI: force loading and pyroptosis activator Polyphyllin VI (PPVI, S9302, Selleck) treatment (5 mg/kg every two days); (iii) Force + MCC950: force loading and pyroptosis inhibitor MCC950 (S7809, Selleck) treatment (20 mg/kg every two days); (iv) Control: the group without force loading and treatment. Drugs were injected intraperitoneally (i.p.).30,31 Each group comprised 5 mice. In addition, force was also applied to the Caspase-1−/− mice for 7d to compare the difference of OTM and alveolar bone remodeling with the wild-type mice (n = 5).
After OTM, the animals were sacrificed and the maxillae were harvested for micro-CT scanning and histological staining. For histological staining, consecutive horizontal sections (4 μm) were obtained from the middle to apical third of each maxillary first molar. The sections from similar position of the roots were used for histological study.
Micro-CT scanning and measurement of orthodontic tooth movement (OTM) distance
The animals were sacrificed by overdose of pentobarbital sodium, and the maxillae were harvested, fixed in 4% paraformaldehyde (PFA), and scanned by micro-CT system (Inveon MMCT, Berlin, Germany) at 80 kV, 500 µA, and an image voxel size of 18 µm. Mimics 13.1 software (Materialise, Leuven, Belgium) was used for 3D image reconstruction and segmentation. The distance of OTM was measured from the occlusal view of the maxillae in 3D images using a modified method described previously.7 Briefly, the distance between the midpoint of the first molar distal-marginal ridge and the midpoint of the second molar mesial-marginal ridge was measured by a trained researcher who was blinded to the group assignment. The average of the three measurements was calculated as the tooth movement distance.
Tartrate-resistant acid phosphatase (TRAP) staining
TRAP staining was utilized to detect the number of osteoclasts using an acid phosphatase kit (387A-1KT; Sigma) according to the manufacturer’s protocol. The number of TRAP-positive multinucleated (>3 nuclei) osteoclasts in five visual fields at 20× magnification in each well was counted. The final results came from the average of 5 independent tests. In histological sections, the number of TRAP-positive multinucleated (>3 nuclei) osteoclasts in five visual fields at 40× magnification in each histological section was counted. The final results came from the average of 5 independent tests.
Immunohistochemical staining, immunofluorescence staining
For immunohistochemical staining, after mice sacrifice, the trimmed maxillae were fixed in 4% PFA for 24 h. After decalcifying in ethylenediaminetetraacetic acid for 4 weeks, the tissues were embedded in paraffin. 4-μm consecutive horizontal sections were obtained from the middle to apical third of the roots, and sections from the similar positions were chosen. Immunohistochemistry was performed with a two-step detection kit (Zhongshan Golden Bridge Biotechnology, Beijing, China) as previously described.7 Primary antibodies included anti-GSDMD (1:200; AF4012, Affinity), anti-Caspase-1 (1:200; AF5418, Affinity), and anti-IL-1β (1:200; AF5103, Affinity). Histological changes in stained tissues were observed using an optical microscope (Olympus, Japan). The positive staining cells were counted in five different slides from each sample.
Immunofluorescence staining was performed as previously described.32 The sections were incubated with primary antibodies including anti-CD90 (1:200; ab225, Abcam), anti-GSDMD (1:200; AF4012, Affinity), anti-Caspase-1 (1:200; AF5418, Affinity), anti-IL-1β (1:200; AF5103, Affinity) to observe the numbers of Caspase-1+CD90+ cells, GSDMD+CD90+ cells, and IL-1β+CD90+ cells in the compression side of the periodontal tissues after force loading; antibodies including anti-TRPV4 (1:200; ab39260, Abcam), anti-GSDMD (1:200; SC-393581, Santa Cruz), anti-Caspase-1 (1:200; SC-392736, Santa Cruz) were used to observe the numbers of Caspase-1+TRPV4+ cells and GSDMD+TRPV4+ cells in the compression side of the periodontal tissues after force loading. Then, sections were incubated with fluorescein isothiocyanate-conjugated or tetramethylrhodamine isothiocyanate-conjugated secondary antibodies (1:200; Zhongshan Golden Bridge Biotechnology, Beijing, China). Nuclei were counterstained with 4′,6-diamidino-2-phenylindole (DAPI, P0131, Beyotime). Confocal images were processed with LSM 5 Release 4.2 software after acquisition by a laser-scanning microscope (LSM510; Zeiss, Germany). The cells double-stained by red and green immunofluorescence were calculated. The positively double-stained cells were counted in five different slides from each sample. The final results came from the average of 5 independent samples.
Human PDL (h-PDL) progenitor cell isolation ex vivo
The volunteers planning to extract four premolars due to orthodontic treatment demands were included. The h-PDL progenitor cells were isolated from the upper premolars of receiving orthodontic force for 7 d (hF7d) representing active force stimulus.33 The h-PDL progenitor cells from the lower premolars without force loading from the same patient served as controls. Six teeth of three patients were isolated in each group (n = 3). The clinical procedures were approved by Peking University Ethical Committee (PKUSSIRB-201311103) and informed consent was signed by the patients. Briefly, the periodontal ligament scraped from the root surface of the premolars with or without force stimuli were digested in a mixture of 3 mg/mL type I collagenase (Worthington Biochem, USA) and 4 mg/mL dispase II (Roche, Germany) for 1 h at 37 °C. The single cell suspensions were obtained and used for cell culture with a-MEM medium (Invitrogen, USA) with 20% fetal bovine serum (Gibco, USA) and 1% Penicillin/Streptomycin (Gibco, USA). When the single cell suspensions adhered to the wall for 3 days, the primary cells were digested and cultivated on the six-well plate for further experiments.
Mechanical loading and treatments on human PDL progenitor cells in vitro
Human PDL progenitor cells were isolated as previously described and were identified following previous protocols,34 which used at passage 4. Compressive force loading was provided by glass layers and 50 mL plastic tube caps containing weighed metal balls as previously described.35,36 1.5 g/cm2 compressive force was applied to PDL progenitor cells for different time points (3–24 h), and different compressive force (0.5–2.0 g/cm2) was applied to PDL progenitor cells for 6 h. In addition, after being subjected to 1.0 g/cm2 and 1.5 g/cm2 compressive force for 6 h, PDL progenitor cells were collected for further experiments of optical microscope (OM, Olympus, Japan), scanning electron microscope (SEM) and transmission electron microscope (TEM).
To confirm the influence of pyroptosis under mechanical stimuli, pyroptosis activator PPVI (4 μmol/L), pyroptosis inhibitor MCC950 (10 μmol/L) and Caspase-1 inhibitor Belnacasan (VX765, 20 μM, S2228, Selleck) were added to PDL progenitor cells for 18 h in advance, then 1.5 g/cm2 force was applied to PDL progenitor cells for 6 h.31,37 In addition, TRPV4 inhibitor GSK219 (10 mmol/L, Selleck) were applied to PDL progenitor cells for 1 h and then stimulated with force loading (1.5 g/cm2, 6 h).17 PDL progenitor cells without force-loaded and drug treatment served as controls.
Co-culture of PBMCs and PDL progenitor cells
H-PBMCs were selected from peripheral blood. The h-PDL progenitor cells of passage 1 (5 × 10³ cells per mL) with or without orthodontic force stimuli were seeded into 24-well plates to co-cultured with h-PBMCs (1 × 10⁶ cells per mL). Macrophage colony-stimulating factor (MCS-F, 30 ng/mL) and soluble receptor activator of nuclear factor–κB ligand (sRANKL, 50 ng/mL) were added to the cultured medium. After co-culturing for 14 days, cells were fixed and stained with an acid phosphatase kit (387A-1KT; Sigma) for tartrate-resistant acid phosphatase (TRAP) staining.
Immunocytofluorescense staining
Immunocytofluorescense staining was performed according to a previously described method.11 Briefly, cells were fixed in 4% paraformaldehyde and permeabilized with 0.1% Triton X-100 at room temperature for 10 min. Next, the cells were incubated with 5% Bovine Serum Albumin (BSA) at room temperature for 1 h, followed by incubation with anti-CD90 (1:200; SC-53456, Santa Cruz), anti-TRPV4 (1:200; ab39260, Abcam), anti-GSDMD (1:200; AF4012, Affinity), anti-Caspase-1 (1:200; AF5418, Affinity), and anti-IL-1β (1:200; AF5103, Affinity) at 4 °C overnight. After thoroughly washed, the cells were then incubated with fluorescein isothiocyanate-conjugated or tetramethylrhodamine isothiocyanate-conjugated secondary antibodies (1:200; Zhongshan Golden Bridge Biotechnology, Beijing, China) in the dark at room temperature for 1 h. Nuclei were counterstained with DAPI (P0131, Beyotime, China). Confocal microscopic images were processed with LSM 5 Release 4.2 software after acquisition by a laser-scanning microscope (LSM510; Zeiss, Germany). The positively stained cells were counted in five different slides from each sample.
Quantitative real-time polymerase chain reaction (PCR)
The rat periodontal tissues included the alveolar bone and periodontal ligament were separated from the mesial side of first molars. Tissues were collected in 1.5 mL EP tube with 1 mL TRizol reagent (Invitrogen, Carlsbad, CA), and smashed for 5 min. Then tissues were centrifuged and the supernatant was collected. For PDL pregenitors in vitro, they were washed by PBS and added TRizol reagent. Total RNA was extracted from cultured cells or periodontal tissues with TRizol reagent (Invitrogen, Carlsbad, CA) following the manufacturer’s protocol. 2 μg of RNA was reverse transcribed into complementary first-strand cDNA using cDNA synthesis kits (Takara Bio, Inc., Otsu, Japan). Then real-time Polymerase Chain Reaction (PCR) was performed using the FastStart Universal SYBR Green master kit (Roche) on an Applied Biosystems 7500 real-time PCR System (Life Technologies Corporation, United States) to determine the relative mRNA expression level. Fold changes of target genes were calculated with ΔCT method using GAPDH or β-actin as a reference control. The sequences of primers were designed by Primer Premier 5.0 software and were listed as follows:
Human:
GAPDH sence/antisence: 5′- TGCCACTCAGAAGACTGTGG-3′/5′- TTCAGCTCTGGGATGACCTT-3′.
NLRP3 sence/antisence:5′-CCACAAGATCGTGAGAAAACCC-3′/5′- CGGTCCTATGTGCTCGTCA-3′
Caspase-1 sence/antisence:5′- CGTTCCATGGGTGAAGGTACA-3′/5′- TGCCCCTTTCGGAATAACGG-3′
GSDMD sence/antisence:5′-GTGTGTCAACCTGTCTATCAAGG-3′/5′- CATGGCATCGTAGAAGTGGAAG-3′
IL-1β sence/antisence:5′- TTCGACACATGGGATAACGAGG-3′/5′- TTTTTGCTGTGAGTCCCGGAG-3′
RANKL sence/antisence:5′- ATCAGAGCAGAGAAAGCGATG-3′/5′-GACTCACTTTATGGGAACCAG-3′
OPG sence/antisence:5′- TTGAAATGGCAGTTGATTCCTTT -3′/5′- TATCCTCTTTCTCAGGGTGCTTG-3′
CTSK sence/antisence:5′-ATCCGGACTGTGACGAGTTG -3′/5′-ATTTGGGAGCAGCTGGGATG-3′
TRAP sence/antisence: 5′-ACTACCAGAAACGAGTGGGAA-3′/5′-GCATCTGTTCTCGGAAAACCT-3′
Rat:
β-actin sence/antisence:5′- TGACAGGATGCAGAAGGAGA-3′/5′- TAGAGCCACCAATCCACACA-3′
Nlrp3 sence/antisence:5′- TCACGTCTTGAAGCCACATCC-3′/5′- GAAGCAAAGTTCCTCCAGACAG-3
Caspase-1:5′- GTGGTTCCCTCAAGTTTTGC-3′/5′-CCGACTCTCCGAGAAAGATG-3′
Gsdmd sence/antisence:5′- CCAACATCTCAGGGCCCCAT-3′/5′-TGGCAAGTTTCTGCCCTGGA-3′
Il-1β sence/antisence:5′- CACCTCTCAAGCAGAGCACAG-3′/5′- GGGTTCCATGGTGAAGTCAAC-3′
Trpv1 sence/antisence:5′-GCCGCTGAACCGACTC-3′/5′-CCCATCTGCTGGAAAC-3′
Trpv2 sence/antisence:5′- CGCCATTGAGAAGAGGAGTC-3′/5′- GCTTACCACATCCCACTGCT-3′
Trpv3 sence/antisence:5′- GCGTGGAGGAGTTGGTAGAG-3′/5′- CTCTGTGTACTCGGCGTTGA-3′
Trpv4 sence/antisence:5′- CAGGTGGGGAGGCTTTT-3′/5′- GCGGCTGCTTCTCTATG-3′
Western blotting
Western blottings were performed as previously described.17 Cells were lysed with RIPA buffer (Thermo Fisher Scientific) and the total proteins were harvested. A Pierce BCA protein assay kit (Thermo Fisher Scientific) was used to perform the protein quantification. Total protein (30 μg) was separated by 10% SDS–polyacrylamide gel and then transferred onto a polyvinylidene difluoride (PVDF) membrane (Millipore). After being blocked in 5% BSA for 1 h at room temperature, the membranes were incubated overnight at 4 °C with primary antibodies including GAPDH (1:5 000, AF7021, Affinity), NLRP3 (1:1 000, PA5-79740, Thermo Fisher), Caspase-1 (1:500, AF5418, Affinity), Cl-Casp-1 (1:300, AF4005, Affinity), GSDMD and N-GSDMD (1:500, AF4012, Affinity), IL-1β (1:500, AF5103, Affinity), Cl-IL-1β (1:300, AF4006, Affinity), RANKL (1:500, AF0313, Affinity), OPG (1:500, DF6824, Affinity), TRPV4 (1:1 000, ab39260, Abcam). The blots were then incubated with a horseradish peroxidase-conjugated secondary antibody (1:5 000; Zhongshan Golden Bridge Biotechnology, Beijing, China). The membranes were washed three times with 0.1% TBS Tween (P9416, Sigma-Aldrich). The bands were detected using enhanced chemiluminescence (34577, Thermo Fisher Scientific), and BioMax film (Kodak, Rochester, New York, USA) was used to detect the immunoreactive proteins. The relative density of at least three independent results was measured by Image J software. All the western blotting results were the average of 3 independent experiments.
Enzyme-linked immunosorbent assay (ELISA)
RANKL and IL-1β concentrations in culture supernatants were detected by ELISA (mlbio, China) following the manufacturer’s instructions. The results were determined by comparing the samples to the standard curve generated by the kit. All samples and standards were assayed in triplicate.
Scanning electron microscopy (SEM) and transmission electron microscopy (TEM)
For SEM, the PDL pregenitor samples were pre-fixed in 2.5% glutaraldehyde in PBS (pH 7.4) at 4 °C for 12 h and washed with PBS three times. The samples were dehydrated in a graded series of ethanol solutions and critical-point dried, and then sputter-coated with gold for 2 min at 20 mA. The PDL pregenitor samples were observed using SEM (Hitachi S-4800, Japan) at 10 kV.
For TEM, PDL pregenitors were harvested, washed three times with PBS, and fixed in 2.5% glutaraldehyde for 2 days at 4 °C. PDL pregenitors were post-fixed in 1% osmium tetroxide for 2 h. After they were dehydrated using a graded series of ethanol solutions, the samples were embedded in Embed-812 resin and cut into ultrathin sections (70 nm thick). The ultrathin sections were installed on a copper wire and stained with dioxyuranium acetate and lead citrate. These sections were examined with TEM (JEM-100CX, Japan) at 100 kV.
Ca2+ influx measurement
The calcium-regulated fluorescent intracellular calcium indicator, Fluo-4 acetoxymethyl ester form (Fluo-4 AM, F8500, Solarbio, China) was used to monitor real-time elevations of intracellular calcium following force stimuli and the inhibition of TRPV4, according to the manufacturer’s instructions. Briefly, PDL pregenitors of different groups (Control, Force, Force+GSK219) were loaded with 4 × 10⁻⁴ mol/L Fluo-4 AM fluorescent dye diluted 1/200 in Ca2+ free Hank’s buffered salt solution (HBSS) for 60 min at room temperature. After this period, cells were washed two times with HBSS and further incubated with 300 µL of HBSS for 60 min. Cells were stained with Hoechst 33342 (C1027, Beyotime, China) in the dark for 20 min. Then, Fluo-4 AM positive cells were photographed by confocal microscopy (LSM510; Zeiss, Germany), and the images were processed using LSM 5 Release 4.2 software.
Measurement of intracellular reactive oxygen species (ROS)
The content of intracellular ROS was detected by the H2DCF-DA fluorescence probe (Beyotime, China) according to the manufacturer’s instructions. After that PDL pregenitors of different groups (Control, Force, Force+GSK219) were incubated with 10 mM DCFH-DA for 20 min at 37 °C in the dark, PDL pregenitors were washed twice with serum-free medium and resuspended with a-MEM medium including Hoechst 33342 (C1027, Beyotime, China). The intracellular ROS was assessed at 488/525 nm using fluorescent microscopy (Leica, Germany) and analyzed by Image-Pro Plus 6.0 software (Media Cybernetics, MD, USA).
Mitochondrial morphology detection and mitochondrial membrane potential (Δψm)
Mitochondrial morphology was detected by Mito-tracker dyes. Mitochondria were labeled with the MitoTracker Red (C1049B, Beyotime, China) for 30 min in the dark. The mitochondrial morphology was photographed by a confocal microscope (LSM510; Zeiss, Germany).
The Δψm was analyzed using the fluorescent probe JC-1 assay kit (C2003S, Beyotime, China) according to the manufacturer’s instructions. JC-1 exhibits red fluorescence aggregates in the mitochondrial matrix in normal cells. When the Δψm is reduced, monomeric JC-1 displays green fluorescence. Therefore, the rate of green/red fluorescence was used to represent the Δψm in each cell sample. PDL pregenitors of different groups (Control, Force, and Force + GSK219) were cultured on the coverslips in 12-well plates and loaded with JC-1 (1:400 dilution) at 37 °C for 20 min. The images were observed and captured under a fluorescence microscope (Leica, Germany).
Adenosine triphosphate (ATP) Assay
ATP levels were measured using the ATP bioluminescence detection kit (S0026, Beyotime, China). Briefly, PDL pregenitors were lysed with a lysis buffer supplied with the kit and centrifuged at 12 000 × g for 5 min at 4 °C. The supernatant was collected for ATP detection. The protein concentration of the supernatant was measured using the BCA Protein Assay Kit (P0012S, Beyotime, China). Furthermore, 100 µL supernatant with 100 µL ATP detection buffer was measured using a microplate reader (EnSpire, USA). The standard solution was diluted in gradient to obtain the standard curve (1 nmol/L-1 µmol/L). Then, ATP levels were calculated according to standard curves and normalized according to standard protein concentrations.
Statistical analysis
Statistical analysis was performed with GraphPad Prism 9.0 software. Data were presented as mean ± standard deviation (SD). Statistical differences between two groups were assessed by a two-tailed independent Student’s t test, and statistical differences among three and more groups were assessed by one-way analysis of variance (ANOVA). Tukey’s multiple-comparison test was used for the post hoc comparison of ANOVA. A p-value less than 0.05 represented statistically significant.
- SEO Powered Content & PR Distribution. Get Amplified Today.
- PlatoData.Network Vertical Generative Ai. Empower Yourself. Access Here.
- PlatoAiStream. Web3 Intelligence. Knowledge Amplified. Access Here.
- PlatoESG. Carbon, CleanTech, Energy, Environment, Solar, Waste Management. Access Here.
- PlatoHealth. Biotech and Clinical Trials Intelligence. Access Here.
- Source: https://www.nature.com/articles/s41368-023-00268-7