Fibrinogen isolation
Fresh frozen plasma concentrates (FFP) unsuitable for clinical use were obtained from the blood bank at Hannover Medical School. Frozen plasma was thawed at room temperature and centrifuged at 800 × g for 12 min. The supernatant was discarded and the hydrous protein pellet was solubilized at 37 °C.
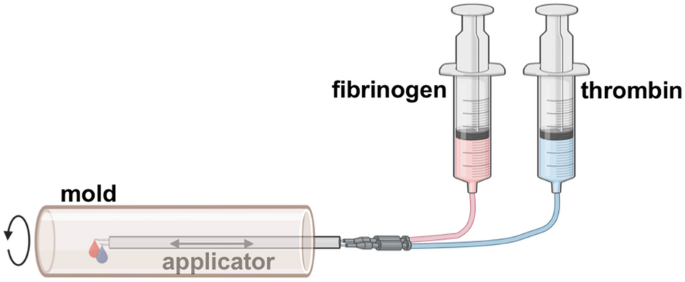
Fibrin tube production
Initially, fibrin tubes were fabricated in a machine established by Aper et al.23 with a few modifications. A schematic of the process is depicted in Fig. 1. In brief, a rotating mold was driven by an electric motor. The apparatus consisted of an outer brass tube with 10 pairs of drill holes (diameter 0.3 mm, distance 1 cm) allowing the drainage of excess fluid, and two removable polyetheretherketone (PEEK) half shells inside. The cylindric mold was closed on both sides with PEEK stoppers with the front stopper provided with a hole enabling the insertion of an applicator. The applicator was driven by an electric motor enabling the movement in the mold along the axis. Two cannulas connected via drip lines to syringes driven by injectomats were inserted into the applicator. Thrombin and fibrinogen solutions were applied through these cannulas at a defined flow rate into the mold while the applicator was moved along the axis. As this apparatus allowed only a limited diameter for the tube and had limited control over movement speed and other parameters, a more sophisticated machine was built enabling the fabrication of fibrin tubes up to 34 mm in diameter (Fig. 6). Fully automated control over application speed off the solutions, movement of the applicator, and rotation speed was implemented allowing the execution of complex fabrication protocols.
For the fabrication of fibrin tubes two solutions were prepared independently. Commercially available human fibrinogen (Merck) and commercially available human thrombin (Merck) were solubilized in 0.9% NaCl. CaCl2 solution was added to the thrombin solution. Application of equal volumes of the two solutions resulted in final concentrations of 30 mg/mL fibrinogen, 15 U/mL thrombin, and 40 mM CaCl2. Process parameters for the old machine were the following: centrifugal force of 72–162 × g (strong variation due to the properties of the motor), application speed for both solutions of 1.25 mL/min, and applicator speed of 1 mm/s. A volume of 3 mL for each solution was applied. Process parameters for the new device were the following: centrifugal force of 125 × g, application speed for both solutions of 1 mL/min, and applicator speed of 1.33 mm/s. A total volume of 4.5 mL was applied for the fabrication of a cell-free sheath and a total volume of 3.5 mL was used for cell application.
Nanoindentation
Pieces from the fabricated fibrin tubes were glued to a glass bottom dish, incubated for 30 min in PBS, and subjected to nanoindentation with PIUMA nanoindenter (Optics11, Amsterdam, The Netherlands) employing a 0.29 N/m cantilever-based probe with a tip radius of 49 µm. Measurements were done at room temperature. Per sample, 100 indentations were performed in a grid of 1 × 1 mm with a distance of 100 µm between individual indentations. The displacement profile is set to displace 20 µm from the automated near-surface definition. The data in the loading section of the load–displacement curve was used to determine the Young’s Modulus using a fit of all data points from the contact point to 7 µm indentation depth respecting the Hertz model assumption of a parabolic indenter (max. depth for calculation equals to 16% of tip radius). Two to three pieces per tube were analyzed.
Cardiac differentiation
Single hiPSC were seeded in E8 medium supplemented with 10 µM Y27632 and Pluronic F-68 at 0.1% in single-use 500 ml Spinner Flasks (Corning) placed on a Cimarec spinner platform (Thermo Fisher, 60 rpm). Subsequently, 48 h after inoculation the medium was replaced with CDM3 medium (Burridge et al., 2014; RPMI1640; 2 mM glutamine; 495 µg/ml human recombinant albumin (ScienCell, SC-OsrHSA); 213 µg/ml ascorbic acid (Sigma-Aldrich)) supplemented with 5 µM CHIR. After 24 h, medium was replaced by CDM3 supplemented with 5 µM IWP2. After 48 h, medium was replaced with CDM3 and was exchanged every 2–3 days. Cardiac differentiation > 90% was confirmed by FACS analysis for cardiac troponin T, myosin heavy chain, and sarcomeric α-actinin as previously described26,27. Cells at days 20–25 of differentiation were dissociated with STEMCELL technologies cardiomyocyte dissociation kit for 3–10 min at 37 °C as previously described27. Cells were automatically counted (Vi-Cell XR, Beckman Coulter) and distributed equally in fibrinogen and thrombin solution according to the number of viable cells.
Fibroblast cultivation
Human foreskin fibroblast (hFF, SCRC-104, ATCC) were cultivated in DMEM (21969-035, Gibco) containing 2 mM L-glutamine, 10% FBS (10270106, Gibco) and MEM solution of non-essential amino acids (11140050, Gibco). Cells were released from plates by trypsin, automatically counted (Vi-Cell XR, Beckman Coulter), and equally distributed between fibrinogen and thrombin solution according to the number of viable cells.
Cultivation of fibrin tubes
Fibrin tubes were either cultivated in bioartificial cardiac tissue medium (BCTM) composed of high glucose DMEM (Gibco#21969), horse serum (HS, Gibco#16050122, content according to the experimental setting), 2 mM L-glutamine, 100 U/mL penicillin, 100 µg/mL streptomycin, 10 µg/mL human insulin, 60 µM ascorbic acid (Merck), and 200 KIU/mL Aprotinin (Loxo) or in serum-free medium (SFM) composed of M199 as basal medium supplemented with 10 ng/mL VEGF-A, 10 ng/mL FGF-2, 0.1% ITS, 2 mM L-glutamine, 1% BSA, 50 µg/mL ascorbic acid, 0.2 µg/mL hydrocortisone, 0.1 mg/mL gentamicin, 100 U/mL penicillin, 100 µg/mL streptomycin, 200 KIU/mL aprotinin (Loxo), and horse serum (HS, content according to the experimental setting). For the first 24 h of cultivation the medium was supplemented with 5 µM CHIR. Medium was exchanged ever 2–3 days. In the bioreactor setting, medium was changed every 5–7 days.
Tetramethylrhodamine, methyl ester (TMRM) staining
TMRM (T668, ThermoFisher Scientific) was added at a concentration of 50 nM to the cultivation medium for visualization of living cells in the constructs.
Histology
Immunofluorescence staining was performed according to standard protocols and is described below. Fibrin rings or tubes were fixed with 4% paraformaldehyde in PBS at room temperature for 20 min followed by 3 washing steps using PBS. For cryosection preparation specimens were transferred into optimal cutting temperature compound (OCT) and left for 24 h at 4 °C. The OCT-embedded constructs were frozen in liquid nitrogen and stored at − 80 °C. The frozen constructs were mounted on a cryostat and 5 µm cryosections were prepared and transferred onto superfrost glass slides. The cryosections were dried at RT for 2 h before storage at -80 °C. Specimens were permeabilized with 0.25% Triton X-100 for 1 h at room temperature. Blocking was performed with 2% donkey serum in PBS for 20 min at room temperature followed by overnight incubation with primary antibodies: anti-vimentin antibody (ab92547, abcam, 1:500), anti-α-actinin (sarcomeric) antibody (A7811, Sigma-Aldrich, 1:800), and anti-collagen type I (C2456, Sigma-Aldrich, 1:500) at 4 °C. On the next day, sections were washed three times with PBS and incubated with Cy3 conjugated donkey anti-goat antibody (705-165-147, Jackson ImmunoResearch, 1:300), and Alexa Fluor 488 conjugated donkey anti-mouse antibody (715-545-151, Jackson ImmunoResearch, 1:300) for 30 min at room temperature. Samples were washed again three times with PBS. Nuclei were counterstained with 4′,6-diamidino-2-phenylindole (DAPI) (1 μg/mL in PBS) for 15 min at room temperature. After additional washing steps with PBS, sections were covered with fluorescent mounting medium and glass coverslips. Stained samples were analyzed with the Axio Observer A1 microscope and the Zeiss Observer Z1 microscope. For better visualization of the sarcomeric α-actinin signal the unsharp tool in AxioVision SE64 Rel. 4.9 was used with preset standard values.
Image analysis for cell density
Images taken from TMRM stained or RedStar expressing living tissues and sections stained for DAPI were analysed with ImageJ. Images were transformed in 8bit images and the local threshold (Bernsen) was adjusted. Resulting images were converted into binary images and objects were separated with the watershed function. Four regions of interest (ROI) with the same area were randomly chosen and the particle content was counted.
Measurement of cross sectional area
Living tissues were observed using the Stereo Microscope Discovery V8. (Zeiss). Brightfield pictures of rings cut form static cast tubes were taken and the cross sectional area of the rings was measured in AxioVision SE64 Rel. 4.9 and expressed as percentage of the day 1 value. Three independent experiments were analyzed.
Analysis of GFP signal intensity over time
Videos of the GFP signal were captured at 60 frames per second using the Stereo Microscope Discovery V8. (Zeiss). Videos were imported into ImageJ. The Plugin “Time series analyzer” was employed to retrieve the average intensity value for 4 randomly chosen regions of interest (ROI) over time. GraphPad Prism was used to transform the data into relative fluorescence values and plot the retrieved values over time.
Pacing
Platinum wires connected to a custom-made pacing device developed in collaboration with the MHH Research Workshop were submerged in the culture medium. Biphasic pulses of 25 V were elicited at a frequency of 2 Hz and the presence of current was verified by a custom-made software (MHH Research Workshop). Videos of TMRM stained fibrin tubes (spontaneously contracting and paced) were taken at 5 frames per second with AxioObserver Z1 (Zeiss). Retrieved videos were imported into ImageJ and analyzed with MYOCYTER macro44.
Documentation
Living tissues were observed using the Stereo Microscope Discovery V8. (Zeiss).
Statistical analyses
Statistical analyses was performed with Prism. A one-way ANOVA test with Bonferroni’s Multiple Comparison post-test was used to analyze the differences between groups (Fig. 1e,d; Fig. 2e, Fig. 4j). An unpaired t-test was used for analyes of data depicted in Fig. 3K. For experiments depicted in Fig. 5 a repeated measures ANOVA with Dunnett’s Multiple Comparison post-test was used to analyze the differences compared to day 1. A p-value < 0.05 was considered statistically significant. Mean values with SD are reported.
- SEO Powered Content & PR Distribution. Get Amplified Today.
- PlatoData.Network Vertical Generative Ai. Empower Yourself. Access Here.
- PlatoAiStream. Web3 Intelligence. Knowledge Amplified. Access Here.
- PlatoESG. Carbon, CleanTech, Energy, Environment, Solar, Waste Management. Access Here.
- PlatoHealth. Biotech and Clinical Trials Intelligence. Access Here.
- Source: https://www.nature.com/articles/s41598-024-64022-7