Data collection and processing
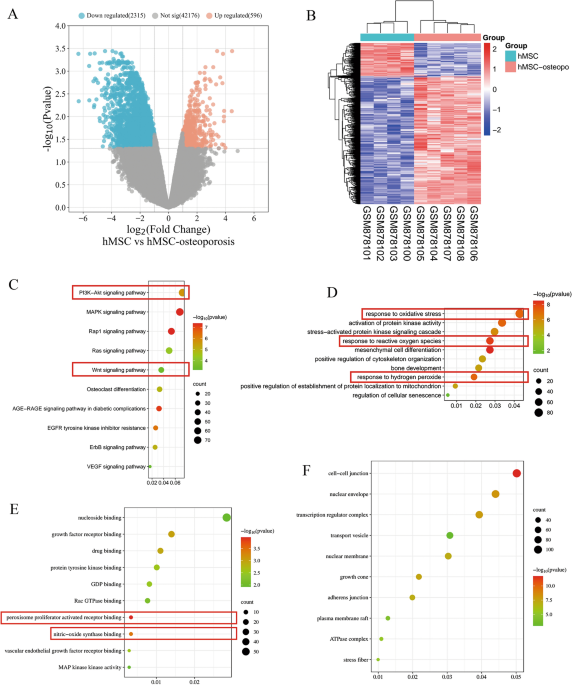
Using the Gene Expression Omnibus (GEO) database (https://www.ncbi.nlm.nih.gov/GEO/) with the keyword ‘osteoporosis’ for retrieval, we downloaded the GSE3595839 dataset for OP and non-OP samples. Using a standardized GEO2R gene microarray (http://www.ncbi.nlm.nih.Gov/geo/geo2r), we compared the DEGs between both samples and defined those that had a |logFC (fold change)|> 1 and false discovery rate − log10(P value) < 1.3 (FDR < 0.05) as OP-related DEGs. The data were visualized using R 4.3.2’s ggplot2 3.5.0 and pheatmap 1.0.12 packages (R Core Team, Austria).
Enrichment analysis of DEGs
The General Database for Annotation, Visualisation, and Integrated Discovery40 (DAVID; https://david.ncifcrf.gov) was used for Gene Ontology (GO) and Kyoto Encyclopaedia of Genes and Genomes41 (KEGG) functional enrichment analysis. The GO analysis consisted of three components: biological process (BP), molecular function (MF), and cellular component (CC). The data were visualised using the ggplot2 3.5.0 package. P-values < 0.05 were considered statistically significant.
Screening of Nar core targets
“Naringin” was used as a keyword in PubChem (https://pubchem.ncbi.nlm.nih.gov/) to retrieve the Simplified Molecular Input Line Entry System (SMILES) chemical formula. Then, using this formula, we screened the TargetNet database (http://targetnet.scbdd.com/home/index/) and only included models with an area under the curve (AUC) cut-off value of 0.7. The potential targets of Nar were identified using extended-connectivity (ECFP4) fingerprint retrieval, and a protein–protein interaction (PPI) network was drawn using the Search Tool for the Retrieval of Interacting Genes/Proteins (STRING) database. The degree value of each node in the PPI network was sorted using Cytoscape_v3.10.0-SNAPSHOT42 (Cytoscape Team, USA). The top 10 targets with the highest scores were selected and defined as the core targets.
Screening of the potential OP-associated drug targets
OP-related proteins were searched in Comparative Toxicogenomics Database (CTD), DisGeNET, and GeneCards using “osteoporosis” as the keyword. The core target intersection was determined using an online Venn diagram tool (http://bioinformatics.psb.ugent.be/webtools/Venn/), and the potential Nar action targets associated with OP were obtained.
Molecular docking
Oestrogen receptor 1 (ESR1) and heat shock protein 90 alpha family class A member 1 (HSP90AA1) proteins obtained from the Protein Data Bank (PDB) (https://www.rcsb.org/) were pre-treated for structural optimization using molecular operating environment software (MOE; Chemical Computing Group, Canada) and the sitefinder function was used to identify the binding pockets For molecular docking, the receptor was set as ESR1 or HSP90AA1, site as site 1, and the ligand as Nar. The results of the analysis were visualized using PyMOL 2.6.0 software43 (Schrödinger, Inc., USA).
Cell culture
Resuscitated MC3T3-E1 cells (EK-Bioscience, China) were cultured in minimum essential medium alpha (α-MEM; Shanghai BasalMedia Technologies Co., Ltd., China) medium containing 10% fetal bovine serum (Nanjing SenBeiJia Biological Technology Co., Ltd., China) and 1% penicillin–streptomycin solution (Nanjing SenBeiJia Biological Technology Co., Ltd., China) at 37℃ in a 5% CO2 incubator (Sanyo, Japan). After the cells reached 80%–90% confluency, they were treated with 0.25% trypsin/0.02% ethylenediaminetetraacetic acid solution (Sigma, USA) and re-plated at a dilution of 1:3.
CCK-8 assay
MC3T3-E1 cells in the logarithmic growth phase were seeded in 96-well plates with 1 × 10⁴ cells/well and cultured for 24 h. Cells were treated with a low-serum medium containing various Nar concentrations (Sigma, USA) or H2O2 (Sigma, USA) for 24 h or with Nar following 24 h of H2O2 treatment for 24, 48, and 72 h. Cell counting kit-8 (CCK-8) reagent (Meilun Biological, China) was added to the cells and incubated for 2 h. Absorbances were measured at 450 nm using a microplate reader (Molecular Devices, USA). Cell survival rate was calculated using the optical density (OD) values as follows:
$$begin{gathered} left[ {left( {OD; value; of; experimental; wells} right.} right. hfill – left. {OD; value; of; blank; wells} right)/left( {OD; value; of; control; wells} right. hfill – left. {left. {OD; value ;of ;blank; wells} right)} right] times 100% . hfill end{gathered}$$
Cytotoxicity assay
MC3T3-E1 cells were subjected to 0.3 mM H2O2 and 0.1 µM Nar for 24 h to detect lactate dehydrogenase (LDH) (Elabscience, China) production. The MC3T3-E1 cells were seeded in 96-well plates and cultured for 24 h. Cells were treated according to the following groups: control, induction, H2O2, Nar, and H2O2 + Nar. Then, 10 μL of lysate was added to the control well with maximum enzyme activity, and the cells were cultured for another 1 h after blowing and mixing. After centrifugation at 400 × g for 5 min, 50 μL of supernatant to be measured and 50 μL of reaction working solution was added to each well, and the microplate was shaken. After incubating at 37 °C for 10 min, the reaction termination solution was added, and the absorbance was measured at 450 nm using a microplate reader. Cytotoxicity was calculated as follows:
$$begin{gathered} left[ {left( {D; value; of; sample; test; well} right.} right. hfill – left. {OD; value; of; sample; control; well} right) hfill /left( {OD; value; of; maximum; enzyme; activity; control; well;} right. hfill – left. {left. {OD; value; of; sample; control; well} right)} right] times 100% hfill end{gathered}$$
ROS assay
After cleaning with phosphate-buffered saline (PBS), a 2′-7’dichlorofluorescin diacetate (DCFH-DA) (Applygen Technologies, China) probe diluted with α-MEM (final concentration of 10 μM) was added to the MC3T3-E1 cells in 6-well plates and incubated at 37 °C for 30 min in the dark. During this period, the probe was gently shaken every 5 min to ensure full contact with the cells. The cells were washed three times and then re-suspended with α-MEM. ROS levels were recorded under a fluorescence microscope within 30 min at 525 nm to determine the establishment of the oxidative stress model. Fluorescence staining used ImageJ 13.0.6 software44 to detect fluorescence brightness as ROS expression. The cell suspension was detected by fluorescent enzyme, the absorbance was measured at 520 nm, and the results were expressed by fluorescence value.
Nitric oxide assay
Dilute the standard in the kit to 800, 400, 200, 100, 50, 25, 12.5, 6.25, 3.13, 1.57 μM, the OD values of each group were detected by microplate reader, and the concentration calculation formula was obtained by making a standard curve. In 96-well plate, 50 μL control(10%FBS-α-MEM) and 50 μL Griess reagent were added and incubated at room temperature in the dark for 5 min. Then, the absorbance was detected using at 540 nm. A standard curve was drawn, the OD values of the sample group were substituted into the formula to calculate the NO expression in the group, and the concentration of NO was calculated to confirm the establishment of the oxidative stress model.
Alkaline phosphatase staining
Osteogenesis was induced in the MC3T3-E1 cells seeded in 6-well plates according to the different groups. Cell culture was performed with α-MEM in the control group, with basic osteogenic differentiation medium (α-MEM, 10% FBS, 50 μg/mL ascorbic acid, and 10 mM sodium β-glycerophosphate) in the induction group, and in the hydrogen peroxide group, basic osteogenic differentiation medium was added after 24 h of H2O2 action. For the Nar group, we added Nar to the basal osteogenic differentiation medium, while for the H2O2 + Nar group, we added the above Nar-containing osteogenic differentiation medium after 24 h of H2O2 action. and stained using the BCIP/NBT alkaline phosphatase chromogenic kit (Beyotime, China). After 2 weeks, the medium was removed, and the cells were washed three times with PBS for 3–5 min each, fixed with 4% paraformaldehyde for 15 min, and washed a further three times with PBS. Then, 1 mL of the staining working solution was added to each well and incubated at room temperature for 20 min in the dark. After removing the working solution, the staining solution was washed three times with double distilled H2O and imaged under an inverted microscope.
Alizarin red S staining
Osteogenesis was induced in the MC3T3-E1 cells seeded in 6-well plates according to different groups and then stained with the osteoblast mineralized nodule staining kit (Beyotime, China). After 21 days, the medium was discarded, and the cell surface was lightly washed three times with PBS for 3–5 min each, fixed with 4% paraformaldehyde for 15 min, and washed a further three times with double distilled H2O. Alizarin Red S staining working solution (1 mL) was added to each well and the cells were stained for 30 min. After discarding the solution, the cells were washed three times with ddH2O and imaged under an inverted microscope.
Alkaline phosphatase activity assay
Osteogenesis was induced in MC3T3-E1 cells in 6-well plates for 5, 7, and 9 days, according to different groups. The cells were harvested and lysed, and the remaining supernatant was collected. The alkaline phosphatase (ALP) detection kit (Beyotime, China) was used following the manufacturer’s instructions. Absorbances were measured at 405 nm, and the activity of ALP was calculated (Table S1).
Western blot
Osteogenesis was induced in the MC3T3-E1 cells for 14 days, and they were treated according to different groups. Total protein was extracted using radioimmunoprecipitation assay lysis buffer (Beyotime, China), quantified using the bicinchoninic acid method (Applygen Technologies Inc., China), and denatured by boiling after adding loading buffer. Whole-cell protein extracts were separated by sodium dodecyl sulphate–polyacrylamide gel electrophoresis and analyzed using Western blot (WB). The amount of protein was loaded with 10 μg/well. The PVDF membranes (0.22 μm) were then blocked with 5% BSA for 2 h. The following primary antibodies were prepared at 1:1000 after washing the membrane and incubated overnight at 4 °C: anti-GAPDH (Affinity, USA), anti-PI3K (Affinity, China), anti-p-PI3K (Affinity, China), anti-Akt (Affinity, China), anti-p-Akt (Affinity, China), anti-GSK-3β (Affinity, China), anti-p-GSK-3β (Affinity, China), anti-LRP-5 (Abcam, China), anti-β-catenin (Cell Signalling Technology, USA), anti-Runx2 (Affinity, China), and anti-OPN (Beyotime, China). The membranes were then washed three times with PBS-Tween, incubated with a secondary antibody for 2 h at room temperature, and washed three more times. Enhanced chemiluminescence solution (Applygen Technologies, China) was then applied, and the relative image intensity was calculated using ImageJ software (Table S1).
Statistical analysis
Data are expressed as the mean ± standard deviation. All statistical analyses were performed using SPSS 25.0 (IBM Corp., USA) and GraphPad Prism 8.0 (GraphPad Software, Inc., USA). The independent sample t-test was used for comparison between two groups. A one-way analysis of variance (ANOVA) followed by Tukey’s post-hoc test was used to compare multiple groups. P-values < 0.05 were considered statistically significant.
Ethics approval and consent to participate
The data for the bioinformatics analyses in this study were obtained from online databases, and the cell lines were purchased by the company, so no ethical approvals were involved.
- SEO Powered Content & PR Distribution. Get Amplified Today.
- PlatoData.Network Vertical Generative Ai. Empower Yourself. Access Here.
- PlatoAiStream. Web3 Intelligence. Knowledge Amplified. Access Here.
- PlatoESG. Carbon, CleanTech, Energy, Environment, Solar, Waste Management. Access Here.
- PlatoHealth. Biotech and Clinical Trials Intelligence. Access Here.
- Source: https://www.nature.com/articles/s41598-024-64952-2