In this section, we first introduce the model of the epigenetic OCT4 gene regulatory network developed in this paper. We then provide detailed explanations of the results obtained from our computational analysis. Specifically, we first studied how DNA methylation affects the dynamics of cellular differentiation, which we captured in our model by the progressive inactivation of the OCT4 gene starting from a high OCT4 level, corresponding to the pluripotent state49,50. We then compared different reprogramming approaches by studying the impact of overexpressing OCT4 alone and in combination with TET1 and JMJD2 on the dynamics of OCT4 gene reactivation. Specifically, we examined process efficiency and latency variability for each approach, as these metrics have been commonly employed in published experimental studies to assess the success of cellular reprogramming21,22,23,24,31. To this end, we performed a computational study of the temporal trajectories of the system by simulating the reactions associated with the Epi OCT4 GRN (Fig. 2) with Gillespie’s Stochastic Simulation Algorithm (SSA)43.
Model of the epigenetic OCT4 gene regulatory network
Our model includes one TF gene, OCT4, and two chromatin modifier genes, TET1 and JMJD2. We consider OCT4 as the only TF in our model because it has been shown that overexpression of OCT4 alone leads to reprogramming15,19,35,36,37. The chromatin modifiers JMJD2 and TET1 are enzymes that catalyze the erasure of histone modification H3K9me3 and DNA methylation, respectively26,38,39,40,41,42, two chromatin modifications associated with compacted chromatin state and gene silencing51. Specifically, while JMJD2 directly erases H3K9me326,38,39,40, TET1 recognizes CpGme dinucleotides and converts methylated CpG to carboxylcytosine through multiple intermediate forms41,42, none of which is recognized by DNMT1, the enzyme responsible for copying the CpGme pattern on the nascent DNA strand during DNA replication51. Transcription factor OCT4 recruits writers of H3K4me3 to its own gene52 and to the JMJD253 and TET154 genes. This leads to a model in which OCT4 self-activates and also activates TET1 and JMJD2 by recruiting writers of activating chromatin modifications, while TET1 and JMJD2 self-activate and mutually activate each other and OCT4 by erasing repressive chromatin modifications. We call this system the epigenetic OCT4 gene regulatory network (Epi OCT4 GRN).
The chromatin modifiers TET1 and JMJD2 act on the chromatin modification circuit within each gene, which has been developed in ref. 44. This circuit includes H3K9 methylation (H3K9me3), DNA methylation (CpGme), H3K4 methylation/acetylation (H3K4me3/ac), and their known interactions. The first two modifications are associated with a repressed gene state51, while H3K4me3/ac is associated with an active gene state26,55.
We next describe the chromatin modification circuit and the model of gene expression (see ref. 44 for details). In terms of species, in this model we have D (nucleosome with DNA wrapped around it), DA (nucleosome with H3K4me3/ac), ({{{{rm{D}}}}}_{2}^{{{{rm{R}}}}}) (nucleosome with H3K9me3), ({{{{rm{D}}}}}_{1}^{{{{rm{R}}}}}) (nucleosome with CpGme), and ({{{{rm{D}}}}}_{{{{rm{12}}}}}^{{{{rm{R}}}}}) (nucleosome with both H3K9me3 and CpGme) (Fig. 1a). Then, the expression rate of each gene will be determined by the number of nucleosomes with activating (DA) or repressive (({{{{rm{D}}}}}_{1}^{{{{rm{R}}}}},{{{{rm{D}}}}}_{2}^{{{{rm{R}}}}},{{{{rm{D}}}}}_{12}^{{{{rm{R}}}}})) chromatin modifications. In terms of molecular interactions, both histone modifications and DNA methylation can be de novo established (process encapsulated in reactions ⓪, ①, and ⑧). Then, histone modifications can enhance the establishment of marks of the same kind to nearby nucleosomes via a read-write mechanism, generating auto-catalytic reactions (encapsulated in ②, ③). Analogously, repressive histone modifications enhance the establishment of DNA methylation, and vice versa, generating cross-catalytic reactions (encapsulated in ⑮, ⑯). Finally, each modification can be passively removed through dilution, due to DNA replication (reactions ④, ⑤, and ⑨), or through the action of eraser enzymes (basal erasure) (reactions ⑥, ⑦, and ⑩). These erasers can be also recruited by the opposite modifications (recruited erasure), that is, repressive modifications recruit activating modification’s erasers and vice versa (reactions ⑪, ⑫, ⑬, and ⑭). In this model, the rate of the processes described above for H3K9me3 (DNA methylation) is assumed not to change if the other repressive mark is present on the same nucleosome. All the reactions described above are collected in the list of Fig. 1b, in which the reactions involving TET1 and JMJD2 are shaded in yellow and pink respectively. A diagram of the chromatin modification circuit corresponding to the reactions in Fig. 1b is provided in Fig. 1c. In this system, the transcriptional self-activation is modeled as a Hill function with cooperativity 1. Specifically, ({k}_{W}^{A}) (Fig. 1b) is a monotonically increasing function of the abundance of X (X), which can be written as ({k}_{W}^{A}={tilde{k}}_{W}^{A}(X/{K}_{A})/(1+(X/{K}_{A}))), in which ({tilde{k}}_{W}^{A}) is a coefficient that does not depend on X, and KA is the dissociation constant of the binding reaction between X and DNA44.
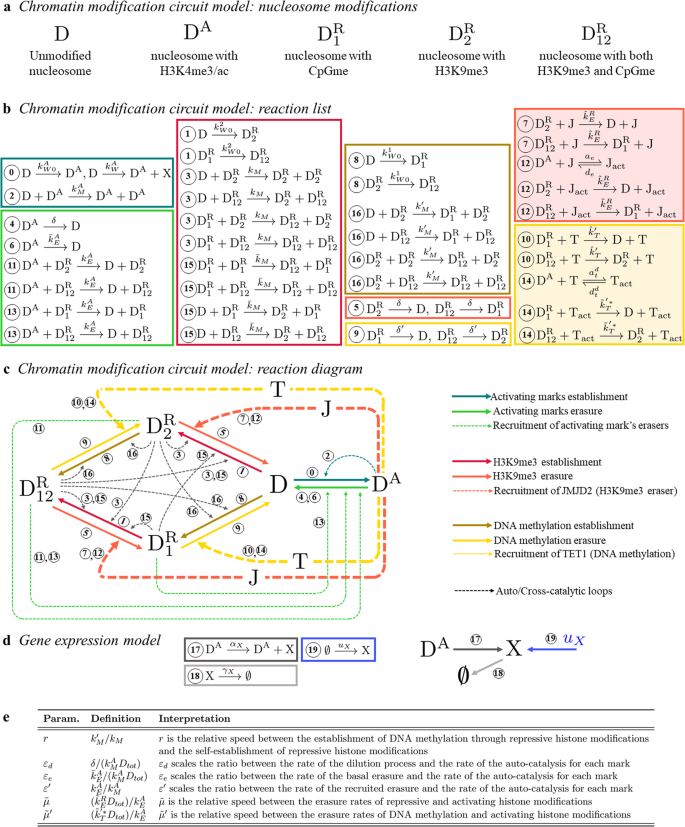
a Nucleosome modifications considered in the model. b Reactions associated with the chromatin modification circuit of each gene X, with X = O (OCT4), T (TET1), J (JMJD2). Here, reactions associated with activating marks, H3K9me3 and DNA methylation are enclosed in green boxes, pink boxes, and yellow boxes, respectively. Dark shades are associated with reactions describing the establishment of the modifications and light shades are associated with reactions describing the erasure of the modifications. Furthermore, shaded boxes enclose reactions involving J (pink) and T (yellow). Finally, each reaction rate constant is subscripted with W, M, or E to indicate the association of its corresponding reaction with the writing (establishment), maintenance (auto/cross-catalytic reactions), or erasure of a chromatin modification. c Diagram representing the chromatin modification circuit for each gene X. d Reactions associated with the gene expression model. Specifically, reactions associated with production (dark gray), dilution/degradation (light gray), and artificial overexpression ux (blue) of the gene product X. The reactions are described in the “Model of the epigenetic OCT4 gene regulatory network” subsection. e Definitions and interpretations of r, εd, εe, ({varepsilon }^{{prime} }), (tilde{mu }), and ({tilde{mu }}^{{prime} }).
In our model, transcription is allowed only by DA, and transcription and translation are lumped together (reaction ⑰). The transcription by D is considered negligible because it is assumed that transcription of D by RNA polymerase II occurs concurrently with H3K4me3 deposition (i.e., conversion of D to DA), as observed in ref. 56. Furthermore, the gene product X is subject to dilution due to cell division and degradation (reaction ⑱). Finally, the production of X can be artificially increased through overexpression (reaction ⑲). A diagram representing these reactions is shown in Fig. 1d. Then, based on the interactions among OCT4, TET1, and JMJD2, we can wire the three chromatin modification circuits to obtain the Epi OCT4 GRN circuit that we analyze in this paper (Fig. 2). In the single gene’s chromatin modification circuit proposed in ref. 44 the concentrations of TET1 and JMJD2 impact the rate constants as they do here. However, these concentrations are constant parameters themselves. By contrast, in the Epi OCT4 GRN introduced here the concentrations of TET1 and JMJD2 are state variables and, as such, they vary dynamically under the effect of each other concentrations and the concentration of OCT4.
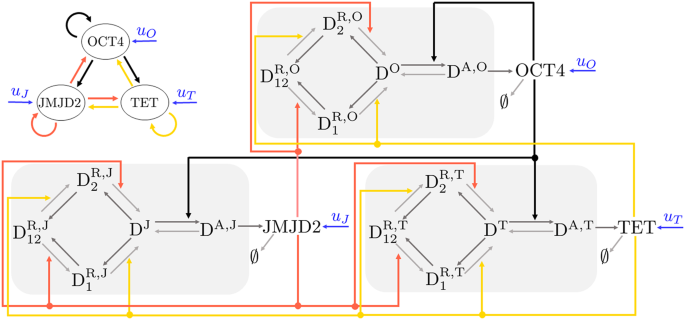
Diagram of the Epi OCT4 GRN, in which OCT4 self-activates and also activates TET1 and JMJD2 by recruiting writers of activating chromatin modifications on all genes (black arrows), while TET1 and JMJD2 self-activate and mutually activate each other and OCT4 by recruiting erasers for repressive chromatin modifications on all genes (pink and yellow arrows, respectively). For simplicity of illustration, in each gene’s chromatin modification circuit we used gray for the solid arrows indicating the establishment and erasure and we did not represent the dashed arrows indicating recruitment and catalysis.
Let Dtot = Dtot/Ω, in which Dtot represents the total number of modifiable nucleosomes within the gene of interest and Ω represents the reaction volume, and the normalized time (tau =t{k}_{M}^{A}{D}_{tot}). Let us define the dimensionless parameters (alpha ={k}_{M}/{k}_{M}^{A}), (bar{alpha }={bar{k}}_{M}/{k}_{M}^{A}), and ({alpha }^{{prime} }={k}_{M}^{{prime} }/{k}_{M}^{A}), in which α represents the normalized rate constant of the auto-catalytic reaction for repressive histone modifications, and (bar{alpha }) and ({alpha }^{{prime} }) represent the normalized rate constants of the cross-catalytic reactions between repressive histone modifications and DNA methylation. Let us also introduce:
$$r=frac{{alpha }^{{prime} }}{alpha }=frac{{k}_{M}^{{prime} }}{{k}_{M}},$$
(1)
that is, the ratio between the rate at which repressive histone modifications enhance the establishment of DNA methylation through cross-catalytic reactions (({k}_{M}^{{prime} })) and the rate at which repressive histone modifications enhance their own establishment through auto-catalytic reactions (kM). Furthermore, we use η to represent the efficiency of the maintenance process of DNA methylation by DNMT126. The expression of η was derived in ref. 44 by accounting for the dilution of DNA methylation due to DNA replication and the maintenance process in which DNMT1 replicates CpG methylation on the newly synthesized DNA strand based on the pattern of the mother strand26,57. The expression of η is given by (eta ={delta }^{{prime} }/delta), in which δ represents the rate constant of the passive erasure through dilution and ({delta }^{{prime} }) represents the effective passive erasure rate constant obtained from the balance between the dilution and the maintenance process. In particular, η = 1 if DNMT1 is completely absent (no maintenance) and η = 0 if the maintenance process is 100% efficient. Now, we define:
$$tilde{mu }=frac{{tilde{k}}_{E}^{R}{D}_{tot}}{{k}_{E}^{A}},,,{tilde{mu }}^{{prime} }=frac{{tilde{{k}^{{prime} * }}}_{T}{D}_{tot}}{{k}_{E}^{A}},,,{varepsilon }_{d}=frac{delta }{{k}_{M}^{A}{D}_{tot}},,,{varepsilon }_{e}=frac{{bar{k}}_{E}^{A}}{{k}_{M}^{A}{D}_{tot}},,,{varepsilon }^{{prime} }=frac{{k}_{E}^{A}}{{k}_{M}^{A}},$$
(2)
with (tilde{beta }=O(1)) and (tilde{b}=O(1)) such that (({hat{k}}_{T}^{{prime} }{D}_{tot})/{bar{k}}_{E}^{A}=tilde{beta }{tilde{mu }}^{{prime} }) and (({hat{k}}_{E}^{R}{D}_{tot})/{bar{k}}_{E}^{A}=tilde{b}tilde{mu }), respectively. Specifically, (tilde{mu }) is a dimensionless parameter quantifying the asymmetry between the erasure rates of repressive and activating histone modifications, while ({tilde{mu }}^{{prime} }) is a dimensionless parameter quantifying the asymmetry between the erasure rates of DNA methylation and activating histone modifications. Furthermore, ({varepsilon }_{d}=delta /{k}_{M}^{A}{D}_{tot}) is the normalized rate constant associated with dilution due to DNA replication, and, since ({hat{k}}_{E}^{R}/{k}_{M}^{A}=tilde{b}tilde{mu }{varepsilon }_{e}), ({hat{k}}_{T}^{{prime} }/{k}_{M}^{A}=tilde{beta }{tilde{mu }}^{{prime} }{varepsilon }_{e}), ({tilde{k}}_{E}^{R}{D}_{tot}/{k}_{M}^{A}=tilde{mu }{varepsilon }^{{prime} }) and ({tilde{k}}_{T}^{{prime} * }{D}_{tot}/{k}_{M}^{A}={tilde{mu }}^{{prime} }{varepsilon }^{{prime} }), the dimensionless parameter εe (({varepsilon }^{{prime} })) scales the ratio between the rate of the basal erasure (recruited erasure) and the one of the auto/cross-catalysis of chromatin modifications. We collect the definitions and interpretations of these parameters in Fig. 1e.
Finally, for modeling the gene expression process, we introduce ({bar{p}}_{O}={alpha }_{O}/{gamma }_{O}), ({bar{p}}_{T}={alpha }_{T}/{gamma }_{T}), ({bar{p}}_{J}={alpha }_{J}/{gamma }_{J}), ({bar{u}}_{O}=({u}_{O}Omega )/{gamma }_{O}), ({bar{u}}_{T}=({u}_{T}Omega )/{gamma }_{T}), ({bar{u}}_{J}=({u}_{J}Omega )/{gamma }_{J}) and ({n}_{X}^{A}), with X = O, T, J, that is, the total amount of nucleosomes modified with activating chromatin modifications for each gene X.
We next describe the relationship between the abundance of MBD proteins (B) and the rate coefficients associated with the erasure of DNA methylation by the action of TET1. Specifically, these coefficients are ({tilde{k}}_{T}^{{prime} * }) for the reactions in which TET1 is recruited by DA (reactions ⑭) and ({hat{k}}_{T}^{{prime} }) for the reactions in which TET1 is not recruited by DA (reactions ⑩). As derived in44, ({hat{k}}_{T}^{{prime} }) and ({tilde{k}}_{T}^{{prime} * }) can be written as:
$${hat{k}}_{T}^{{prime} }=frac{{F}_{1}}{{F}_{2}frac{B}{{K}_{B}}+1},,,{tilde{k}}_{T}^{{prime} * }=frac{{F}_{3}}{{F}_{4}frac{B}{{K}_{B}}+1},$$
(3)
in which KB is the dissociation constant of the binding reaction between B and methylated DNA and F1, F2, F3 and F4 are parameters independent of B or KB. Then, ({hat{k}}_{T}^{{prime} }) and ({tilde{k}}_{T}^{{prime} * }) increase when B/KB decreases. From (2), ({tilde{mu }}^{{prime} }) is therefore an increasing function of ({tilde{k}}_{T}^{{prime} * }) that can be written as:
$${tilde{mu }}^{{prime} }=frac{{tilde{k}}_{T}^{{prime} * }{D}_{tot}}{{k}_{E}^{A}}=frac{{D}_{tot}}{{k}_{E}^{A}}frac{{F}_{3}}{{F}_{4}frac{B}{{K}_{B}}+1}=frac{{F}_{5}}{{F}_{2}frac{B}{{K}_{B}}+1},$$
(4)
in which ({F}_{5}={F}_{3}{D}_{tot}/{k}_{E}^{A}) is independent of B or KB. From (4), we can conclude that knocking down MBD proteins (B = 0) or locally preventing their binding to methylated DNA (KB → ∞) allows to increase ({tilde{mu }}^{{prime} }).
Effect of DNA methylation on the dynamics of OCT4 during differentiation
It has been experimentally observed that, during cellular differentiation, the OCT4 gene undergoes progressive silencing, with concurrent establishment of DNA methylation50. Here, we investigate how the rate constant of the DNA methylation erasure process by TET1 ({tilde{mu }}^{{prime} }) affects the first time that, without any external stimulus, the OCT4 gene reaches the repressed state ({n}_{O}^{A}approx 0) corresponding to a differentiated state36, starting from the active state ({n}_{O}^{A}/{{{{rm{D}}}}}_{{{{rm{tot}}}}}approx 1) (Fig. 3). For values of ({tilde{mu }}^{{prime} }) sufficiently large, none of the trajectories reach the OCT4 repressed state in the time window of the simulation, indicating stability of the high OCT4 expression state. By reducing ({tilde{mu }}^{{prime} }), most of the trajectories reach, although in a stochastic manner, the OCT4 repressed state. Finally, if we keep reducing ({tilde{mu }}^{{prime} }), then the trajectories reach ({n}_{O}^{A}approx 0) quickly and in a more synchronous fashion. This result suggests that, even if the initial state, where OCT4 gene is active, is devoid of DNA methylation, the stability of this active state is contingent on a sufficiently fast erasure of DNA methylation.
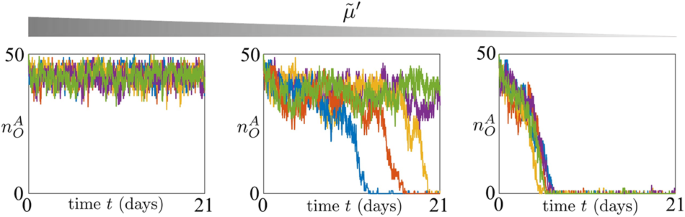
Time trajectories of ({n}_{O}^{A}) (total amount of nucleosomes modified with activating chromatin modifications for the OCT4 gene) starting from the OCT4 fully active state for different values of ({tilde{mu }}^{{prime} }). In all plots, on the x axis we have the time (days). The parameter values used for these simulations can be found in Supplementary Table 1. In particular, we set ({tilde{mu }}^{{prime} }=1,0.15,0.07), εd = 0.3, ({bar{p}}_{O}={bar{p}}_{T}={bar{p}}_{J}=3.2), η = 0.1, (tilde{mu }=1), εe = 0.3 and ({varepsilon }^{{prime} }=1). In our model, parameter ({tilde{mu }}^{{prime} }) quantifies the asymmetry between the erasure rates of DNA methylation and activating histone modifications. Mathematical definition of ({tilde{mu }}^{{prime} }) can be found in Eq. (2). For all simulations, we implemented the reactions listed in Fig. 1 with the SSA43 and we considered a time span of 21 days (τ = 201.6) and Dtot = 50 (see Supplementary Note 1).
Furthermore, given that TET1 is the enzyme catalyzing the erasure of DNA methylation (reactions ⑩ and ⑭ in Fig. 1b), this erasure is faster in the presence of high levels of TET1. We should then expect that stem cells have higher levels of TET1 and that, during differentiation, TET1 levels decline. This is consistent with in vivo studies showing that the level of TET1, highly expressed in embryonic stem cells (ESCs), decreases during cellular differentiation, reaching a low expression level after gastrulation58. This is also consistent with in vitro studies showing that in ESCs that start to differentiate, the level of OCT4 declines together with the level of TET159.
Finally, it is worth noting that H3K9me3 decay rate is estimated to be much higher than the decay rate of DNA methylation44,60. Therefore, decreasing the erasure rate constant of repressive histone modifications (tilde{mu }) has a lesser impact on both the speed of the differentiation process and the stability of the high OCT4 state compared to decreasing the erasure rate constant of DNA methylation (see Supplementary Fig. 1).
Effect of proliferation rate on reprogramming through OCT4 overexpression
Here, we investigate how the proliferation rate εd affects the efficiency of reprogramming when overexpressing OCT4 only. To this end, we analyzed the trajectory of the active chromatin state of the OCT4 gene, ({n}_{O}^{A}), starting from a fully repressed state (({n}_{O}^{A}={n}_{T}^{A}={n}_{J}^{A}=0)), when we artificially overexpress OCT4, by letting ({bar{u}}_{O} > 0) in the reactions listed in Fig. 1d. Now, we define the process efficiency %OA as the percentage of trajectories of ({n}_{O}^{A}) that reach the active state by a prefixed time. Then, for a fixed input ({bar{u}}_{O}), we evaluated %OA for different values of εd. Simulations show that increasing εd speeds up OCT4 reactivation dynamics, making the process more efficient (Fig. 4). These findings align with the experimental results reported by Hanna et al.32. In their study32, the authors investigated the impact of various factors, including proliferation rate and addition of Nanog to the original OSKM TF cocktail, on the kinetics of iPSCs formation from somatic cells. Notably, their findings demonstrate that a higher proliferation rate accelerates the reprogramming process. The reason why increasing εd makes the OCT4 reactivation process more efficient is that a higher εd leads to a higher decay rate of all modifications (Eq. (2), Figs. 1 and 2). Given that the initial state is the OCT4 repressed state, mainly characterized by repressive chromatin marks, then higher εd leads to a faster erasure of DNA methylation and repressive histone modifications. This, in turn, allows faster establishment of activating histone modifications, leading to a faster, and also more efficient reactivation of the OCT4 gene.
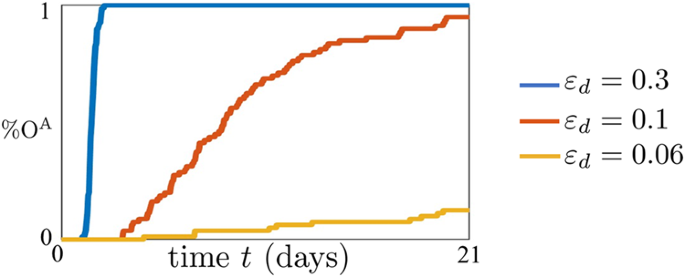
%OA for different values of εd, when we set ({bar{u}}_{0} > 0), capturing OCT4 overexpression. The parameter values used for these simulations can be found in Supplementary Table 1. In particular, we consider εd = 0.3, 0.1, 0.06 and we set ({bar{u}}_{0}=320), ({bar{u}}_{T}=0), ({bar{u}}_{J}=0), ({tilde{mu }}^{{prime} }=1), (bar{p}=5), in which (bar{p}={bar{p}}_{O}={bar{p}}_{T}={bar{p}}_{J}), η = 0.1, εe = 0.3, (tilde{mu }=1) and ({varepsilon }^{{prime} }=1) (see Supplementary Fig. 3 for how the parameters ({bar{u}}_{O}), εe, ({tilde{mu }}^{{prime} }), and (bar{p}) influence the impact of εd on the reprogramming process). In our model, parameter εd represents the normalized rate constant associated with dilution due to DNA replication. For all simulations, we implemented the reactions listed in Fig. 1 with the SSA43 and we considered a time span of 21 days (τ = 201.6) and Dtot = 50 (see Supplementary Note 1).
Reprogramming through concurrent OCT4 and TET1 overexpression
Here, we consider a reprogramming approach in which the enzyme TET1 is also overexpressed. We first determined how efficiency %OA and the latency variability are affected by different levels of TET1 overexpression ({bar{u}}_{T} > 0). To this end, we conducted several simulations for a fixed ({bar{u}}_{O}), capturing a fixed level of OCT4 overexpression and different values of ({bar{u}}_{T}) (Fig. 5). Simulations show that adding overexpression of TET1 makes the OCT4 reactivation process more efficient and reduces the latency variability (Fig. 5a). Specifically, the reduction of latency variability is captured by the narrower distribution in the values of ({bar{f}}_{L}), that is, the normalized frequency of a specific latency value across all the simulations. This reduction can be also captured by observing the shape of the curves %OA–time in Fig. 5a. As the level of TET1 overexpression increases, the synchronization of OCT4 reactivation events also increases, resulting in steeper curves. Overall, these results can be justified by the fact that activating histone modifications can be established only on unmodified nucleosomes, as shown in the chromatin modification circuit diagram (Fig. 1c), and therefore the reprogramming process cannot start until repressive modifications are erased. Accordingly, while OCT4 recruits writers for activating chromatin modifications, TET1 erases DNA methylation. OCT4 overexpression can have an effect only when unmodified nucleosomes are present, which is allowed with higher probability by the presence of TET1. These results are in agreement with experimental data showing that the addition of TET1 to the original OSKM TF cocktail increases iPSC reprogramming efficiency, promoting the formation of OCT4+ colonies24.
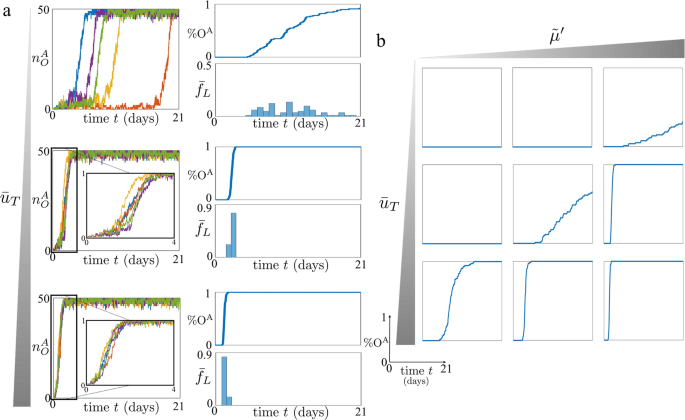
a Left hand side plots: time trajectories of ({n}_{O}^{A}) (total amount of nucleosomes modified with activating chromatin modifications for the OCT4 gene) starting from the OCT4 fully repressed state (({n}_{O}^{A}=0)) for different values of ({bar{u}}_{T}). Right hand side plots: %OA, that is, the normalized amount of N = 100 time trajectories which reach ({n}_{O}^{A}ge 40), starting from ({n}_{O}^{A}=0), and ({bar{f}}_{L}), that is, the normalized frequency of a latency value across all the N = 100 simulations. In all plots, on the x axis we have the time (days). The parameter values used for these simulations can be found in Supplementary Table 1. In particular, we consider three values of ({bar{u}}_{T}) (i.e., ({bar{u}}_{T}=0,50,160)), and we set ({bar{u}}_{O}=320), ({bar{u}}_{J}=0), ({tilde{mu }}^{{prime} }=0.5), εd = 0.2, εe = 0.2, ({bar{p}}_{O}={bar{p}}_{T}={bar{p}}_{J}=5), η = 0.1, (tilde{mu }=1) and ({varepsilon }^{{prime} }=1) (see Supplementary Fig. 4 for how the parameters ({bar{u}}_{O}), εd, εe, ({tilde{mu }}^{{prime} }), and (bar{p}) influence the impact of ({bar{u}}_{T}) on the reprogramming process). b %OA for different values of ({tilde{mu }}^{{prime} }) and ({bar{u}}_{T}). The parameter values used for these simulations can be found in Supplementary Table 1. In particular, we consider ({bar{u}}_{T}=0,50,160), ({tilde{mu }}^{{prime} }=3,0.5,0.2), εd = 0.1, εe = 0.1, and all the other parameter values equal to the ones considered for the simulations in (a) (see Supplementary Fig. 4 for how the parameters ({bar{u}}_{O}), εd, εe, and (bar{p}) influence the impact of ({bar{u}}_{T}) and ({tilde{mu }}^{{prime} }) on the reprogramming process). In our model, ({tilde{mu }}^{{prime} }) quantifies the asymmetry between the erasure rates of DNA methylation and activating histone modifications. For all simulations, we implemented the reactions listed in Fig. 1 with the SSA43 and we considered a time span of 21 days (τ = 201.6) and Dtot = 50 (see Supplementary Note 1).
However, in these experiments, the efficiency of the reprogramming process was not increased pronouncedly. Specifically, the authors obtained only a twofold increase in the number of OCT4+ colonies observed at day 13 after doxycycline (Dox) induction24. This is surprising if one does not consider the role of MBD proteins, which is captured in our model by Eq. (4). Specifically, according to this model, MBD proteins bind to methylated CpG dinucleotides33 and then protect them from being bound by TET134. This, in turn, results in the erasure rate of DNA methylation not increasing substantially when TET1 is added if MBD proteins (B) level is high. Therefore, TET1 overexpression only scarcely enhances the erasure rate of DNA methylation unless MBD proteins are either knocked down or prevented from binding DNA (see expression of ({tilde{mu }}^{{prime} }) in Eq. (4)). In order to verify how different levels of MBD affect the OCT4–TET1 overexpression reprogramming approach, we thus evaluated %OA for several values of ({bar{u}}_{T}) and ({tilde{mu }}^{{prime} }) (Fig. 5b). The higher ({tilde{mu }}^{{prime} }) is, obtained by lowering the MBD proteins level, the more efficient and less variable the reactivation process is. These results are consistent with previous experimental data showing that knock down of MBDs increases significantly the efficiency of iPSC reprogramming and reduces its latency variability21,31.
Our results also show that, independent of the MBD protein level, by sufficiently increasing TET1 expression, OCT4 reactivation achieves an almost constant latency and high efficiency (Fig. 5b). Although this is in principle possible, it is also plausible that in practice the high levels of TET1 required to achieve this may be toxic to the cell or may not even be practically reachable.
Reprogramming through concurrent OCT4 and JMJD2 overexpression
Based on experimental studies conducted in the last decade, the repressive histone modification H3K9me3 seems to be a similarly crucial barrier for the reprogramming process22,61. Indeed, it was shown that the addition of JMJD2 in the OSKM cocktail enhances the reprogramming efficiency, resulting in a ≈1.75-fold increase in the number of iPSC colonies obtained within the experimental time frame (8 days)22.
Thus, we evaluated efficiency and latency variability for three different levels of JMJD2 overexpression, ({bar{u}}_{J}) (Fig. 6a). Furthermore, in order to properly compare this reprogramming approach to the one based on concurrent OCT4 and TET1 overexpression, we considered the same value as used in the previous analysis for the OCT4 overexpression level (({bar{u}}_{O})). Simulations show that JMJD2 overexpression reduces the latency variability of the reprogramming process and increases the number of trajectories of ({n}_{O}^{A}) that reach the active state by a fixed time period (Fig. 6a), in agreement with the experimental data in ref. 22.
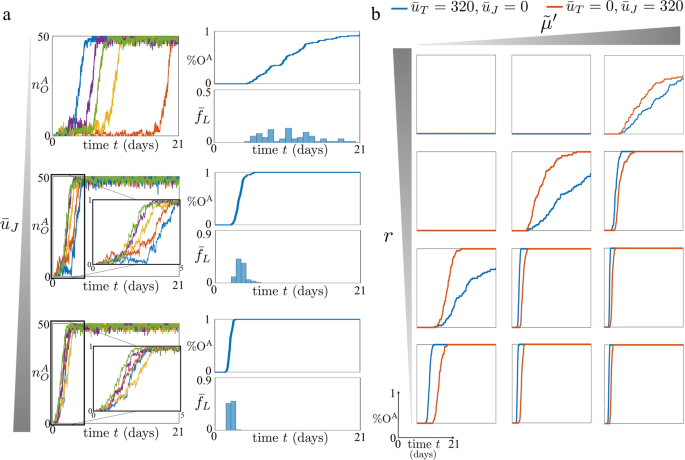
a Left hand side plots: time trajectories of ({n}_{O}^{A}) (total amount of nucleosomes modified with activating chromatin modifications for the OCT4 gene) starting from the OCT4 fully repressed state (({n}_{O}^{A}=0)) for different values of ({bar{u}}_{J}). Right hand side plots: %OA, that is, the normalized amount of N = 100 time trajectories which reach ({n}_{O}^{A}ge 40), starting from ({n}_{O}^{A}=0), and ({bar{f}}_{L}), that is, the normalized frequency of a specific latency value across all the N = 100 simulations. In all plots, on the x axis we have the time (days). The parameter values used for these simulations can be found in Supplementary Table 2. In particular, we consider three values of ({bar{u}}_{J}) (i.e., ({bar{u}}_{J}=0,50,160)), and we set ({bar{u}}_{T}=0), ({bar{u}}_{O}=320), ({tilde{mu }}^{{prime} }=0.5), εd = 0.2, εe = 0.2, ({bar{p}}_{O}={bar{p}}_{T}={bar{p}}_{J}=5), η = 0.1, (tilde{mu }=1) and ({varepsilon }^{{prime} }=1) (see Supplementary Fig. 5 for how the parameters ({bar{u}}_{O}), εd, εe, ({tilde{mu }}^{{prime} }), and (bar{p}) influence the impact of ({bar{u}}_{J}) on the reprogramming process). b %OA for different values of (tilde{mu }) and r. The parameter values used for these simulations can be found in Supplementary Table 2. In particular, we consider ({bar{u}}_{T}=320,{bar{u}}_{J}=0) (blue lines), ({bar{u}}_{T}=0,{bar{u}}_{J}=320) (red lines) and, for both cases ({bar{u}}_{O}=160), ({tilde{mu }}^{{prime} }=1,0.5,0.2), r = 10, 5, 1, 0.2, (tilde{mu }=1), εd = 0.16, εe = 0.16, ({bar{p}}_{O}={bar{p}}_{J}={bar{p}}_{T}=5), η = 0.1 and ({varepsilon }^{{prime} }=1) (see Supplementary Fig. 6 for how εd, εe, and the initial overexpression level influence the impact of ({bar{u}}_{T}), ({bar{u}}_{J}), ({tilde{mu }}^{{prime} }), and r on the reprogramming process). In our model, ({tilde{mu }}^{{prime} }) quantifies the asymmetry between the erasure rates of DNA methylation and activating histone modifications and r the ratio between the rate at which repressive histone modifications enhance the establishment of DNA methylation through cross-catalytic reactions and the rate at which repressive histone modifications enhance their own establishment through auto-catalytic reactions. Mathematical definitions of r and ({tilde{mu }}^{{prime} }) can be found in (1) and (2), respectively. For all simulations, we implemented the reactions listed in Fig. 1 with the SSA43 and we considered a time span of 21 days (τ = 201.6) and Dtot = 50 (see Supplementary Note 1).
We next compared efficiency and latency variability of the OCT4–TET1 overexpression approach to those of the OCT4–JMJD2 overexpression approach (Fig. 6b). The results show how efficiency and latency variability of both approaches are affected by ({tilde{mu }}^{{prime} }) and (r={alpha }^{{prime} }/alpha). Parameter r is the ratio between the rate of the cross-catalytic reaction with which repressive histone modifications enhance the establishment of DNA methylation and the rate of the auto-catalytic reaction with which repressive histone modifications enhance their own establishment (Eq. (1)). For high values of DNA methylation erasure rate, ({tilde{mu }}^{{prime} }), the OCT4–JMJD2 overexpression approach is more efficient than the OCT4–TET1 overexpression approach only when r ≫ 1, that is, repressive histone modifications enhance the establishment of DNA methylation more than their own establishment (Fig. 6b). In fact, in this parameter regime, DNA methylation is rapidly erased (({tilde{mu }}^{{prime} }) large), but it is also quickly re-established by repressive histone modifications (r large). Thus, overexpression of JMJD2 leads to a fast erasure of repressive histone modifications. As a result, the absence of repressive histone modifications prevents the quick re-establishment of DNA methylation, leading to a rapid erasure of DNA methylation and reactivation of the OCT4 gene. In this case, using OCT4–JMJD2 overexpression for reprogramming could be more efficient and exhibit less variability in latency compared to OCT4–TET1 overexpression. For lower ({tilde{mu }}^{{prime} }), overexpression of OCT4–JMJD2 becomes more effective even with lower values of r (Fig. 6b). In fact, if ({tilde{mu }}^{{prime} }) is low, even a high level of TET1 overexpression may be insufficient to erase DNA methylation. However, a similar level of JMJD2 overexpression could be sufficient to erase repressive histone modifications. Then, similarly to the previous case, if the enhancement of DNA methylation by H3K9me3 is significant (r is sufficiently high), erasing repressive histone modifications prevents the strong re-establishment of DNA methylation by H3K9me. This leads to an acceleration in DNA methylation erasure, resulting in a faster and less stochastic reactivation of the OCT4 gene.
Overall, these results suggest that, due to the enhancement of DNA methylation by the positive reinforcement with H3K9me3, the addition of JMJD2 to OCT4 overexpression may be more effective than the addition of TET1. However, for ({tilde{mu }}^{{prime} }) sufficiently high, OCT4–TET1 overexpression approach is always more efficient than the OCT4–JMJD2 overexpression approach.
In previously conducted experimental studies, it was observed that the addition of JMJD2 to the OSKM cocktail resulted in an approximate 1.75-fold increase in the number of iPSC colonies22. This efficiency improvement is smaller compared to the effect achieved by adding TET1 to the OKSM cocktail, resulting in a twofold increase24, or even a minimum of tenfold increase when MBDs were knocked down21,31. These results indicate that in practical scenarios, we are likely to encounter a parameter regime where the enhancement of DNA methylation establishment through repressive histone modifications is not highly effective (low r). According to our theoretical findings, this leads to a situation where the OCT4–TET1 overexpression reprogramming approach is more efficient compared to the OCT4–JMJD2 reprogramming approach. Furthermore, this efficiency improves even further when MBD is reduced or knocked down (higher ({tilde{mu }}^{{prime} })).
- SEO Powered Content & PR Distribution. Get Amplified Today.
- PlatoData.Network Vertical Generative Ai. Empower Yourself. Access Here.
- PlatoAiStream. Web3 Intelligence. Knowledge Amplified. Access Here.
- PlatoESG. Carbon, CleanTech, Energy, Environment, Solar, Waste Management. Access Here.
- PlatoHealth. Biotech and Clinical Trials Intelligence. Access Here.
- Source: https://www.nature.com/articles/s41540-023-00326-0