Study design, ethical statement, and sample collection
The vaccinated participants were recruited under the COVID-19 PROTECT study (2012/00917). The convalescent plasma samples were collected from subjects who were diagnosed with COVID-19 by positive polymerase chain reaction (PCR) results (study 2020/00120). All participants provided written informed consent in accordance with the Declaration of Helsinki for Human Research. Ethics committee of National Healthcare Group (NHG) Domain Specific Review Board (DSRB) Singapore gave ethical approval for this work.
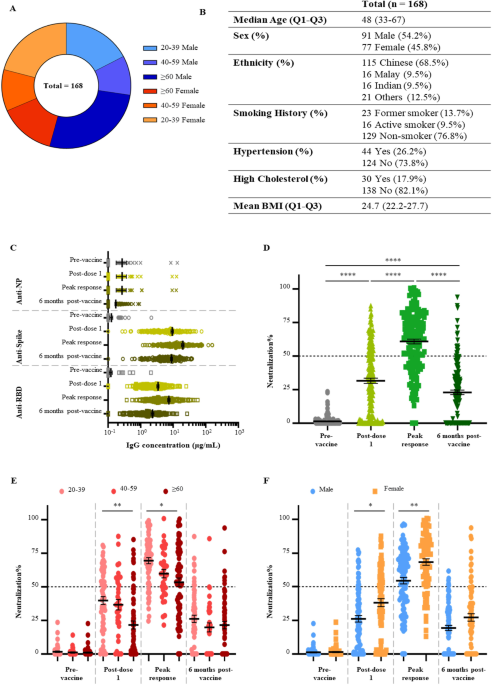
All vaccinated participants received two doses of the Pfizer/BioNTech BNT162b2 mRNA vaccine at 21 days apart. Four plasma samples were collected from each participant: on the day of first dose, before vaccination (i.e., pre-vaccination); on the day of second dose, before vaccination (i.e., post-dose one); 3 months after the first dose (i.e., peak response); and 6 months after the first dose. In addition, plasma sample from a fifth timepoint at 1 to 3 months after the booster dose (i.e., third dose) were collected from 27 individuals. To analyze the response to vaccination in the general population, participants with known SARS-CoV-2 infection history and participants under immunosuppressive treatments were excluded. A total of 699 plasma samples from 168 participants were included in this study.
Ten convalescent plasma samples were collected 1 to 3 months after diagnosis. All convalescent volunteers had recovered prior to sample collection.
Expression and purification of SARS-CoV-2 antigens and receptors
SARS-CoV-2 Spike hexapro, RBD and ACE2 were purified as described elsewhere39. RBD variants were made using RBD as the template and KLD enzyme mix (NEB) and expressed and purified using the same method as for RBD. Primers used are listed in Supplementary Table 5.
Gene encoding SARS-CoV-2 Nucleocapsid (Biobasic) was cloned into Pnic28, expressed in BL21 (DE3), and purified from soluble fraction using cOmplete™ his tag purification resin (Roche).
Quantitative ELISA/RBD variant binding ELISA
Antigens were diluted in 1× PBS and coated onto 96-well flat-bottom maxi-binding immunoplates (SPL Life Sciences #32296) by incubating at 4 °C overnight. Plate was washed three times with washing buffer (1× PBS with 0.05% Tween-20) and blocked with blocking buffer (3% bovine serum albumin in washing buffer) for 60 min incubation. Plasma samples were diluted 200-times and 5000-times in blocking buffer and added to the plates. To estimate the concentrations of anti-spike and anti-RBD antibodies, an RBD-specific human monoclonal IgG antibody named LSI-COVA-015 isolated from COVID-19 convalescent patient was diluted to a series of concentrations ranging from1 ng/mL to 1 µg/mL and added. Similarly, a nucleocapsid-specific monoclonal IgG antibody named LSI-COVANC-D generated from hybridoma cloning40,41 was added at the same concentrations to estimate the concentration of anti-nucleocapsid antibodies in the plasma samples. After 60 min incubation, plate was washed and incubated with goat anti-human IgG-HRP antibodies (Invitrogen #31413, diluted 10,000-times in blocking buffer) for 50 min, protected from light. Plate wash step was repeated and TMB substrate (Thermo Scientific #34029) was added. After 3 min incubation, reaction was stopped with 1 M H2SO4 and optical density at 450 nm (OD450) were recorded. Standard curves were constructed using the reference antibodies from 100 to 1 ng/mL, and the concentration of antigen-specific IgG antibodies in plasma samples were calculated via interpolation.
For the RBD variant binding ELISA, plasma samples were tested at 100-times dilution. A negative control (100-times diluted heat-inactivated FBS) and a positive control (ACE2-Fc at 5 µg/mL in negative control) were included for each variant in each plate.
SARS-CoV-2 pseudotyped lentivirus production
Reverse transfection methodology was employed to generate pseudotyped viral particles expressing SARS-CoV-2 Spike proteins, using a third-generation lentivirus system. A total of 36 × 106 HEK293T cells were transfected with 27 µg pMDLg/Prre (Addgene, #12251), 13.5 µg Prsv-Rev (Addgene, #12253), 27 µg Ptt5LnX-WHCoV-St19 (SARS-CoV-2 Spike) and 54 µg Phiv-Luc-ZsGreen (Addgene, #39196) using Lipofectamine 3000 transfection reagent (Invitrogen, #L3000-150) and cultured in a 37 °C, 5% CO2 incubator for three days. At day 4, the viral supernatant was collected and filtered through a 0.45 µm filter unit (Merck). The filtered pseudovirus supernatant was concentrated using 40% PEG 6000 via centrifugation at 1600g for 60 min at 4 °C. Lenti-X p24 rapid titer kit (Takara Bio, #632200) was used to quantify the viral titers, as per manufacturer’s protocol.
Pseudovirus neutralization test (PVNT)
ACE2 stably expressed CHO cells were seeded at a density of 5 × 10⁴ cells in 100 µL of complete medium [DMEM/high glucose with sodium pyruvate (Gibco, #10569010), supplemented with 10% FBS (Hyclone, #SV301160.03), 10% MEM Non-essential amino acids (Gibco, #1110050), 10% geneticin (Gibco, #10131035) and 10% pencillin/streptomycin (Gibco, #15400054)], in 96-well white flat-clear bottom plates (Corning, #353377). The cells were cultured in 37 °C with humidified atmosphere at 5% CO2 for 24 h. The next day, subject plasma samples were diluted to a final dilution factor of 80 with sterile 1× PBS. The diluted samples were then incubated with an equal volume of pseudovirus at a concentration of 2 × 10⁶ IFU/mL to achieve a total volume of 50 µL, at 37 °C for 1 h. The pseudovirus-plasma mixture was added to the CHO-ACE2 monolayer cells and left incubated for 1 h to allow pseudotyped viral infection. Subsequently, 150 µL of complete medium was added to each well for a further incubation of 48 h. The cells were washed twice with sterile PBS. 100 µL of ONE-glo™ EX luciferase assay reagent (Promega, #E8130) was added to each well and the luminescence values were read on the Tecan Spark 100 M. The percentage neutralization was calculated as follows:
$$Neutralizationmathrm{% }=frac{Readout ; left(unknowright)-Readout ; left(infected ; controlright)}{Readout ; left(uninfected ; contorlright)-Readout (infected ; control)}times 100%$$
PVNT-derived IC50 values (IU/Ml) using calibrated anti-SARS-CoV-2 Immunoglobulin WHO international standard
The ID50 (Inhibitory dilution factor at 50% neutralization) values obtained from the PVNT were converted to IC50 (inhibitory concentration at 50% neutralization) values, using the WHO international standard for anti-SARS-CoV-2 immunoglobulin (20/136). The PVNT assay was conducted as described above. The pseudovirus mixture was incubated with eight serial fivefold dilutions of international standard (1:100 start dilution). The values were then plotted and ID50 was determined. As per WHO’s protocol, 20/136 was assigned an arbitrary value of 250 IU/ampoule (1000 IU/mL) for neutralizing activity. A calibration factor was derived based on ID50 converted to IU/mL (1000/ ID50). Following this, ID50 values were similarly obtained from nine vaccinee samples and three pooled plasma samples from the WHO reference panel (20/150, 20/148, 20/140) incubated with three serial fivefold dilutions (1:100 start dilution). The ID50 values were then converted to IC50 (IU/mL) by multiplying the calibration factor.
RBD variant binding ELISA
The binding ability of plasma samples to RBD variants were tested using an ELISA protocol similar to the one described earlier. RBD variants were coated at 1 µg/mL and plasma samples were tested at 100-times dilution. A negative control (100-times diluted heat-inactivated FBS) and a positive control (ACE2-Fc at 5 µg/mL in negative control) were included for each variant in each plate. Reported OD450 was calculated by subtracting the background OD450 of diluted plasma binding to blocking buffer from OD450 of diluted plasma binding to RBD variants.
ACE2-RBD binding inhibition ELISA
The ability of plasma samples to inhibit the binding interaction between ACE2 and RBD variants were evaluated using a protocol similar to the RBD variant binding ELISA. Wuhan-Hu-1, Alpha, Beta, Gamma, and Delta RBD were coated at 1 µg/mL. Wuhan-Hu-1 RBD and Omicron RBD were coated at 2 µg/mL. Wuhan-Hu-1 RBD were coated at two concentrations for calibration of Omicron RBD results to account for the difference in coating concentrations. Plasma samples were tested at 5-times dilution, and the secondary antibody used was ACE2-Peroxidase (conjugated using Peroxidase-labelling kit-NH2, Abnova #KA0014), at 600 ng/mL for Omicron, or 300 ng/mL for all other RBD variants. A negative control (5-times diluted heat-inactivated FBS) and a positive control (ACE2-Fc at 100 µg/mL in negative control) were included for each variant in each plate. Inhibition% was calculated using the following formula:
$$Inhibitionmathrm{% }=frac{Readout ; left(negative; controlright)-Readout ;left(sampleright)}{Readout; left(negative ;controlright)}times 100%$$
Interaction kinetics
Binding kinetics between human ACE2 receptor and SARS-CoV-2 RBD were measured using the Attana Cell 200 (Attana AB), which employs quartz crystal microbalance technology. Standard amine coupling chemistry was used to immobilise Wuhan-Hu-1 RBD or Omicron RBD to LNB-carboxyl sensor chips. Chips were stabilised at a flow rate of 20 µL/min at 22 °C using HBST as running buffer. Triplicate injections were made with human ACE2-Fc at five concentrations followed by regeneration with 10 Mm Glycine (Ph 2).
To examine inhibition of this interaction by SARS-CoV-2 neutralizing antibodies, a second experiment was performed using a fresh LNB-carboxyl chip immobilised as previously with Wuhan-Hu-1 RBD. Triplicate injections were made, in randomized order, over the stabilised surface using 20-times diluted pre-vaccination human plasma, either alone or spiked with 1.67 × 10⁻⁸ M neutralizing antibody COVA2-3931; 1.67 × 10⁻⁸ M non-neutralizing antibody, LSI-COVA-15; or 20-times diluted WHO Diagnostic Calibrant (pooled convalescent plasma). After each injection 2.6 × 10⁻⁷ M ACE2 was subsequently injected over the surface and allowed to dissociate before regeneration, as described previously.
Negligible noise (< 3 Hz) was detected on the reference channel. Curve fitting and data analysis was performed using TraceDrawer software.
Statistical analysis
Continuous demographic data were presented as median with interquartile range (IQR) while categorical demographic data and medical history information were presented as absolute number with proportion (%). Multiple linear regression was used to evaluate the effect of demographic information (age, sex, ethnicity, BMI) and medical history (smoking status, hypertension, high cholesterol) on SARS-CoV-2 antigen-specific IgG concentrations, and neutralizing antibody levels respectively. Neutralizing antibody levels and antigen-specific IgG concentrations across timepoints were evaluated using the non-parametric Kruskal–Wallis test followed by the Dunn’s test to correct for multiple comparisons. Association between the neutralization% from PVNT and inhibition% from ACE2-RBD binding inhibition ELISA was modelled using simple linear regression, and the Pearson’s correlation coefficient was also reported. Binding data and ACE2 inhibition data on RBD variants were compared to the original Wuhan-Hu-1 strains using the Kruskal–Wallis test followed by the Dunn’s test. Results on Wuhan-Hu-1 strain and other RBD variants were compared to the Omicron RBD using the Kruskal–Wallis test followed by the Dunn’s test. All statistical tests were two-tailed when applicable. All experiments were performed with three technical repeats. Mean and standard error of the mean (SEM) are shown in all graphs unless otherwise stated. All analyses were performed using Graphpad Prism 9.0 and can be found in Supplementary Data.
- SEO Powered Content & PR Distribution. Get Amplified Today.
- PlatoData.Network Vertical Generative Ai. Empower Yourself. Access Here.
- PlatoAiStream. Web3 Intelligence. Knowledge Amplified. Access Here.
- PlatoESG. Carbon, CleanTech, Energy, Environment, Solar, Waste Management. Access Here.
- PlatoHealth. Biotech and Clinical Trials Intelligence. Access Here.
- Source: https://www.nature.com/articles/s41598-023-49231-w